Esri uses its own Big Data tools
Using ArcGIS tools it developed for Big Data analysis, Esri found a better way to analyze ArcGIS Online map tile requests so it can more intelligently prioritize basemap service updates.
Daily map tile requests—now in the billions—have outstripped previous methods that relied on RDBMS-based log file analysis. However, Big Data technology offers new options. Hadoop, an open-source framework that enables parallel processing on large data stores, has become synonymous with Big Data solutions because its cluster-based method allows billions of records to be analyzed in a few hours.
Because Hadoop lacks the native functionality to exploit the spatial component in Big Data, Esri designed GIS Tools for Hadoop and Geoprocessing Tools for Amazon Web Services (GP Tools for AWS) to extend the platform with utilities for spatially operating on billions of records at a time. The tools were released last year and are available on Esri’s GitHub space.
Esri processed and analyzed its own log files to get more fine-grained information about map tile requests such as where the requests originated and what geographies were being viewed.
A couple of team members, who had minimal Hadoop experience and little knowledge of Big Data analytics software and processes, were given the Esri Big Data tools to work with the ArcGIS Online log data. The goal was to see if every step in the traditional RDBMS cycle of data analysis (e.g., filtering, aggregating) could be extended to the Big Data analytics sphere. That turned out to be the case: every component of the “small” SQL analysis was analogous to the Big Data environment of Hadoop. For example, Hive is a component of Hadoop that allows users to make their queries in a SQL-like language called Hive Query Language (HQL).
Even on a large scale and even without Hadoop experience, the new process was so similar to familiar SQL analysis that team members could use these tools to run reports on Esri basemap usage around the world. These reports gave Esri a much more detailed understanding of which imagery tiles Esri customers used in a much shorter time frame.
Elastic Map Reduce (EMR) allows users with limited experience to take advantage of Hadoop’s capabilities because it is hosted and managed in the Amazon Web Services (AWS) cloud. It also uses Simple Storage Service (S3) to store the data, which simplifies the operations side of storing the log files for analysis. By using EMR and S3 in AWS, the team didn’t have to invest time building or maintaining a Hadoop cluster. Team members just started the EMR cluster when they needed to execute analysis and turned it off when they didn’t need it anymore.
Using Hadoop, the team wrote scripts to comb the log data collected from Esri’s servers and calculate and filter the needed information from them. The project used GIS Tools for Hadoop to geospatially enable Hadoop as part of the GP Tools for AWS implementation. GP Tools for AWS leverages AWS by allowing ArcGIS users to run analyses on log file data loaded in S3.
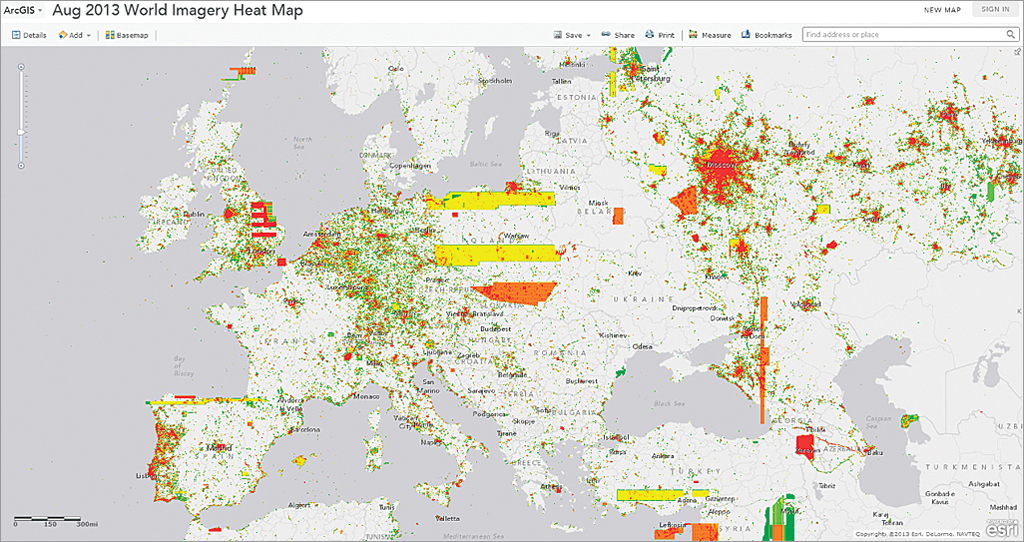
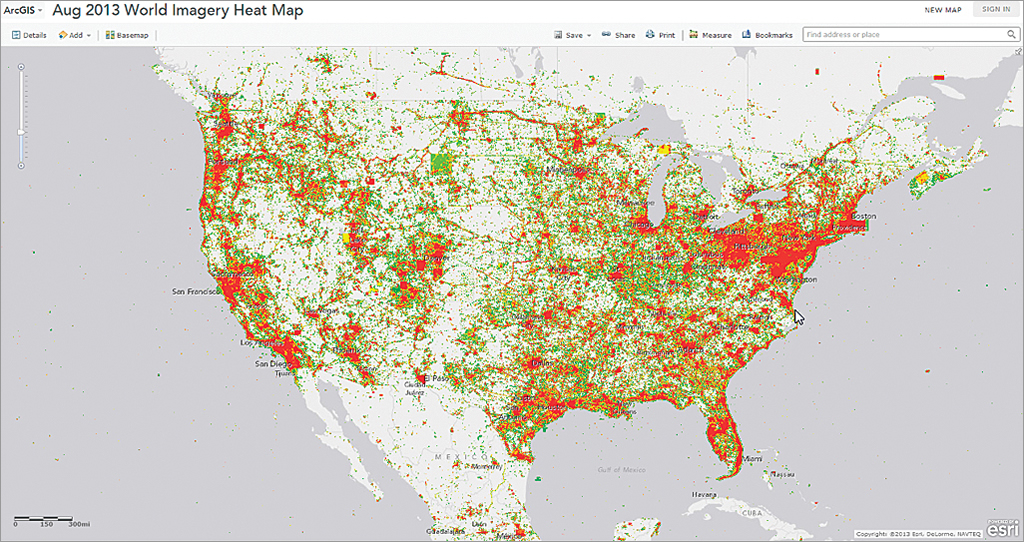
After processing and analyzing the data, team members imported the results into ArcGIS for Desktop. To visualize this data, they created heat maps of the United States and Europe that represented the billions of tile requests that came into ArcGIS Online during August 2013. Hadoop was instrumental in helping the team process the source data that populates these maps. This analysis revealed that most people who use the World Imagery map service are from urbanized areas in the United States and Europe.
Although this use case involved log files, the same principles of analysis apply to any flat files and datasets that have grown so unwieldy that nothing can be gleaned from them via traditional RDBMS methods.
Esri has shared the sample data and script used for this project on its GP Tools for AWS project page in GitHub. This sample data, along with instructions for generating a map based on web log analysis results, is contained in the sample 1 folder. The log data samples included in this example were extracted from ArcGIS logs, cleaned up, and formated as comma-separated (CSV) files. These CSV files provide a good starting point fo r getting familiar with this analysis.
For more resources and information on geospatially enabling Big Data, visit Esri’s Big Data resource pages.
About the author