Whether I’m looking for the next peak to conquer or a scenic route to wander, I like to explore and fully evaluate my options. As a hiker, a climber, a biker, or even a paraglider, understanding the lay of the land before getting out there is key to being prepared.
With the Elevation Profile widget in ArcGIS Experience Builder, you can assess the intensity and technicality of a route by examining the elevation changes and choose suitable paths based on the desired challenge.
In this tip, you will use the Elevation Profile widget to build a basic trail viewer application that will allow users to create their own paths and evaluate alternative routes. You will also be able to customize the layout, themes, and content to suit your needs. You will need an ArcGIS organizational account with content creation privileges to complete this tip.
Create a Trail Viewer App
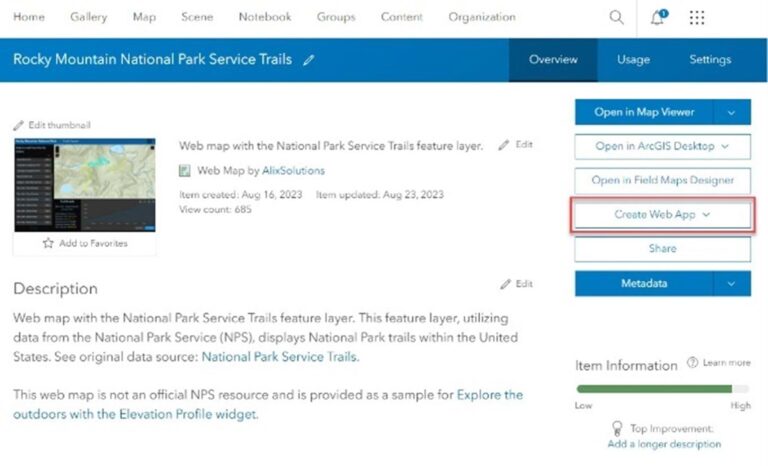
Step 1: Sign in to your ArcGIS Online account or get a free ArcGIS trial. If you have a web map with trail data, you can use this to create a trail viewer app. If not, use the Rocky Mountain National Park Service Trails map sample to follow along.
Step 2: From the web map item page, click Create Web App and choose Experience Builder.
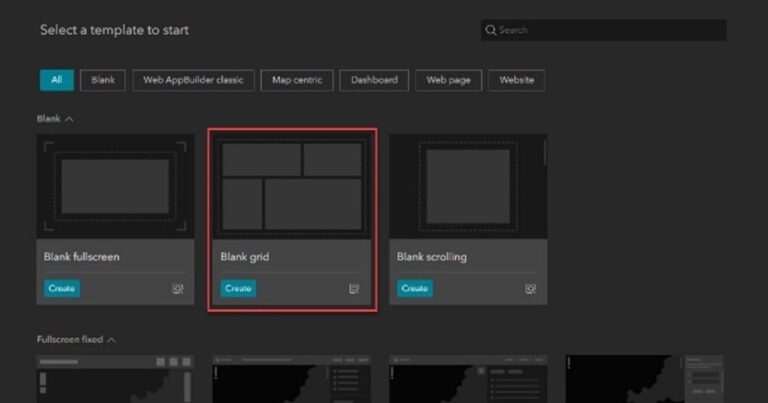
Step 3: Find the Blank grid template and click Create.
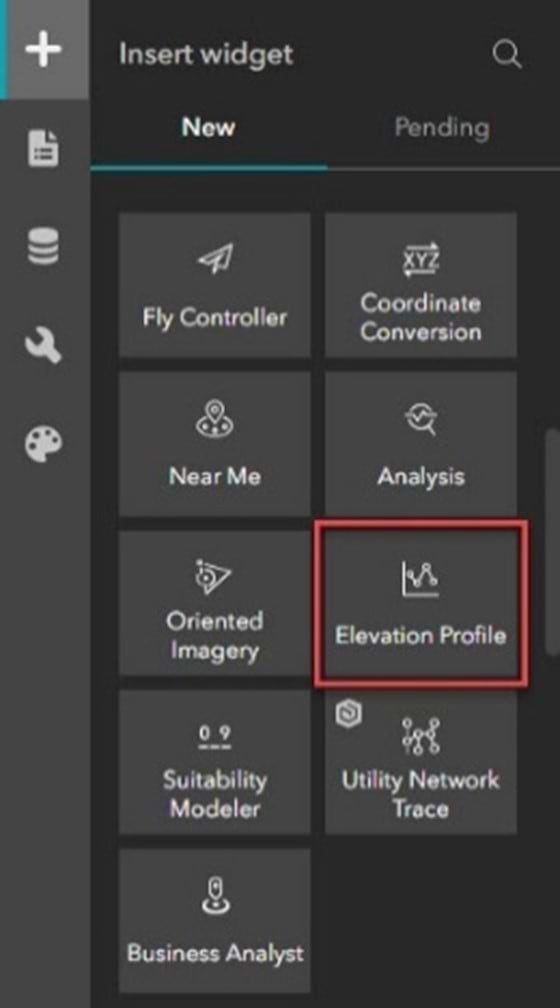
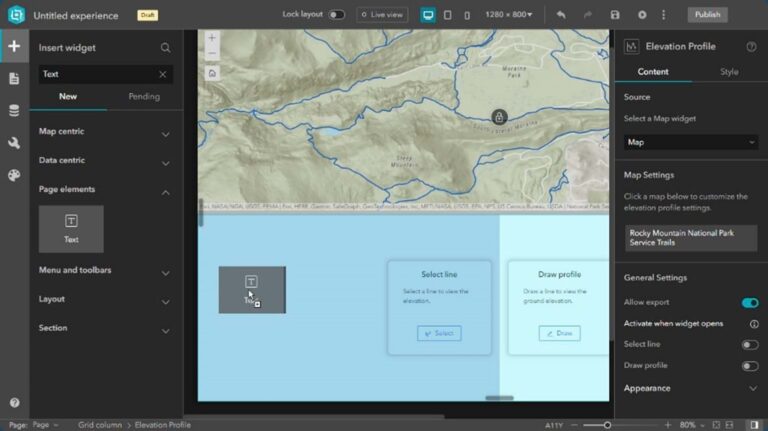
Step 4: From the Insert widget panel, find the Elevation profile widget and drag it below the Map widget to add it to your trail viewer.
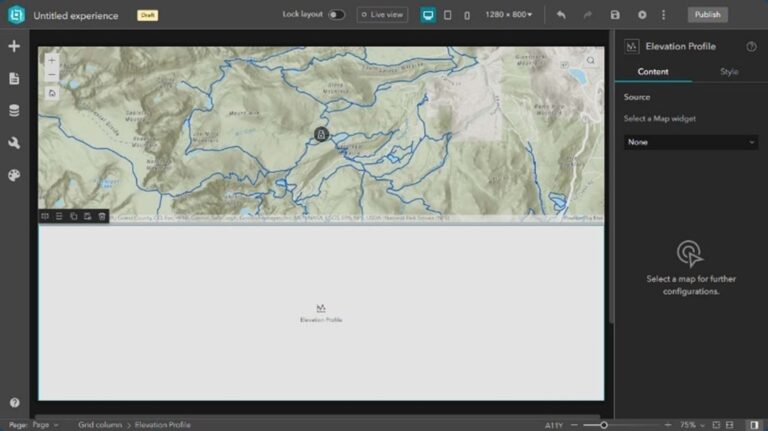
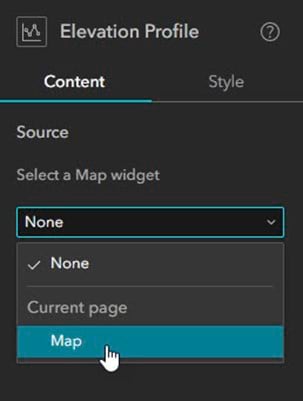
Step 5: Connect the Elevation Profile widget to the Map widget. To do this, click the drop-down menu under Select a Map widget on the right-hand panel and select Map.
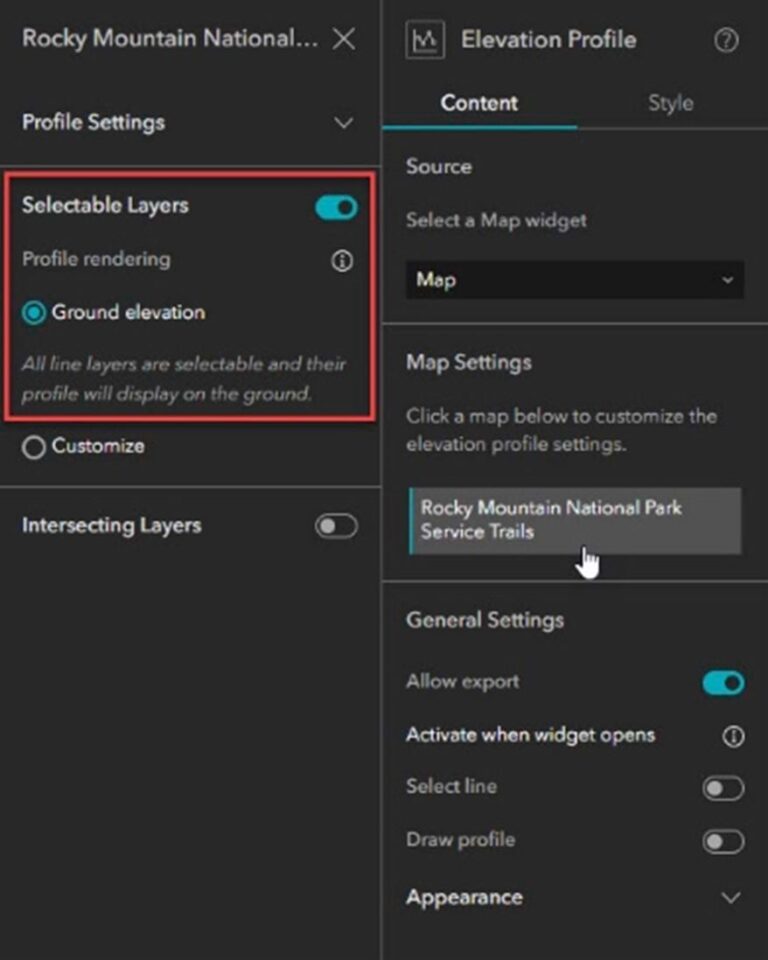
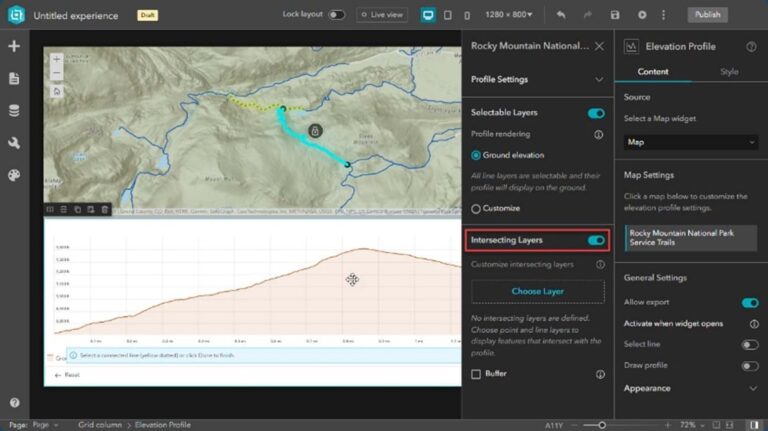
Step 6: Click Rocky Mountain National Park Service Trails under Map Settings and enable Selectable Layers. This will display the ground elevation profile when selecting lines on the map.
Step 7: Click Live view in the top toolbar.

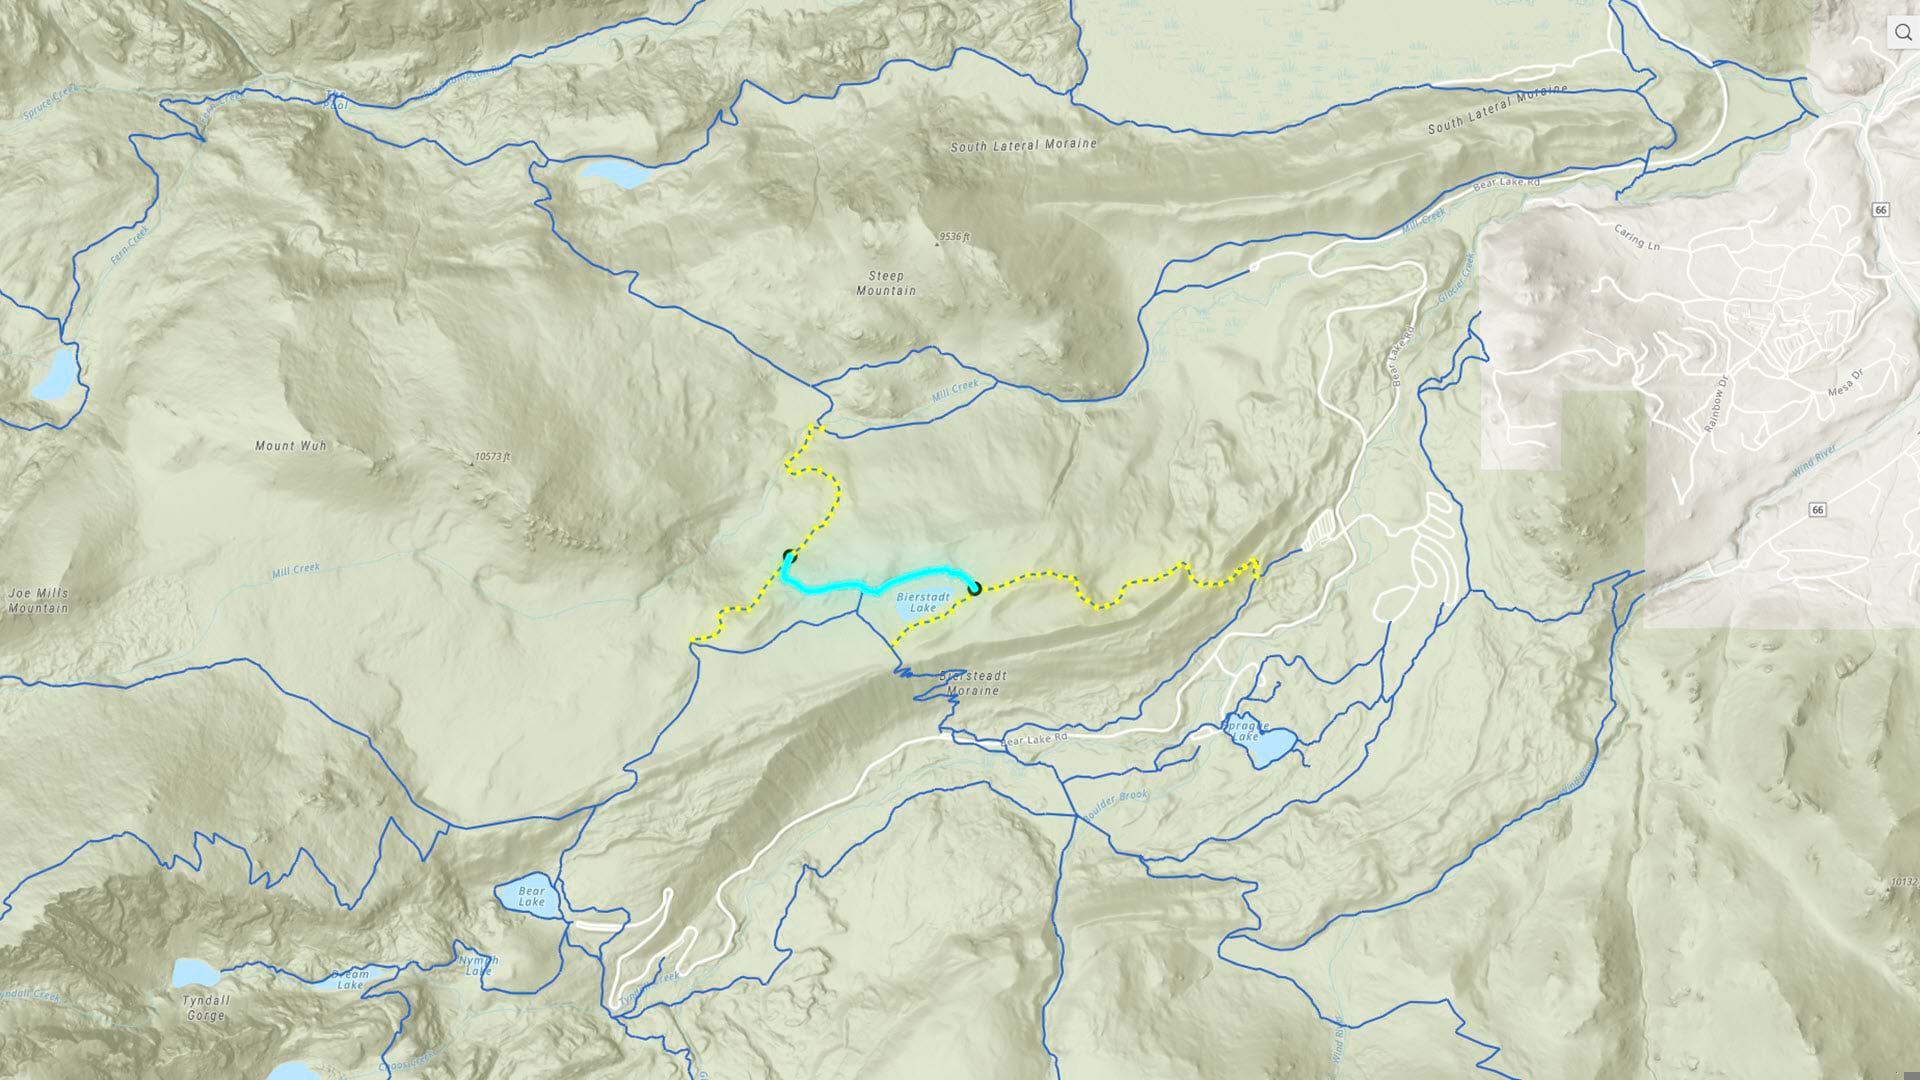
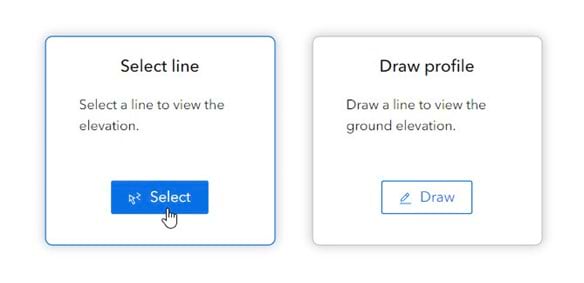
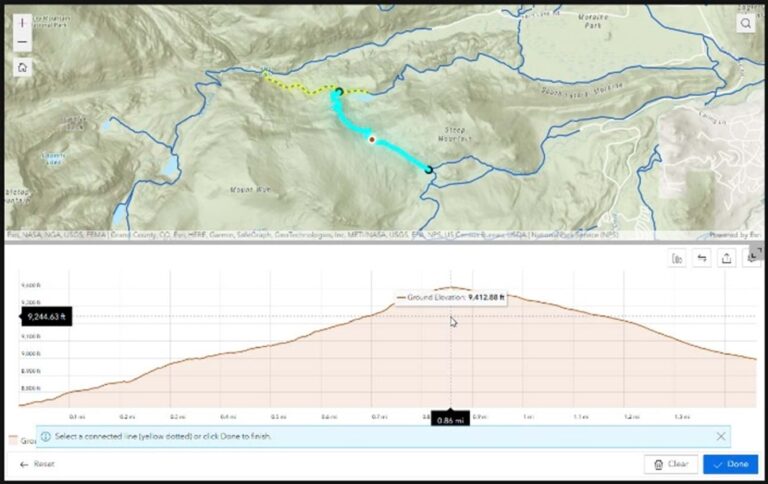
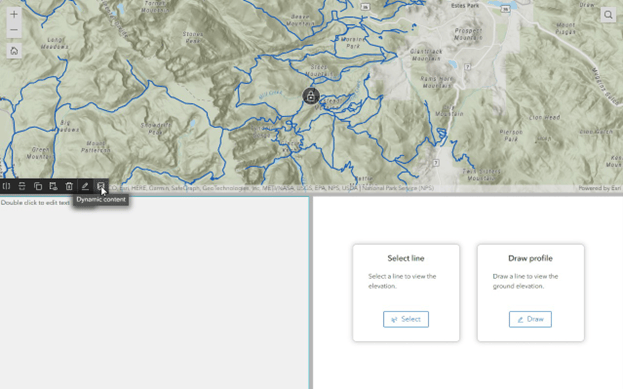
Step 8: Click Select line, then select any trail on the map to view its elevation profile.
Step 9: Turn off Live view. Click the Elevation Profile widget to open the Content panel on the right side. Under Map Settings, click Rocky Mountain National Park Service Trails again and enable Intersecting Layers.
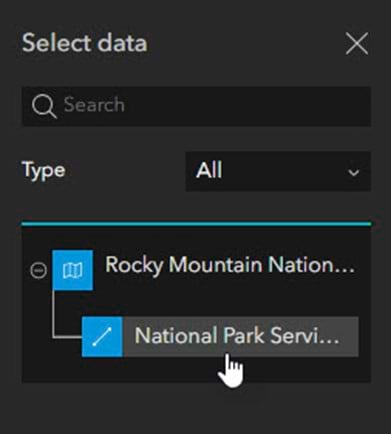
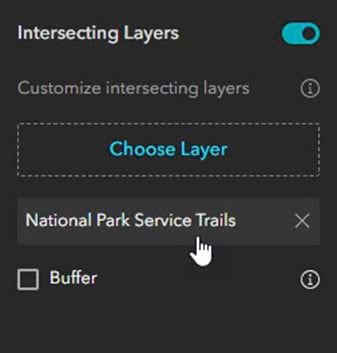
Step 10: Click Choose Layer, expand Rocky Mountain National Park Service Trails, and select the National Park Service Trails layer.
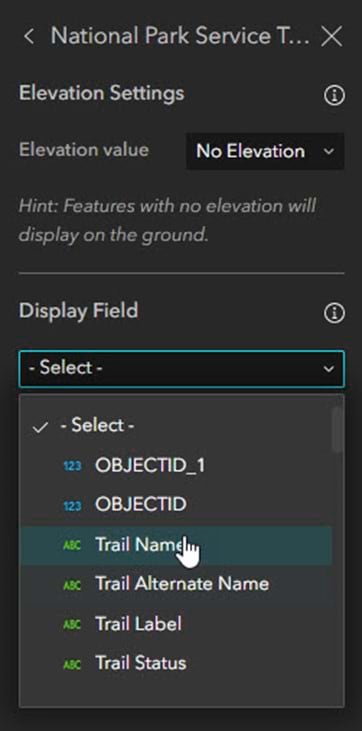
Step 11: Select the National Park Service Trails layer under Intersecting Layers to adjust the Elevation Profile settings.
Step 12: Under Display Field, select Trail Name from the drop-down menu for the intersecting features displayed in the elevation profile graph. Save your changes.
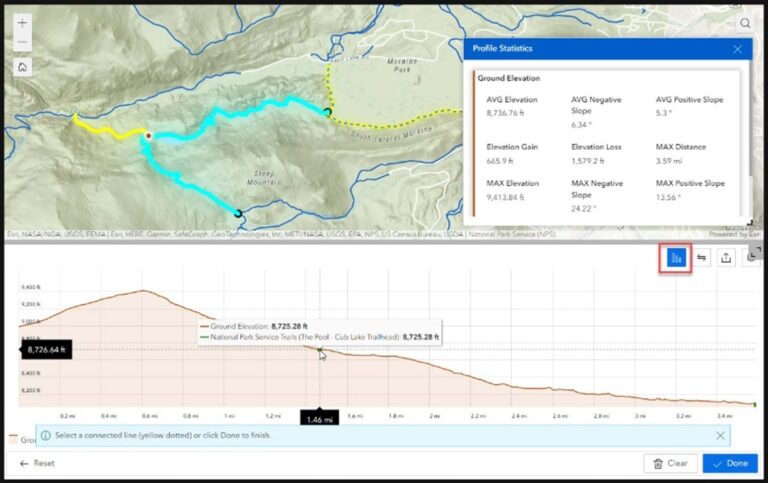
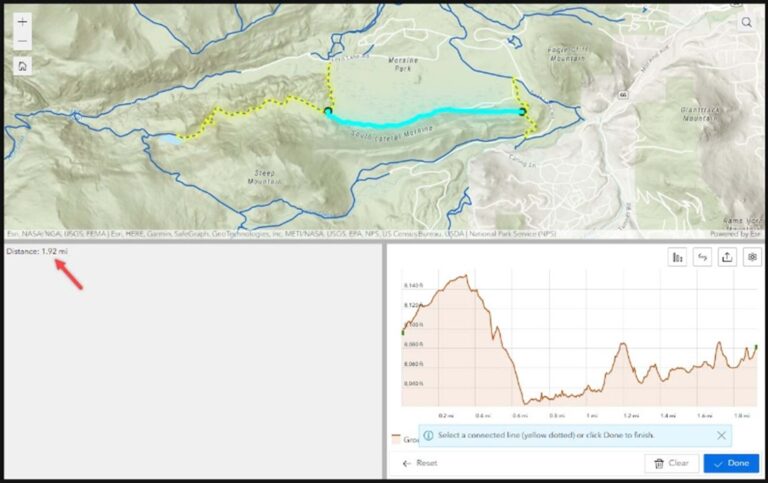
Now you can use the Live view mode to select a trail on the map and see connected and intersecting trails. Click the Profile Statistics button on the right side of the elevation profile window to view statistics for this trail.
Customize Your Trail Viewer
Now you will customize the display of information about the trails in your trail viewer using the Text widget and the List widget. These will allow you to more easily view the data associated with a specific trail.
Step 1: Make sure Live view is off, then click the plus sign on the left-hand toolbar to navigate to the Insert widget panel. Scroll down to the Page elements section and find the Text widget. Add it to the left of the Elevation Profile widget.
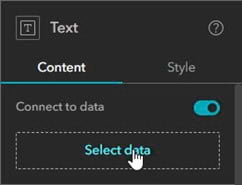
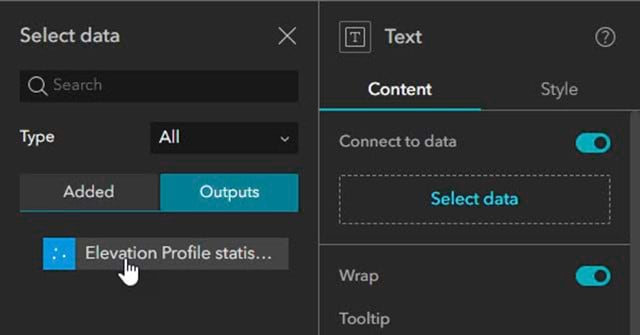
Step 2: In the Text widget Content panel on the right, toggle Connect to data, then click Select data.
Step 3: Click Outputs, then select Elevation Profile statistics output view to connect the widget to the data source.
Step 4: In the Text widget toolbar, type “Distance:”. Then select Dynamic content in the toolbar.
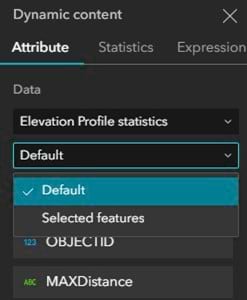
Step 5: Under Data, select Default from the second drop-down menu, then click MAXDistance to populate the Text widget. You can use the Live view mode to select a trail and view statistics in the Text widget.
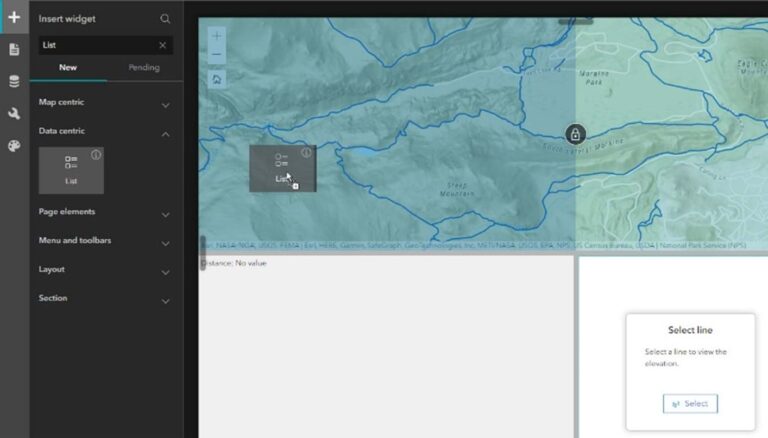
Step 6: Turn off Live view. Repeat Step 1 to return to the Insert widget panel. Find the List widget and add it to the left of the Map widget.
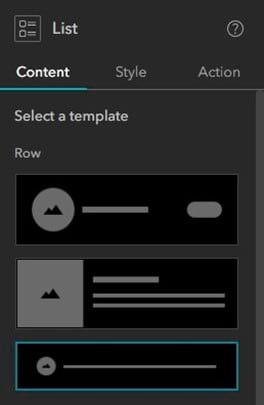
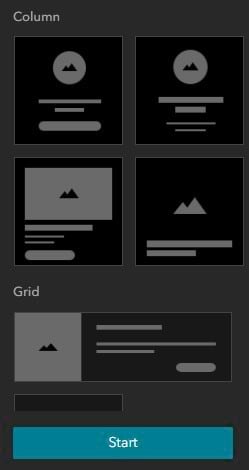
Step 7: Unlock the List widget and select Row template 3 from the List widget panel on the right. Click Start at the bottom of the panel.

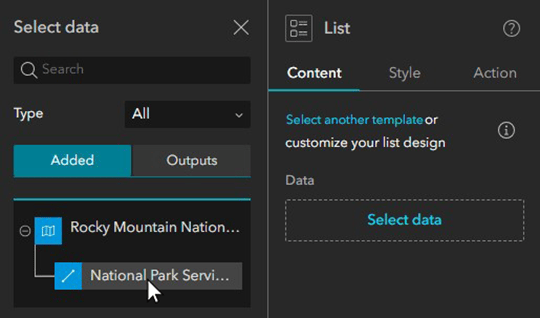
Step 8: Now you will connect the List widget to the trails layer from the map. In the List widget panel on the right, click Select data.
Step 9: Expand the Rocky Mountain National Park Service Trails layer and select the National Park Service Trails layer to connect the List widget to the data source.
Step 10: On the List widget, click the Text widget within the list item and select Dynamic content from the toolbar. Click Trail Name.

Click the List widget outside of the text box. The list is now populated with each trail in the layer.
Next, you will configure actions in the List widget to view the elevation profile when a trail is selected:
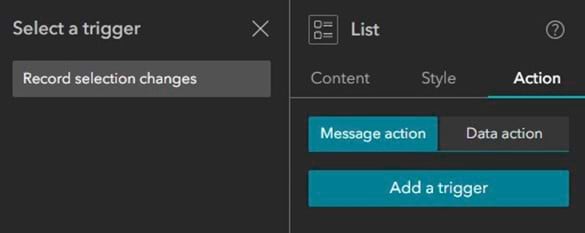
Step 11: In the List widget panel on the right, select Action. Under Message action, click Add a trigger and choose Record selection changes.
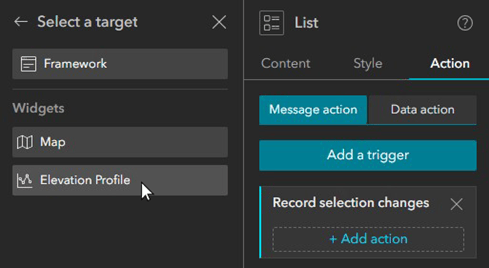
Step 12: Select the Elevation Profile widget as a target and set the action to Select line.
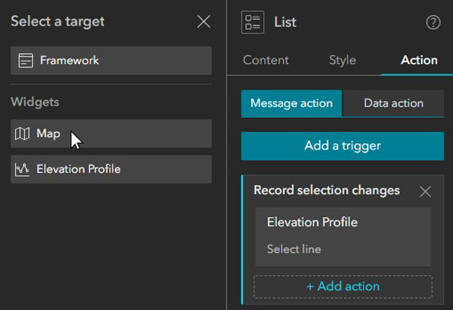
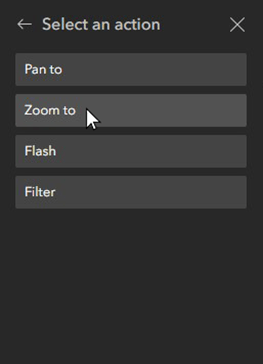
Step 13: Click + Add action and select the Map widget as the target. Set the action to Zoom to.
Step 14: Name your trail viewer application, then save your changes. Now, open the Preview using the arrow icon in the top toolbar and select a trail from the list to view its elevation profile.

Your trail viewer app can provide information about each trail before you set out on a hike. You can further customize and beautify your application before using it to plan your next outdoor adventure.