The Business Analyst widget in ArcGIS Experience Builder allows you to view information about a specific location’s population using ready-to-use interactive infographics in a web application created with ArcGIS Experience Builder. These infographics display information about demographics, market potential, and population trends, including Esri Tapestry Segmentation, which provides a detailed description of America’s neighborhoods based on socioeconomic and demographic composition.
In this tip, you will learn to create a web application in ArcGIS Experience Builder using a web map that displays the spatial distribution of Black/African American and White residential concentration in the United States. By pairing this with additional demographic data, local governments can use this web app to make plans to support equitable communities. Businesses can use the information from this web application to better understand the communities in which they operate and identify where and to whom they can contribute more equitable community outcomes.
Once you choose and configure a template, add data to the map, pair the map with an infographic, and set an action trigger to display the infographic interactively, your web app will be ready to use.
Choose and Configure a Template
Step 1: Sign in to your ArcGIS Online account and open Experience Builder. Click + Create new.

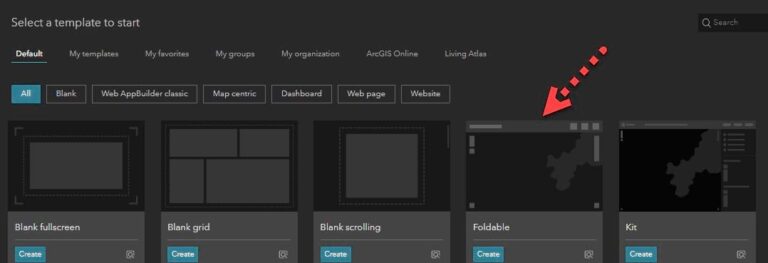
Step 2: Find the Foldable template and click Create.
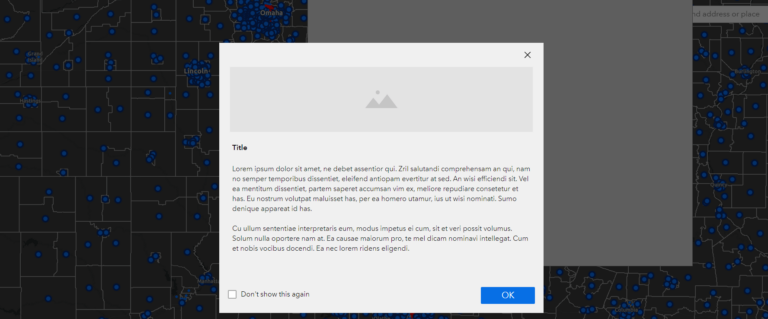
Step 2a: A blank title window displays. This is where you enter the purpose and function of the app. For this app, add the following text:
About this application
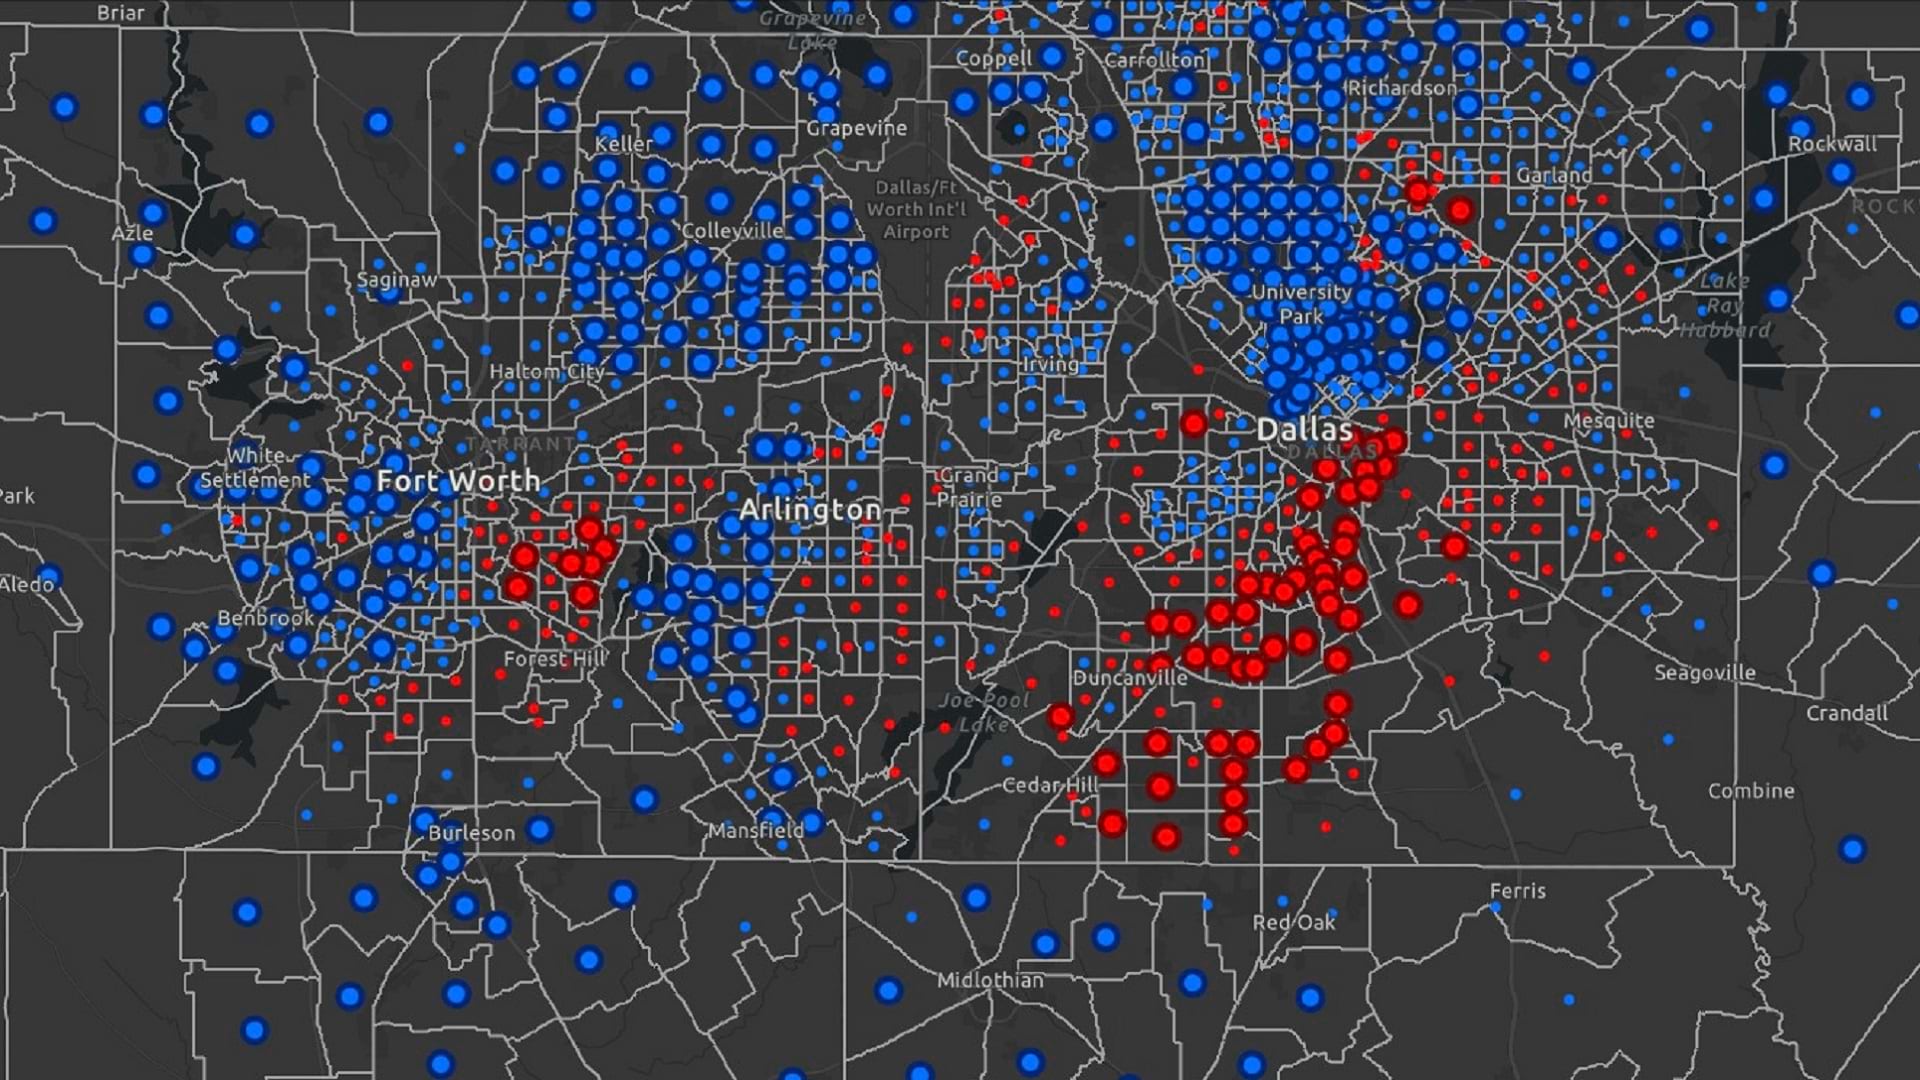
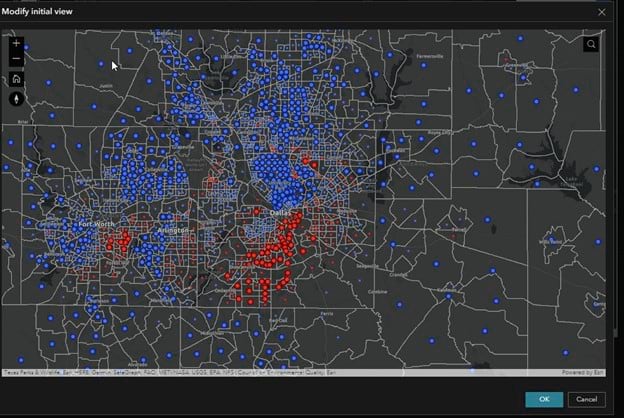
This Map widget contains a web map layer that displayed the spatial distribution of Black/African American and White residential concentrations using the Justic40 data. This layer presents the Index of Concentration (ICE) scores, with large red circles indicating high Black concentration and large blue circles indicating high White concentration.
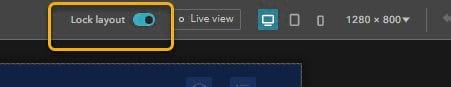
Step 3: Turn off the Lock layout toggle button to start editing the template.
Step 4: Click Page on the left-side panel, then click the map. Choose Select map on the right-side panel and click Add new data.
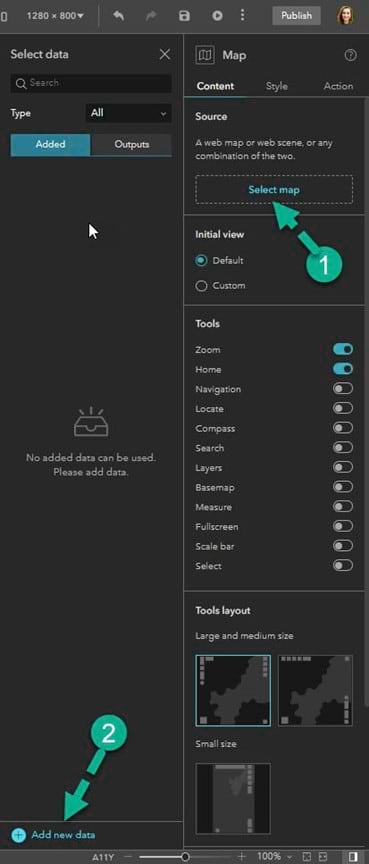
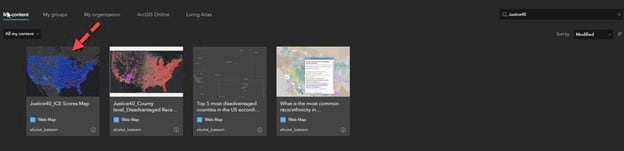
Step 5: Click the ArcGIS Online tab and search the keyword “Justice40” and select Justice40_ICE Scores Map from the search results. Click Done.
Step 6: Click Justice40_ICE Scores Map and the Map widget will populate with selected data.

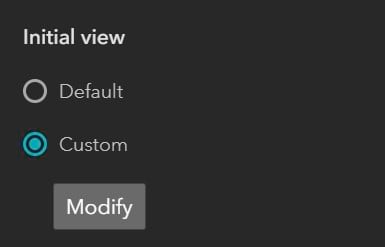
Step 7: Click Custom on the right panel, then click Modify and a new map window opens. Configure your map by zooming in to the location you want, then click OK.
Step 8: Now, give your application a name using the text box in the upper left corner of the map widget. Title it “Black or African American and White Residential Concentration Map.” Extend the text box if needed.

Pair the Map with an Infographic
Now you will add an infographic to your web app with the Business Analyst widget. This will allow you to view more information about specific locations by interacting with the web app interface.
Step 9: Click the plus sign in the top left corner to open the Insert widget panel. Drag the Business Analyst widget from the Insert widget panel onto the app. Click Preset mode on the right panel.
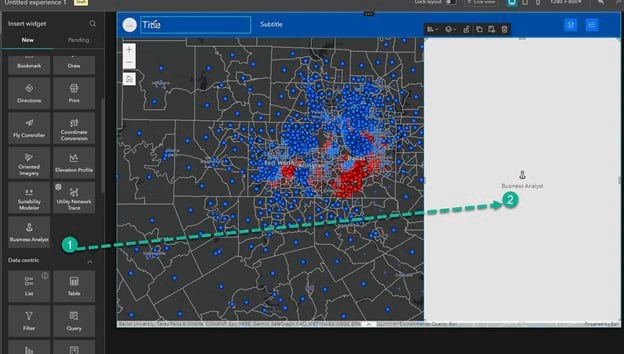

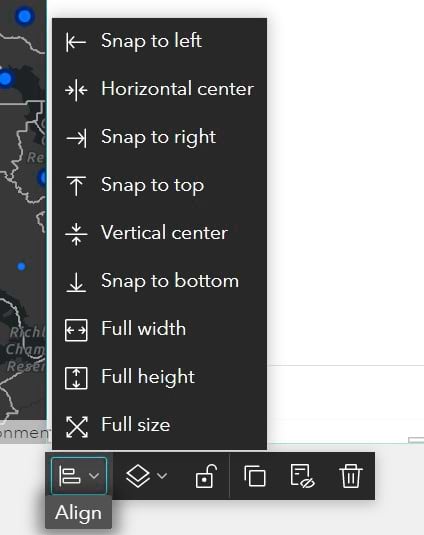
Step 10: Use the toolbar on the widget to resize or reposition the Business Analyst Widget. For this tip, click Snap to right, then Full height.
Step 11: Under Infographics, click Select an infographic. From the populated panel to the left select Demographic Profile.
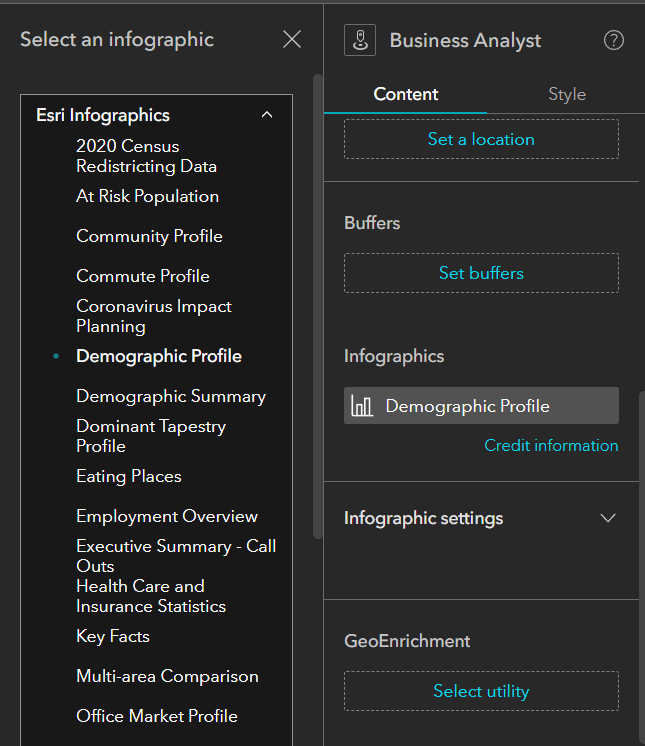
Step 12: Configure the infographic settings using the drop-down menus under Infographic settings. Select Stack view mode and turn off both the Run-on Map click and Display Header toggle buttons.

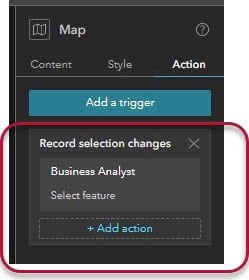
Step 13: Click the Map widget panel, then select the Action tab on the right panel.

Step 14: Click Add a trigger and then click Record selection changes.
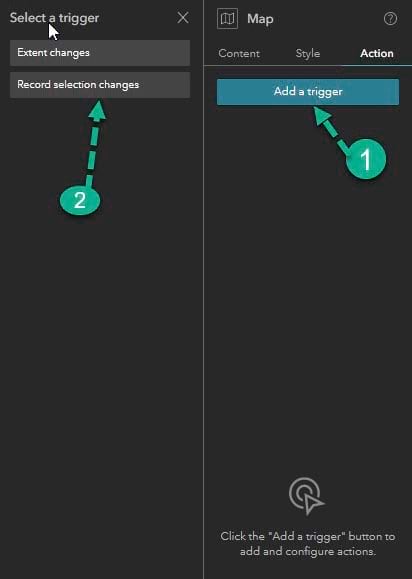
Step 15: Now click Business Analyst, then click Select feature. The widget is now paired with the Map widget and ready to interactively display the selection changes.
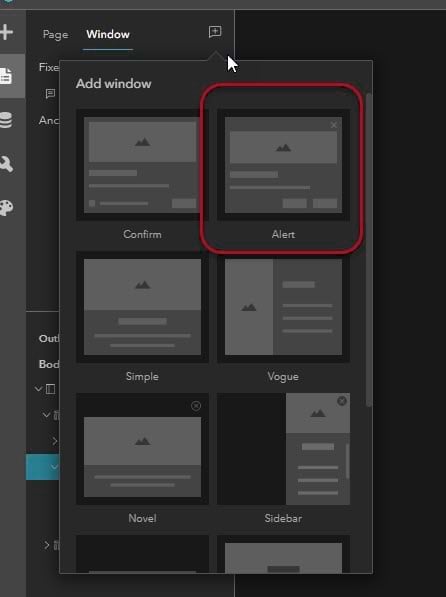
You can also configure the Alert widget to provide information and instructions about the application. To do this, click the Page icon on the left panel. Click the Window tab and then click the Add Window icon at the upper right side of the panel. In the add new window panel, click Alert.
A window will pop up with information about the selection and generate the infographic about its characteristics.
Step 16: Save the application and preview it before publishing.
When viewing the app, select a census tract on the map to view key demographic information from the map layer you added.
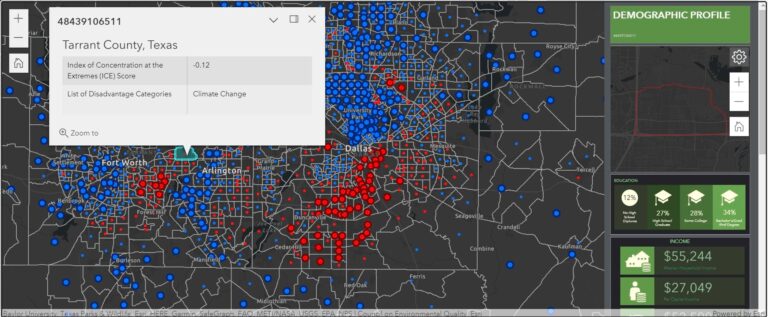
Now you can publish the web application. Once you have published this web app, viewers can click census tracts on the map to learn about the degree to which Justice40 categories of disadvantage prevail—or not—in areas of extreme residential concentration as well as key demographic information.
More Information
Find and Use Business Analyst Web Experience Templates
The Business Analyst Widget in Experience Builder Is Out of Beta with Great New Features
Design a Web Map to Analyze Residential Racial Segregation in the US