
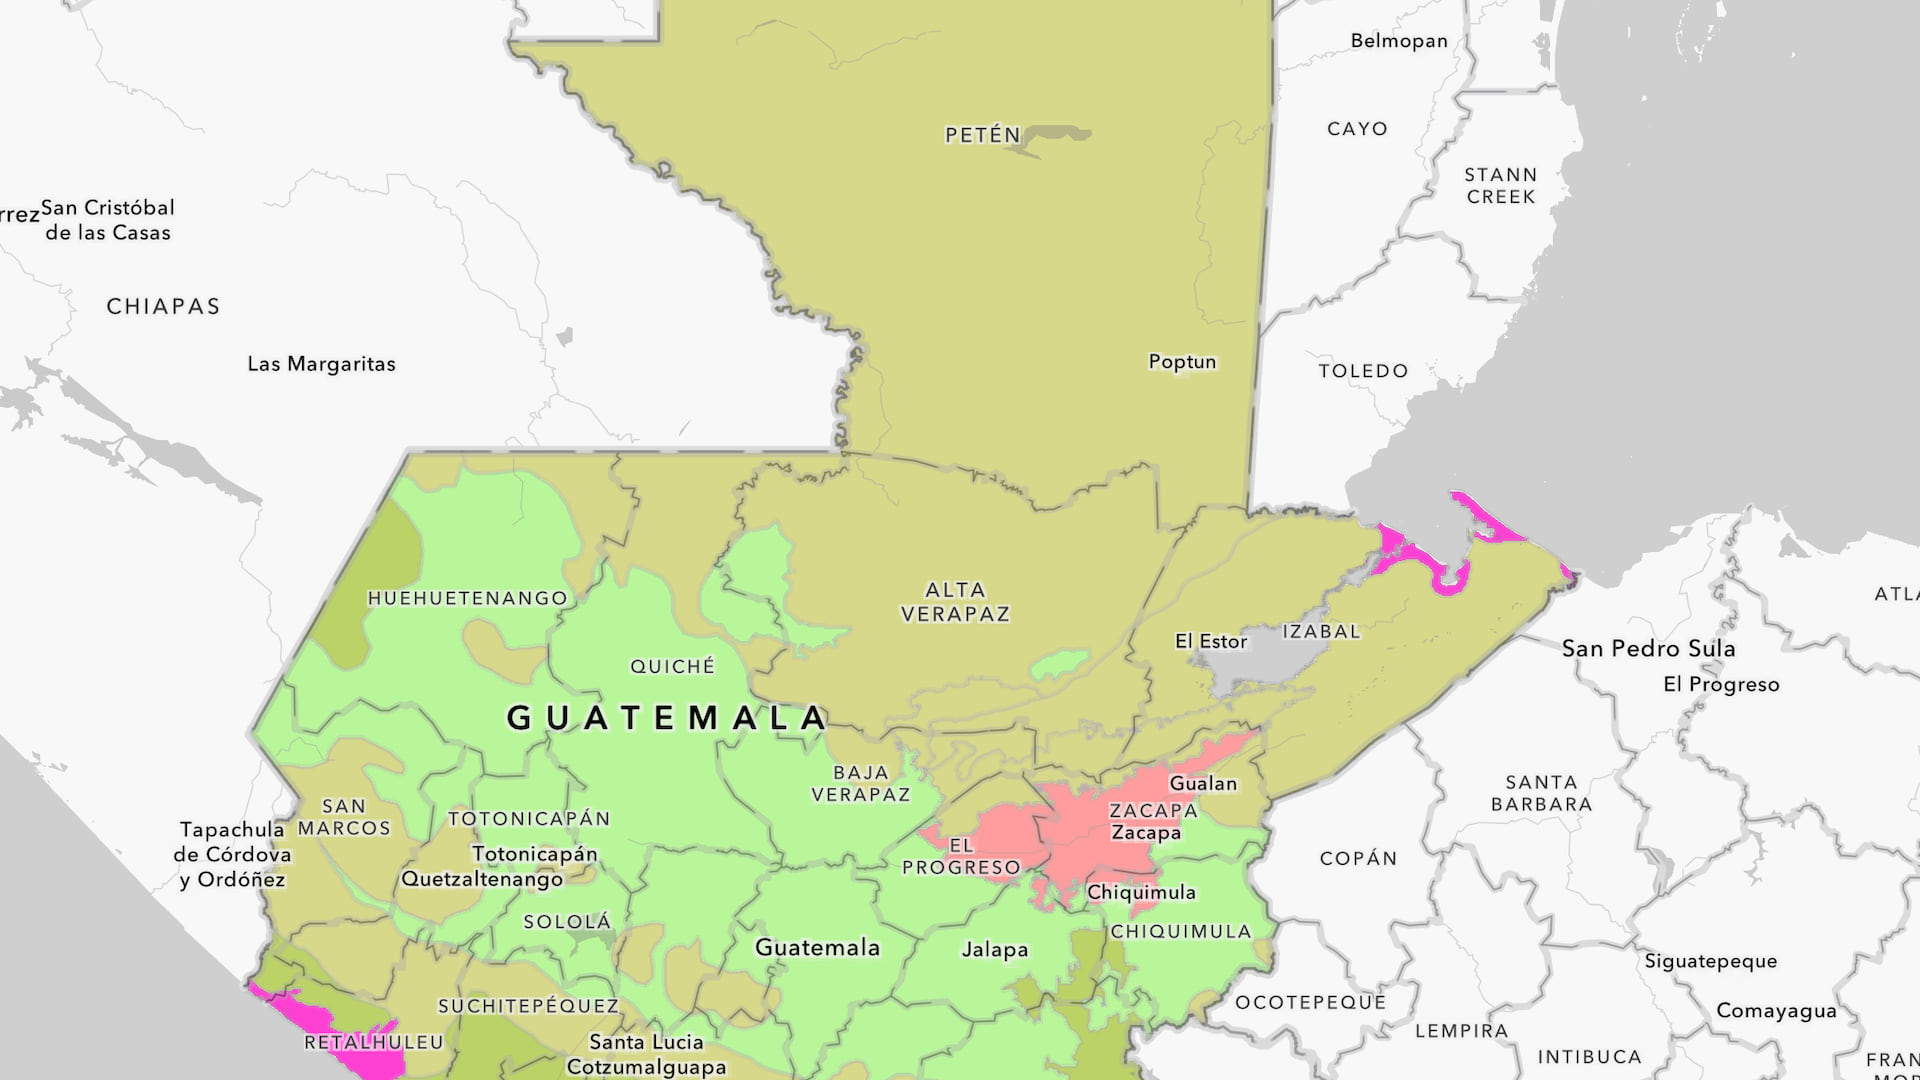
Say you’re a field scientist, and you need to see specific biodiversity and species distribution data, but you haven’t found a data layer that shows this for your location. Good news: There’s a global layer that contains the information you need.
In this tutorial, you will add a global layer and clip it to match the boundaries of a smaller layer. You will also learn how to style the clipped layer to match the style of the original layer.
Requirements
- ArcGIS organizational account with a Publisher, Facilitator, or Administrator role (see options for software access)
Save a Web Map and Perform Analysis
In this section, you will add the global ecoregions and biomes layer to a map of Guatemala and clip the ecoregions layer to the boundary of the smaller layer.
Add the Layers to the Map
First, you’ll open a map of Guatemala and add the global ecoregions and biomes layer to it.
1. Open this map of Guatemala. (You may need to sign in to your ArcGIS organizational account.)
2. If necessary, close the Properties pane.
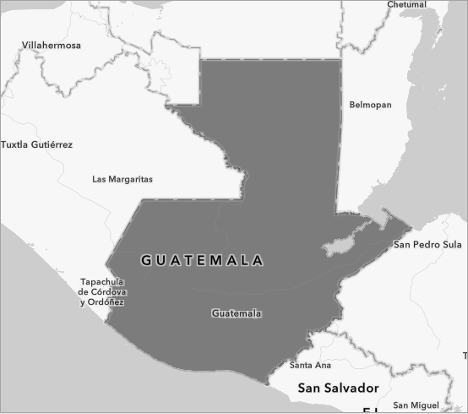
The map shows Guatemala and a basemap.
Next, you will save the map to your ArcGIS Online account.
3. On the Contents (dark) toolbar, at the bottom, click the Expand button.
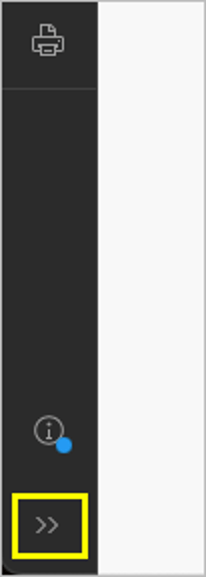
Now the names of the options on the toolbar display alongside an icon.
4. On the Contents toolbar, click Save and open and choose Save as.
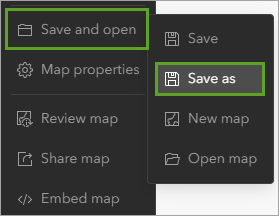
The Save map window appears.
5. In the Save map window, for Title, type “Guatemala ecoregions”, followed by your name or initials, and click Save.
You have saved the web map to your ArcGIS Online account. Next, you will add a layer from ArcGIS Living Atlas of the World.
6. On the Contents toolbar, click the Layers button.
7. In the Layers pane, click Add.
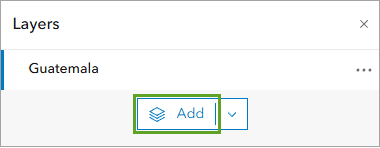
The Add layer pane appears.
8. From the My content drop-down menu, choose Living Atlas.
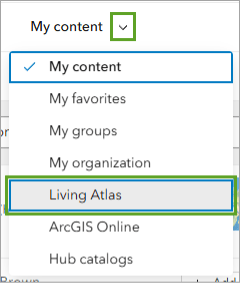
9. In the search box, type “resolve ecoregions”.
A result that matches your search is returned.
10. For the RESOLVE Ecoregions and Biomes feature layer, click the Add button to add the layer to the map.
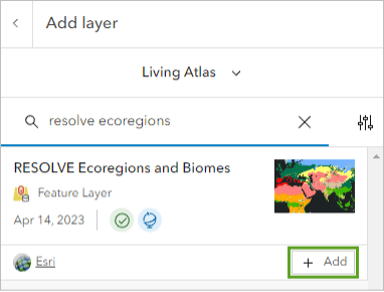
The layer appears on the map.
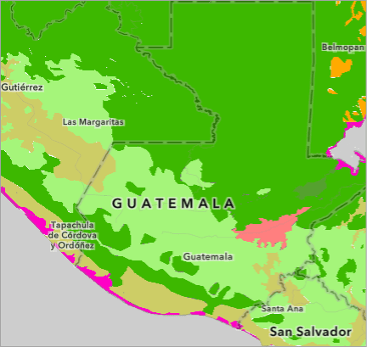
The layer you added is displaying on top of the Guatemala border layer. You will change the order of the layers so that you can see both layers.
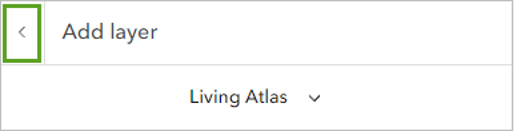
11. In the Add layer pane, click the back arrow to view the Layers list.
12. In the Layers pane, click the six dots on the left-hand side of the Guatemala layer and drag it above the RESOLVE Ecoregions and Biomes layer.
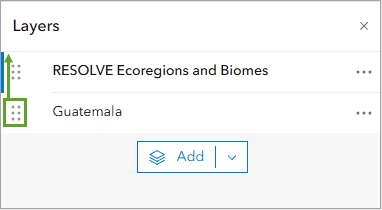
The boundary of Guatemala draws on top of the ecoregions on the map.
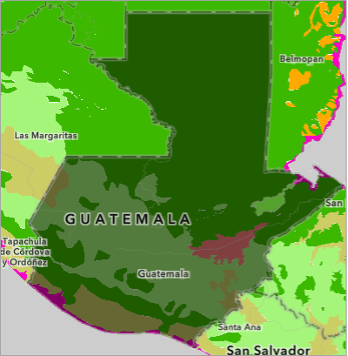
You have saved the web map and added a layer from ArcGIS Living Atlas. Now you are ready to begin the analysis.
Extract Ecoregions that Intersect with Guatemala
You have a global ecoregions and biomes layer, and because your study area is Guatemala, there is no need for the data outside of this area. One use of analysis tools is to narrow down the amount of data you are working with, reducing map clutter and credit consumption.
You will use analysis tools to extract the global ecoregions and biomes that intersect with the Guatemala country boundary to create an ecoregions and biomes layer only for Guatemala.
1. On the Settings (light) toolbar, click Analysis.
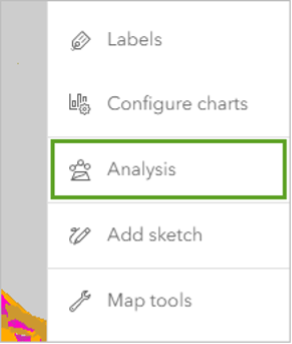
The Analysis pane appears.
2. Click the Tools button.
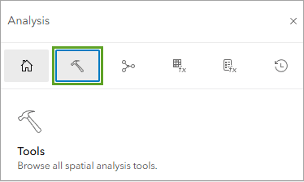
A list of analysis tool categories appears.
3. Click Manage data to expand it, then click Overlay Layers.
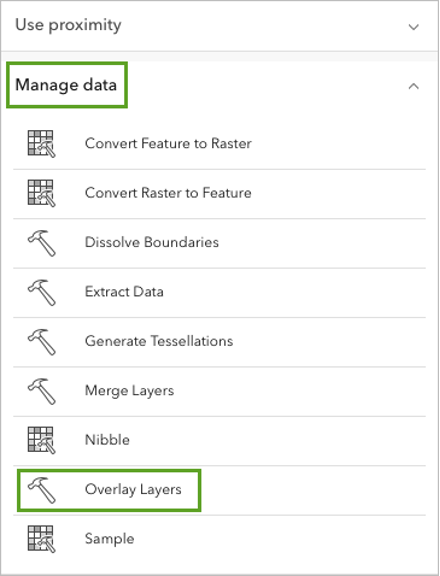
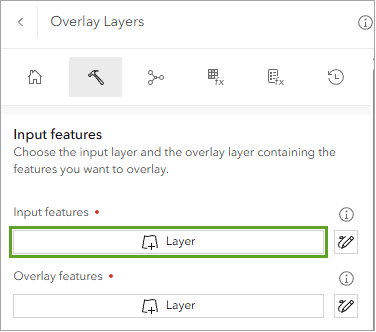
The Overlay Layers tool appears. You will use this tool to extract the global ecoregions layer to Guatemala’s border.
4. In the Input features section, click Layer.
The Select layer window appears showing a list of layers in the map.
5. In the Select layer window, click the RESOLVE Ecoregions and Biomes layer.
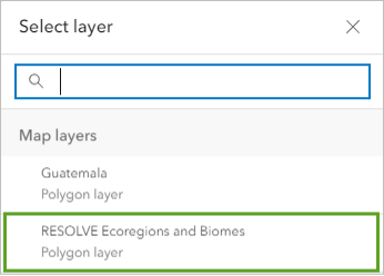
The Input features parameter is updated with the layer you chose.
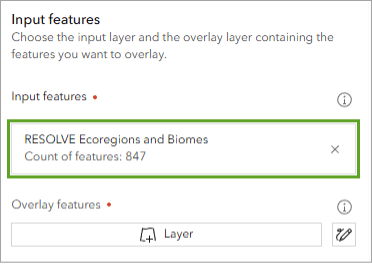
Next, you will set the Overlay features parameter, which specifies the boundary used to clip the input features.
6. For Overlay features, click Layer. In the Select layer window, choose Guatemala.
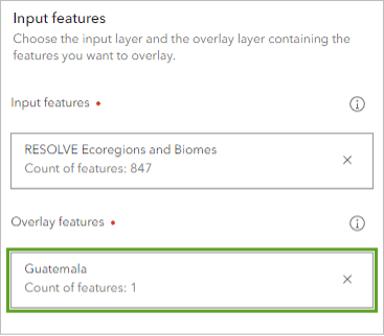
In the Overlay settings section, the Overlay type default is Intersect, which clips the selected layer to the specified boundary. The other options are Union, which merges the two layers, and Erase, which removes the portions of each layer that overlap. For this example, Intersect is the correct setting.
The Output geometry default setting is Polygon, which determines how the intersections should be represented in the output. The other options are Point and Line. For this tutorial, Polygon is the correct setting since you want the output to be the polygon of the country of Guatemala.
7. In the Result layer section, type “Guatemalan ecoregions” for Output name, followed by your name or initials.
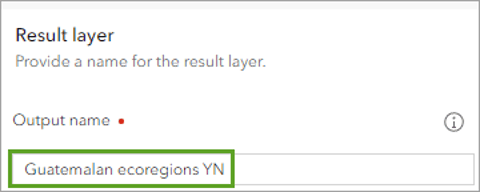
8. Click Estimate credits to calculate the estimated number of credits consumed.
Credits are the cost of using Esri servers to process the data. For the current analysis, this number is roughly 0.848. If needed, you can reduce the number of credits you consume by changing the processing extent so that it includes fewer features with the following steps.
9. Expand the Environment settings section.
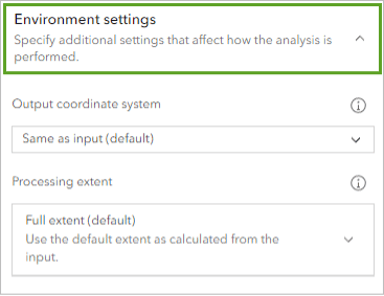
Currently, the Processing extent is set to Full extent, which means the map is zoomed out and shows features beyond the border of Guatemala. You will adjust the extent of the map to reduce the credits.
10. In the Layers pane, for the Guatemala layer, click the Options button and choose Zoom to layer.
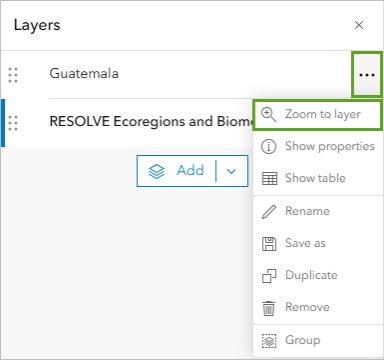
The map extent now bounds Guatemala.
11. In the Environment settings section, change Processing extent to Display extent.
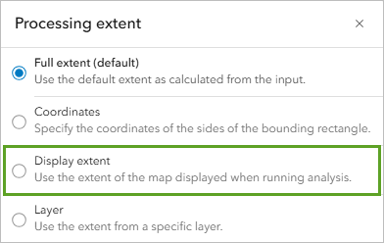
This changes the credits charged from the default full extent (the global layer) to the current display extent.
12. For Estimated credits, click the circular arrows button next to the existing number to refresh and recalculate the estimated consumed credits.
The updated estimation is now approximately 0.015 (a 98 percent decrease).
13. Click Run.
When processing is complete, the output layer is added to the Layers list and saved as an item in your ArcGIS Online account.
14. In the Layers pane, point to the Guatemala layer and click the Visibility button (eye icon) to turn the layer off. Do the same for the RESOLVE Ecoregions and Biomes layer.
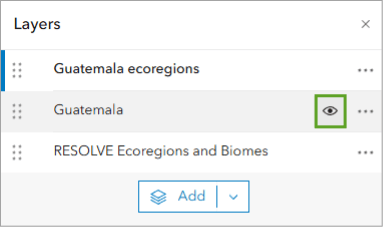
The output layer that contains ecoregions and biomes in Guatemala displays more clearly.
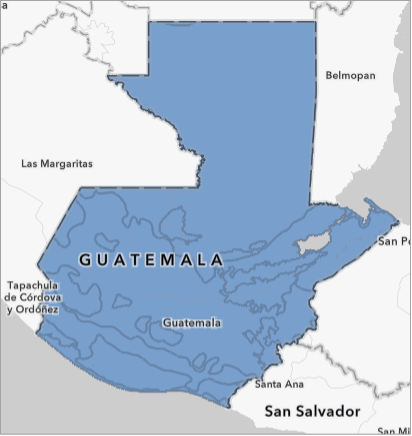
The layer is symbolized using default symbology, so you cannot differentiate the ecoregions and biomes. You will modify the symbology to better display the layer in the next section.
15. On the Contents toolbar, click Save and open and choose Save.
You have opened and saved a copy of an existing web map to your ArcGIS Online account, added a global layer from ArcGIS Living Atlas, and clipped it to the extent of Guatemala to create a new layer that narrows the focus of your ecoregions and biomes map.
Symbolize an Analysis Layer to Match the Source Layer
Previously, you created a biodiversity layer for Guatemala. Next, you will style the layer to look like the global ecoregions and biomes layer.
Style the Layer
Performing an intersect on the global ecoregions and biomes layer removes the symbology used on the input layer. To make the Guatemalan layer match the original global layer, you will update the Guatemalan ecoregions layer using the same style.
To see how the original global layer was styled, you can select it in the Layers pane, open the Styles window, and review the color hex code value for each symbol.
1. On the Contents (dark) toolbar, click Layers, then click Guatemala ecoregions.
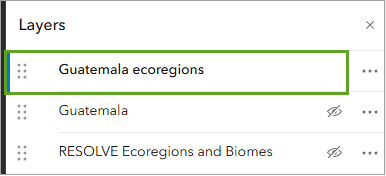
A blue line appears next to the ecoregions layer to indicate that it is selected. Now, whatever you do on the Settings toolbar will be applied to the selected layer.
2. On the Settings toolbar, click Styles.
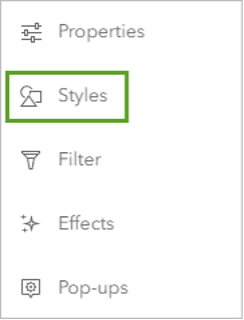
The Styles pane appears.
3. In the Styles pane, under the Choose attributes section, click the Field button.
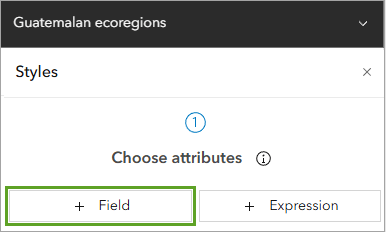
The Select fields window appears.
4. In the fields list, click Biome name and click Add.
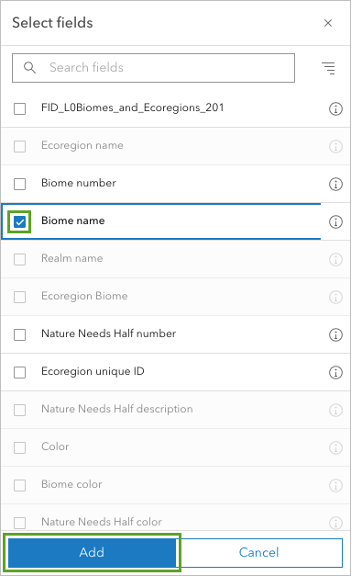
The Select fields pane closes and the map style updates.
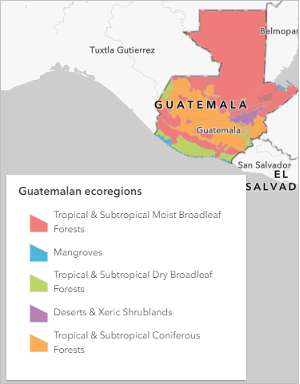
The map style is automatically set to Types (unique symbols). You will keep this style but modify the colors.
5. For Pick a style, under Types (unique symbols), click Style options.
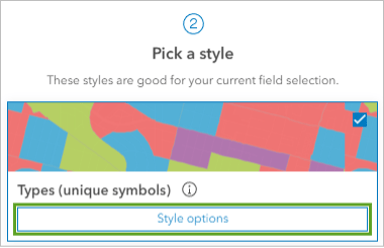
The Types (Unique symbols) pane appears with all the unique names from the Biome name field listed.
6. In the Biome name section, click the symbol for Tropical & Subtropical Moist Broadleaf Forests.
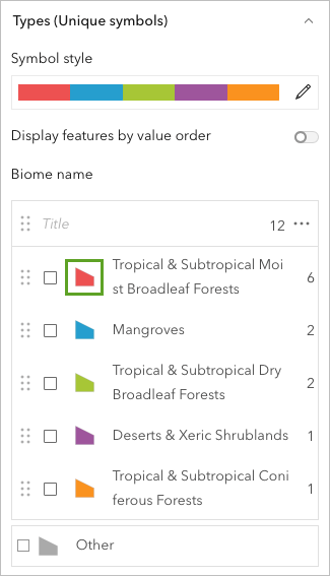
The Symbol style window appears.
7. In the Symbol style window, click the current fill color.
The Select color window appears.
8. Change the hex code value to 3db800 and press Enter.
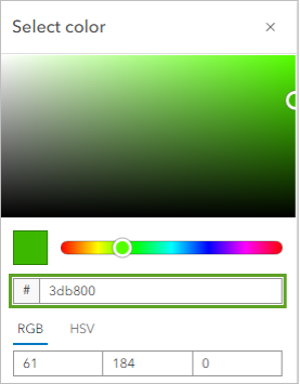
The color updates in the Symbol style window and on the map.
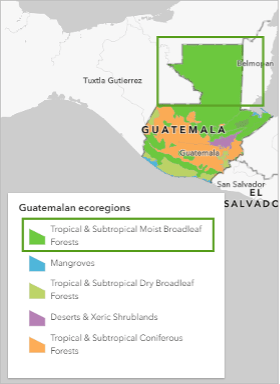
9. Click Done to close the Select color pane. Close the Symbol style window by clicking the X.
10. Perform the following steps to change the rest of the symbols for each biome type:
- Click the shape button next to Mangroves.
- Click Fill color, change the hex code value to ff00c5, and click Done. Close this window.
- Click the shape button for Tropical & Subtropical Dry Broadleaf Forests.
- Click Fill color, change the hex code value to cdcd66, and click Done. Close the window.
- Click the shape button for Deserts & Xeric Shrublands.
- Click Fill color, change the hex code value to ff7f7f, and click Done. Close the window.
- Click the shape button for Tropical & Subtropical Coniferous Forests.
- Click Fill color, change the hex code value to a5f57a, and click Done. Close the window.
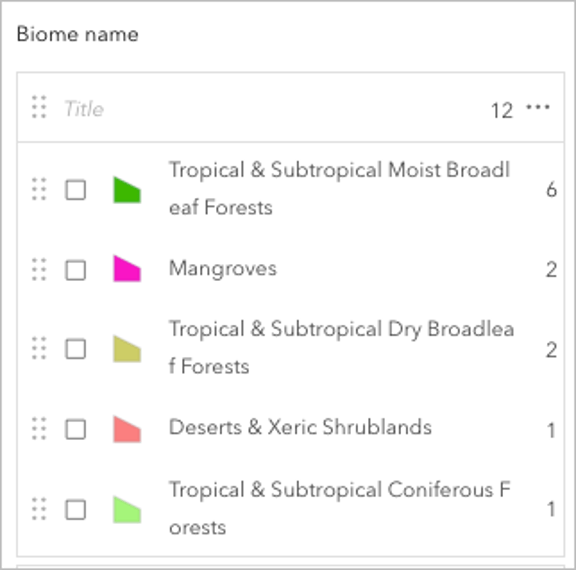
11. In the Styles pane, click Done two times.
The Guatemalan ecoregions symbology now matches the symbology from the global ecoregions and biomes layer.
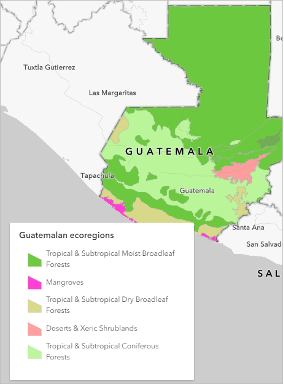
12. Save the map using the Save button on the dark toolbar.
Now the clipped ecoregions and biomes layer is symbolized in the same way as the source layer from ArcGIS Living Atlas.
In this tutorial, you accessed a web map and saved it to ArcGIS Online, added a global ecoregions and biomes layer from ArcGIS Living Atlas, used an overlay tool to clip the global layer to the Guatemala country boundary, and symbolized the resultant layer to match the initial source layer.
Acknowledgements
- RESOLVE Ecoregions and Biomes layer provided by Esri, based on the BioScience article “An Ecoregions-Based Approach to Protecting Half the Terrestrial Realm”
- Human Geography Map sources: Esri, TomTom, Garmin, FAO, NOAA, USGS, OpenStreetMap contributors, and the GIS user community
- Guatemala Country Boundary provided by Esri, Michael Bauer Research GmbH, and Instituto Nacional de Estadística
Visit the Esri tutorial gallery to explore additional topics and find other step-by-step workflows on a variety of products.