
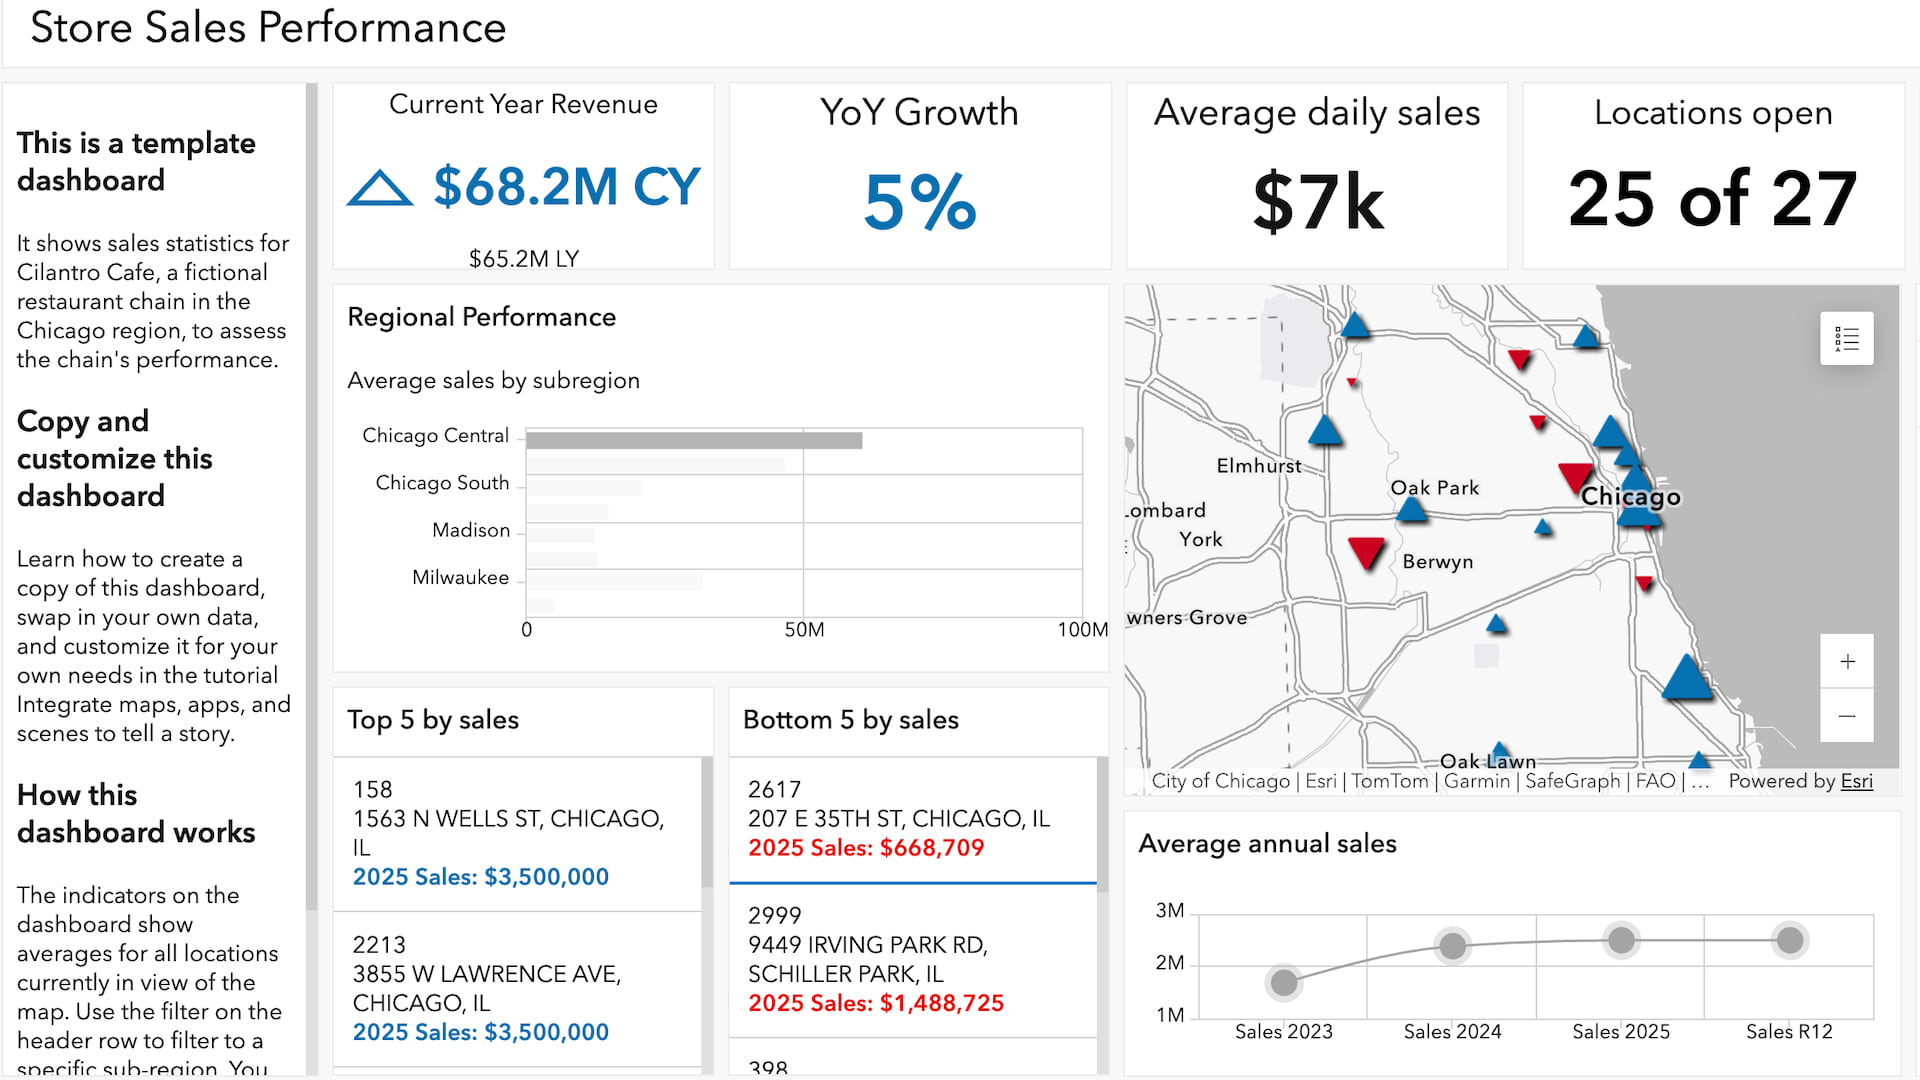
The company you work for, Box Store Inc., is coming up on its annual planning period. You and your colleagues in the sales department have been tasked with creating recommendations for strengthening sales in underperforming branches. You’ve decided to use ArcGIS Dashboards to create a dashboard to help your colleagues examine the data that has been collected for each location. ArcGIS Dashboards is designed to display multiple visualizations that work together on a single screen, which will allow your team to explore both regional trends and individual location statistics.
To save time, you’ll use a template that has been created for sharing sales data. Maps and the layers in them contain the attribute data that drives interactive apps such as ArcGIS Dashboards. When you use templates to create dashboards, you can swap out the data source by choosing a new map.
This tutorial is part of the series Integrate maps, apps, and scenes to tell a story. The first tutorial in this series, Create a chart, was featured in the September 2026 ArcWatch.
Requirements
- ArcGIS organizational account with a Publisher, Facilitator, or Administrator role (See options for software access.)
Explore a Dashboard
You’ve found an existing dashboard that seems like it could fit your needs. You’ll briefly review its configuration to make sure it’s appropriate for your data and audience. This dashboard will be shown in a sales team meeting to review regional trends and look at details about specific stores to see what may—or may not—be contributing to their growth.
For this exercise, you’ll want a dashboard that has charts and indicators breaking down different markers of performance.
1. Open the Store Sales Performance dashboard template.
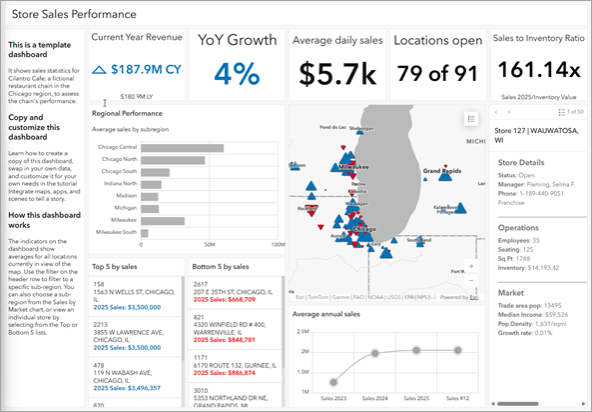
Dashboards are composed of configurable elements. This dashboard, which shows sales data for a fictitious restaurant chain, has several elements: five indicators, two charts, two lists, a details pane, and a map. It’s configured to give you at-a-glance information about the chain’s sales performance.
2. On the map, click the Legend button in the upper right-hand corner to expand the legend.
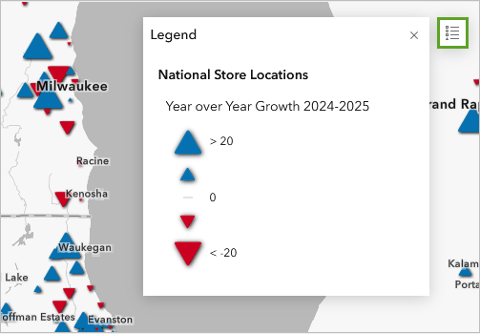
The layer is styled to show year-over-year growth. The size of the symbol corresponds to the store’s sales in 2025 versus 2024.
3. Close the legend using the X button.
4. On the Regional Performance bar chart, click Chicago Central.
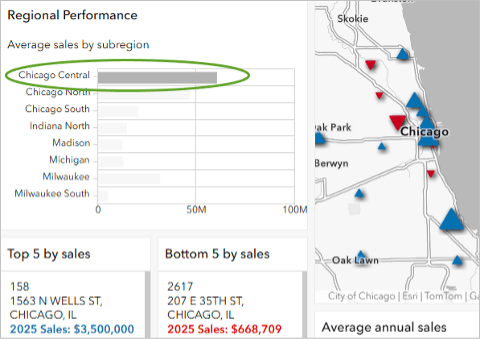
The map and elements update to show data for this region, which means actions have been configured for the dashboard. Actions tie elements together to make the dashboard interactive.
For example, by selecting the Chicago Central region on the chart, the indicators update to show that the region has 47 open locations that are making an average of $6,200 in sales each day.
5. In the Bottom 5 by sales list underneath the bar chart, click the first list item, 2617.
The map zooms in to the selected restaurant. As you zoom in, the elements update. Because this is now the only restaurant shown on the map, the indicators present information about this location. The restaurant earned $668,709 in 2025, which is significantly lower than the chain’s average sales of $2.16 million per year. However, you can tell based on the chart showing average annual sales that this location opened in 2024.
6. In the Bottom 5 by sales list, click 2617 again.
The individual store is unselected, and the map resets to show the Chicago Central region.
Copy a Dashboard
Now that you’re familiar with how the dashboard works, you can decide whether it’s one you want to copy. The dashboard has a lot of the metrics that you want to show for your Box Stores layer, so you’ll create a copy and change the dashboard to show your data instead.
1. Open the Box Store Locations map.
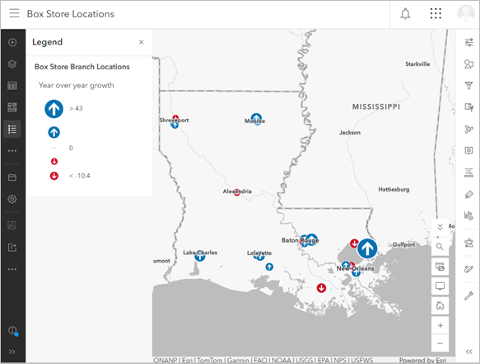
Note: If you completed the first tutorial in this series, Create a chart, you can instead open the copy of the map you created.
2. On the ribbon, click Sign In in the upper right-hand corner. Sign in to your ArcGIS organizational account.
3. On the Contents (dark) toolbar, click Save and open and choose Save as.
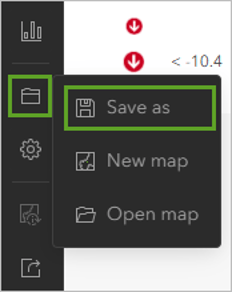
4. In the Save map window, provide the following information:
- For Title, type “Box Stores Performance”.
- For Tags, type “Retail, Box Store, Sales, Tutorial”. Make sure the box is checked next to each tag.
- For Summary, type “This map shows sales data for the fictional Box Store locations in Louisiana.”
5. Click Save.
6. On the Contents (dark) toolbar, click Create app and choose Dashboards. This may be located under the More option.
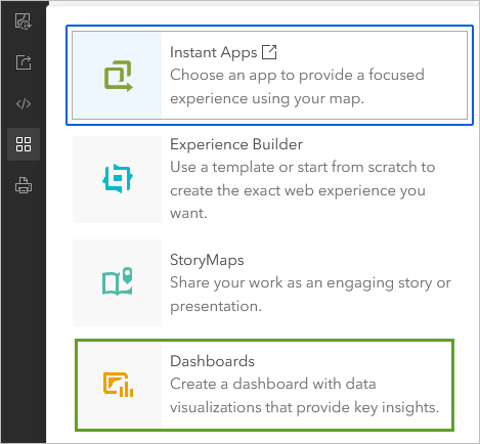
The Create new dashboard window opens. Here, you can choose to either build your own dashboard from scratch or use a publicly available dashboard as a template. For this exercise, you’ll use the second option.
7. Copy the following item ID: 1269d41309994ad88e2a2218b6bb0fcb
This item ID identifies the demo dashboard you just viewed, which contains charts showing data for sales over time, top performing store locations, and more.
8. In the URL of the Create new dashboard page, delete the item ID following the text #id=, then paste the item ID you copied from above and press Enter.
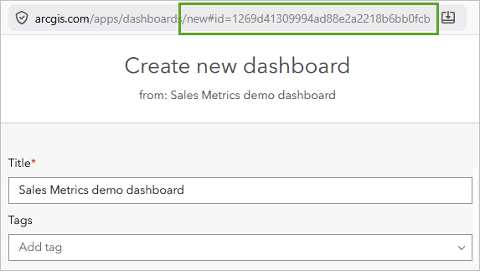
The page reloads. The title now reads Sales Metrics demo dashboard. When you create this dashboard, you’ll be creating a copy of this template.
9. For Title, type “Box Store Louisiana Sales Performance”.
10. For Summary, type “This dashboard shows metrics for Box Store’s Louisiana locations”.
11. Click Create dashboard.
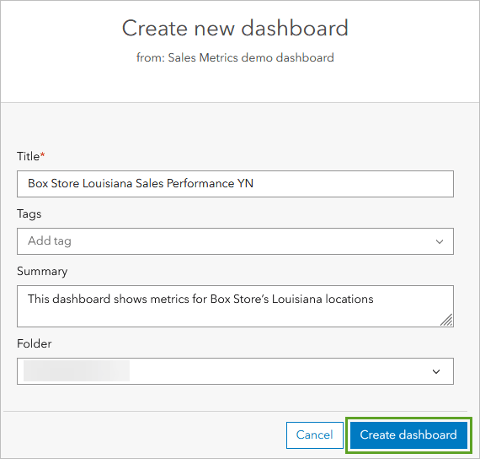
The dashboard opens. Since it’s a copy of the one you looked at earlier, it’s configured with the same elements, actions, and data sources.
Update the Data Source
Now that you own a copy of the sales dashboard, you can begin to customize it for your purposes. You’ll start by changing the data source to the map you saved earlier. This same strategy can be used to customize dashboard templates with your company’s data.
1. On the dark toolbar, click the Data sources tab.
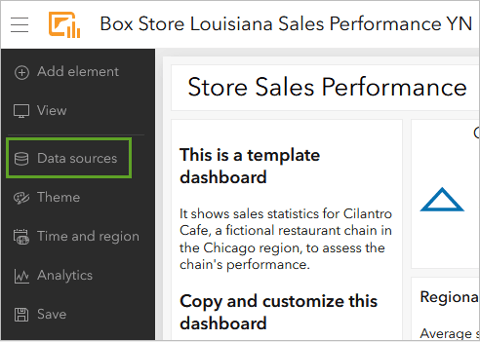
2. In the Data sources pane, under Maps and next to National Location Sales, click Configure data source using the gear icon.
The Configure data source window opens. The window is divided into two columns. The first column lists the map, layers, and attribute fields used in the current dashboard. In the second column, you can choose replacements for these sources.
3. In the first row, for the map element, click Change.
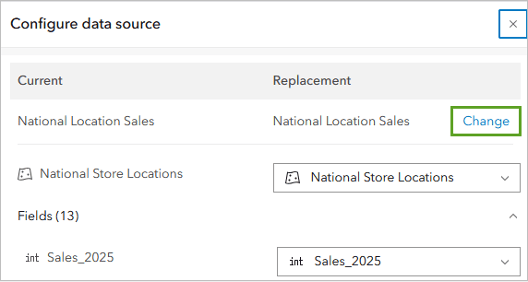
4. In the Select a map window that opens, choose your Box Stores Performance map.
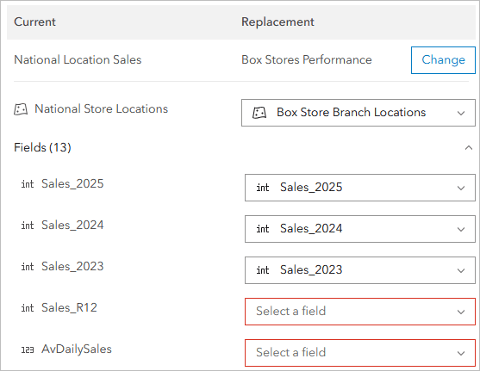
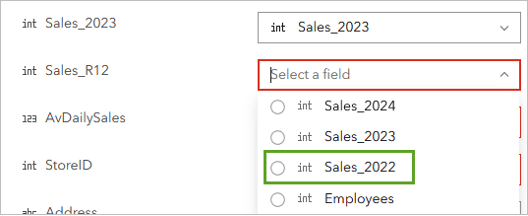
The Fields section updates with similar fields drawn from the new dataset. For example, both datasets have sales data for the years 2023–2025, so these are automatically set to update. But the Box Stores dataset doesn’t contain a Sales_R12 field, so its replacement field is marked in red for further review.
5. In the Fields section, for the Sales_R12 field, click the empty box on the right in the Replacement column.
A list of the attributes available in the Box Store Locations layer appears. Scrolling through the list, you can tell there’s no R12 field in the layer, so you have two choices: You can delete the element that requires that field, or you can choose a similar field and update the dashboard later.
In this case, the Box Stores dataset has an additional year of sales data from 2022 that you’ll use instead.
6. For the Sales_R12 field, click the Select a field drop-down menu and select Sales_2022.
7. Select the following replacements, noting where there’s no direct replacement:
- StoreID—Select Store_Name.
- InventoryValue—Select Inventory_Value.
- SUB_REGION—Select CBSA_Name.
Not all the fields have a direct replacement. For example, the Box Stores dataset doesn’t have an average daily sales (AvDailySales) field. In these cases, you can choose a different metric that you want to show on the dashboard. Later, you can update the element on the dashboard to reflect the new field or delete it.
8. Select the following replacements:
- AvDailySales—Select Square_Footage.
- Ops_Status—Select Store_Key.
9. Click Done.
The dashboard now shows the map and data for the Box Stores dataset.
10. On the toolbar, click Save and choose the Save option.
Configure the Dashboard
The dashboard has been updated to show the Box Store data. Where there were direct replacements for fields, the elements have been updated. But, as you have already noted, some fields didn’t have direct replacements. They now need either to be updated to reflect the attributes you substituted them with or to be removed completely from the dashboard.
1. Point to the menu for the indicator element under Locations Open that reads 0 of 0 Locations open, then click the three dots and choose Configure.
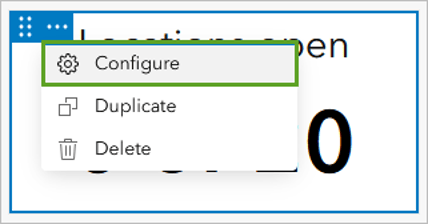
This element previously showed the Ops_Status field, which reported how many stores within the map view were currently open. When you reconfigured the fields, you chose the Store_Key element as a placeholder. Since there is no direct replacement, you’ll delete the element.
2. Close the Indicator configuration window by clicking the X. Point to the indicator menu again using the three dots and click Delete.
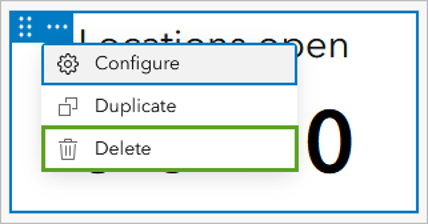
3. In the Delete element window, click Delete.
The element is removed and the other elements are resized.
4. Delete the text element that reads This is a template dashboard by clicking the three dots.
The other field that didn’t have a direct replacement was the AvDailySales field, which you replaced with the Square_Footage field. An important metric to show for retail is sales per square foot, roughly calculated as sales/square footage, so you’ll change this indicator to show the new metric.
5. Point to the menu for the Average daily sales indicator using the three dots and click Configure.
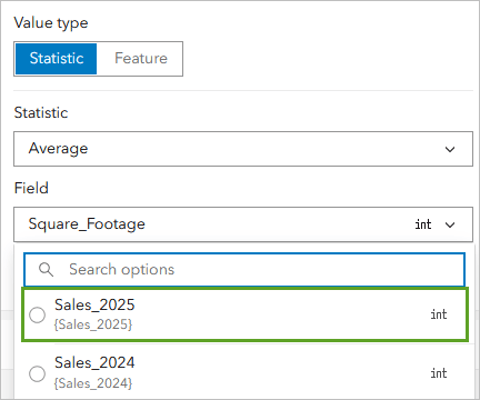
To calculate a ratio, you need to set two fields: the Value field and the Reference field. The Value field becomes the numerator of the fraction, and the Reference field becomes the denominator.
6. For Value type, select Statistic, then change the Field to Sales 2025.
7. Expand the Reference group by clicking the down arrow.
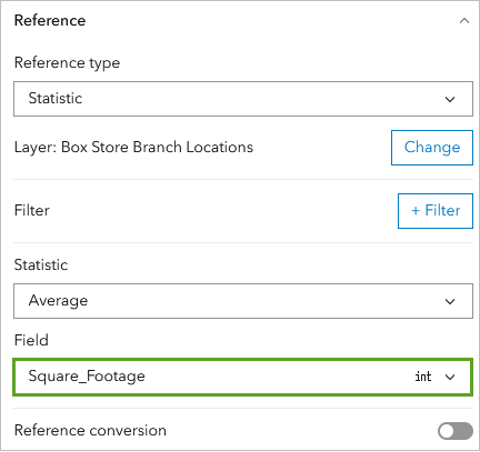
8. For Reference type, choose Statistic. Set the Statistic option to Average.
9. For Field, choose Square_Footage.
Next, you’ll edit the appearance of the indicator to show this new data.
10. Click the Indicator tab.
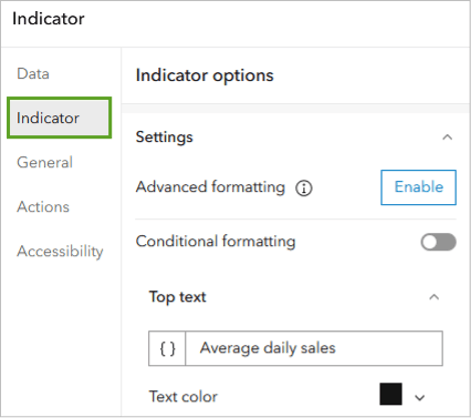
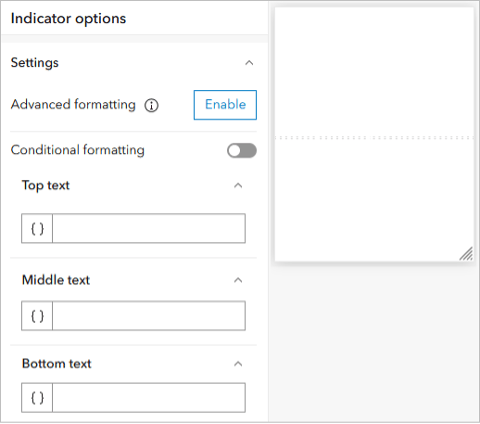
11. For Indicator options, delete any text currently in the Top text, Middle text, and Bottom text fields.
12. For the Middle text field, type a dollar sign ($) and click Insert ({ }). In the Calculated values list, choose Ratio.
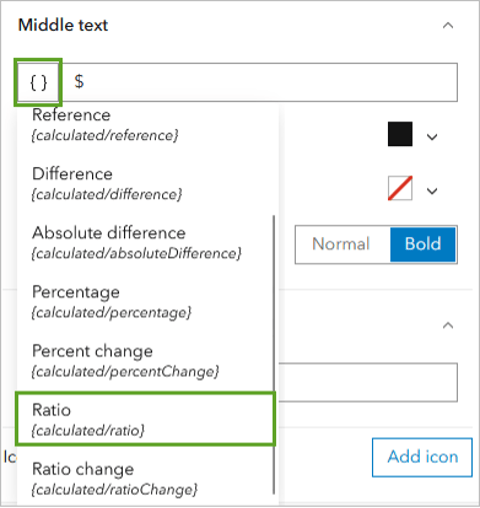
The indicator now shows the formula ${calculated/ratio}, which will calculate the ratio Sales2025/SquareFootage. You’ll add contextual text to the indicator.
13. In the Top text field, type or copy and paste “Sales per sq ft” and click Done in the lower right-hand corner.
The last element that needs to be updated is the bar chart showing sales over time. You substituted the Sales 2022 field for R12, and now the chart needs to be reordered temporally.
14. Point to the menu for the line chart element and click the three dots for Configure.
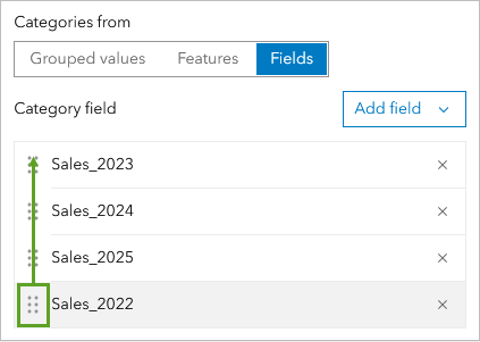
15. In the Serial chart window that opens, for Category field, drag Sales_2022 to the top of the list.
16. Click Done.
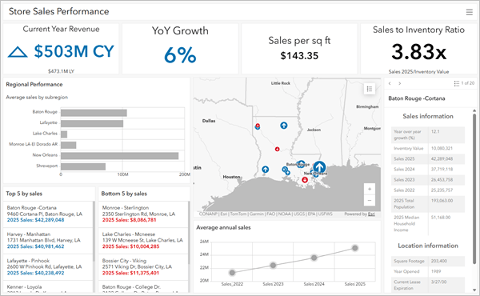
17. On the ribbon, click Save and choose the Save option.
Next, you’ll share the dashboard with your colleagues.
18. On the ribbon, click the menu button (the three bars in the upper left-hand corner) and choose Dashboard item details.
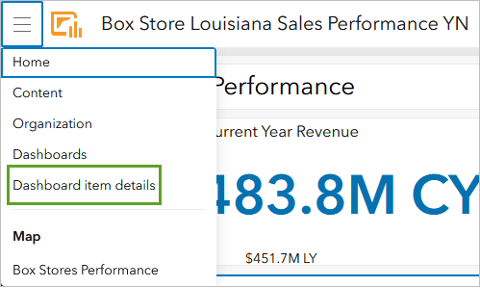
The item details page opens.
19. Click Share on the right. Under Set sharing level, choose Everyone (public).
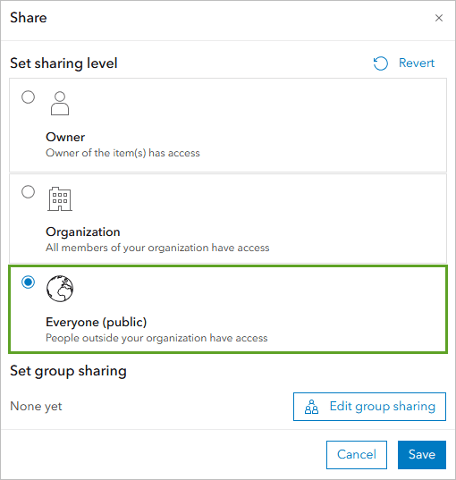
20. Click Save.
In this tutorial, you copied and customized a template dashboard to share sales data with your colleagues. This method can be used to copy any publicly shared dashboard and change the data source to your maps and layers.
This process can save time in re-creating dashboards that are commonly used in your organization, such as inventory dashboards for each store.
Acknowledgements
- The data used in this tutorial is fictitious. It should only be used for educational purposes.
- Human Geography Map sources: Esri, TomTom, Garmin, FAO, NOAA, USGS, OpenStreetMap contributors, and the GIS user community
Visit the Esri tutorial gallery to explore additional topics and find other step-by-step workflows on a variety of products.