

Driving through Rancho Mirage, California, a resort community east of Palm Springs, Jason Jaurigue, the director of information services for the city, can point out the exact spots where a phone call is likely to drop.
In recent years, the carriers’ wireless coverage maps indicated broad service across the city, yet residents often reported dropped calls. For the roughly 17,000 people who live there, unreliable cell service was becoming more than an inconvenience; it was a growing public safety concern.
To close that gap, the path forward was familiar: map it. Jaurigue and his team wanted wireless coverage data to be accessed and visualized in the same way they analyze and communicate other city information.
Working with technology firm CelPlan, the city conducted a wireless assessment by conducting drive surveys—driving around a specific geographic area to capture signal data for multiple carriers. The team then processed and classified the data in ArcGIS Pro and published interactive maps to ArcGIS Online for broad access and use.
The result became the City of Rancho Mirage Wireless Master Plan, an interactive map designed to help city staff and stakeholders compare coverage by carrier and location; identify gaps; and use a shared, data‑driven view to guide next steps.
Maps Reveal the Reality of Wireless Coverage
For the City of Rancho Mirage information services (IS) team, the challenge wasn’t just identifying coverage gaps—it was understanding why they existed. Wireless infrastructure in Rancho Mirage was difficult to inventory. Towers were often hidden within buildings or designed to blend in with existing structures, and carrier-provided maps offered little insight into how the valley’s mountainous topography, low-density development, and limited multistory buildings affected performance.
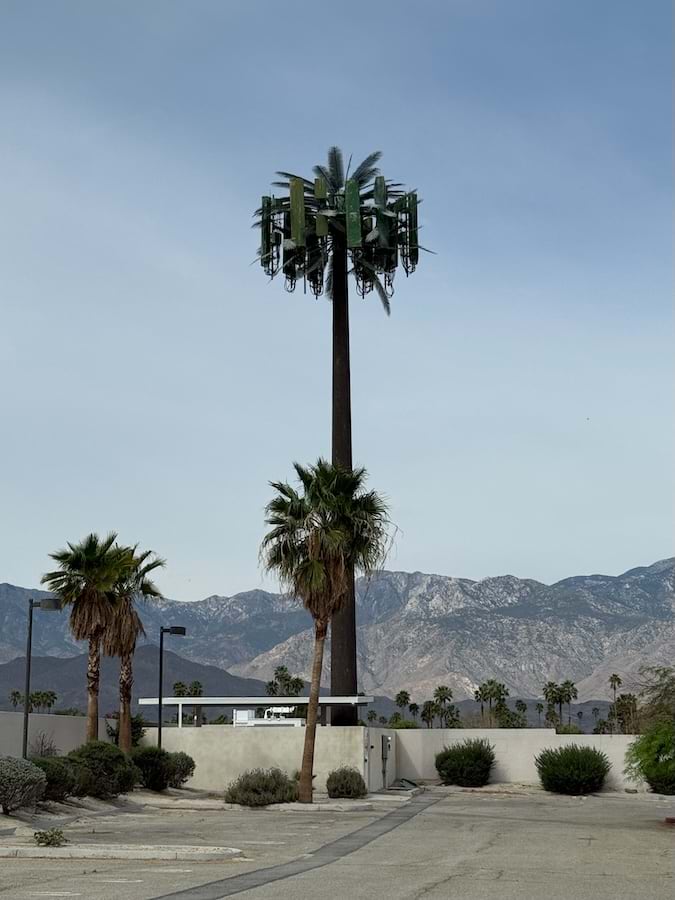
Without a reliable way to see where coverage dropped, which carriers were affected, or how physical conditions influenced signal strength, the city lacked a technical baseline for planning improvements.
“The city needed to establish a real-time, reliable map of all wireless communication infrastructure, along with signal strength,” says Jaurigue. “That process quickly showed us that carrier-provided maps didn’t match our in-house data, which gave us a clear, tangible baseline to work from.”
To build that visibility, the drive surveys were executed using specialized equipment, including a vehicle-mounted radio system that detects cellular signals. At the same time, the team also used standard mobile devices to experience the dropped calls that residents had reported. The dataset analyzed 700 MHz coverage for three cell carriers, considering terrain, buildings, and other obstacles. This low-band frequency (698–806 MHz) is what supports mobile broadband, 4G LTE, and 5G—the cell services residents were eager to see improved.
Rather than treating the effort as a one‑time study, the IS team members wanted to ensure that they could reproduce it in the future. A city IS technician rode with CelPlan staff during the surveys to learn how the data was collected and structured, which will help the city capture, maintain, update, and reuse the information over time.
The next step was putting the data on a map. The IS team linked the raster outputs to address points and used templates in ArcGIS Pro to create and publish an interactive map.
Using GIS to Communicate Coverage Gaps
Once the data was in use, the maps revealed patterns that hadn’t been obvious before. In one case, residents reported calls dropping halfway down a residential street. When the city examined the area in GIS, staff saw that while half of the street had coverage, the other half didn’t.
“When we zoomed in on the map, we realized there were obstacles blocking the signal. You’re not going to see that unless you have the data represented spatially,” Jaurigue says.
That level of visibility changed how staff responded to concerns. The city could show residents what was happening at a specific location and explain why calls were getting dropped—whether due to a building’s orientation, the terrain, or the caller’s distance from existing infrastructure.

One of the most valuable capabilities was address‑level analysis. By tying signal strength directly to address points, staff could see how service changed from block to block and use that context to guide conversations with residents and stakeholders.
With the public‑facing tool, residents can enter their address and see how coverage varies between three carriers in the area. The map allows residents to compare how their current carrier is performing and understand whether another option may offer stronger service at that location.
The map includes a disclaimer explaining that data may not reflect real-time network performance, as wireless conditions change frequently. It also notes the city’s plan to conduct future surveys to keep the information current.
From Insight to Action: Planning for Better Coverage
Using the Wireless Master Plan, Rancho Mirage identified 18 sites where new or improved infrastructure could meaningfully expand coverage. Those sites were identified by both existing conditions—such as towers no longer in operation—and the presence of multistory buildings, including hospitals, hotels, and schools.
Identifying those sites, however, was only part of the challenge. Building a new tower often takes, on average, from three to five years. It involves securing permits, making agreements with private property owners, and coordinating with utilities.
To address lengthy approval timelines, the city is using the Wireless Master Plan as a framework for predesignating prospective sites—establishing design and zoning expectations in advance to reduce uncertainty in the permitting process. This could cut average timelines in half.
Because the data exists in ArcGIS Online, maps and datasets are easily shareable with carriers, property owners, and asset partners to secure buy‑in. At least one major carrier is already working with the city on proposed tower sites based on the information in the Wireless Master Plan. In addition, the city uses GIS tools to simulate what coverage would look like if towers were built at proposed locations.
The plan has also become an asset management tool, allowing city staff to more easily track the conditions and locations of existing towers by using imagery collected during the survey.
What began as an effort to understand cell service coverage gaps has evolved into a system Rancho Mirage employs for ongoing analysis, communication, and planning.
“A lot of cities are watching what we’re doing right now. By using GIS to truly understand coverage on the ground, we’ve moved from reacting to issues to proactively planning better service for our community,” says Jaurigue. “We can now come to the table with carriers and infrastructure partners with real data to guide those conversations.”