Geospatial app developer Hila Roffman was in her element, despite being 7,500 miles away from her home in Tel Aviv, Israel.

All around her at the 2018 Esri Developer Summit (DevSummit) in Palm Springs, California, people were talking about things like maps, apps, geospatial analytics, ArcGIS API for JavaScript, and the Web Graphics Library (WebGL) API. Roffman, an app developer for Esri distributor Systematics Technologies R. G. Ltd., smiled and took it all in.
She couldn’t talk for long in the bustling lobby of the Palm Springs Convention Center because she was heading to a tech session down the hall. But Roffman later explained why she made the long trip to California.
“I am highly interested in the areas of web development and 3D as part of my daily work developing apps and consulting [with] customers who use Esri products,” she said. “The summit includes many diverse sessions which keep me updated with the latest technology features and tools. Besides, Palm Springs is a cool location.”
Every year, the DevSummit theme is By Developers, For Developers—and Esri staff stays true to it. The dozens of technical sessions offered are oriented toward what geospatial app developers want and need to know about building apps using Esri technology, and what tech trends—such as artificial intelligence (AI), augmented reality (AR), and virtual reality (VR)—are on the horizon.
“This week is all about the technology. It’s all about tech sessions and you looking at the technology and getting your hands on it and interacting with it,” Jim McKinney, ArcGIS program manager at Esri, said in opening the three-and-a-half-hour Plenary Session. “But it’s also about people, and it’s also about relationships.”
Before the tech presentations started, Esri president Jack Dangermond praised the audience for their app development work. “Clearly you are the people who are making a huge difference in our field and in your organizations,” he said. “And, in turn, the implication of that is that your work is making the world a better place.”

Geospatial app developers drive efficiency and help people make better decisions and communicate more effectively, according to Dangermond. “You are driving rationality in the way people think,” he said. “[You’re] not just a collection of developers. [You’re] a collection of developers with purpose.”
Dangermond said that while Esri developers focus on creating software for millions of people all over the world, they also are in tune with what other developers need to create apps that use geospatial technology. “They have a mind of developing their tech so that it works in a very effective way for developers,” he said.
ArcGIS = Location Intelligence
In an overview, Esri director of software development Sud Menon explained that ArcGIS is available as a software as a service (SaaS) mapping and location platform—ArcGIS Online—and as a comprehensive GIS, ArcGIS Enterprise.
“ArcGIS,” he said, “enables location intelligence everywhere.”
More than 45,000 organizations around the world use ArcGIS Online to create maps and visualize and analyze data. “Mapping, as you know, is at the heart of ArcGIS Online,” Menon said. “[It] helps you create compelling user experiences that are interactive, immersive, and analytic.”
Smart mapping capabilities in ArcGIS Online are available in 2D and 3D, Menon said. “We have things like clustering that are available with the categorizations that you have applied to your data,” he said. “You can map temporal patterns. And for 3D, we have styles that really bring your data to life in scenes.”

Menon also underscored several other capabilities in ArcGIS Online. “This mapping platform includes an interactive map viewer and map maker that lets you create web maps and web scenes that you can share. [They] are also what power applications, because these maps and scenes are documents that are saved in the platform. They are declarative specifications of the visualizations that you need, and they can come to life in applications. [ArcGIS Online] also includes easily configurable story maps and dashboard apps, along with a JavaScript API that’s built for the modern web.”
Smart mapping capabilities are available to applications via that API, Menon said. He touched on the ArcGIS Online’s suite of mobile field apps for collecting data and navigating from place to place, including its support for high-precision GPS, plus back-office apps for coordinating the work.
Menon also highlighted Insights for ArcGIS for location analytics. “It’s for people who may not have used maps before, but they are familiar with charts and business intelligence,” he said.
In addition, Menon mentioned that ArcGIS Online includes app builders, such as Web AppBuilder for ArcGIS and AppStudio for ArcGIS, and ArcGIS Runtime SDKs for building native apps for iOS and Android devices.
What ArcGIS Online does, ArcGIS Enterprise can do too, with additional capabilities for data management, imagery, and real-time GIS. “ArcGIS Enterprise is comprehensive GIS in your own infrastructure,” Menon said.
Watch the rest of Menon’s presentation in this video.
Mapping in ArcGIS
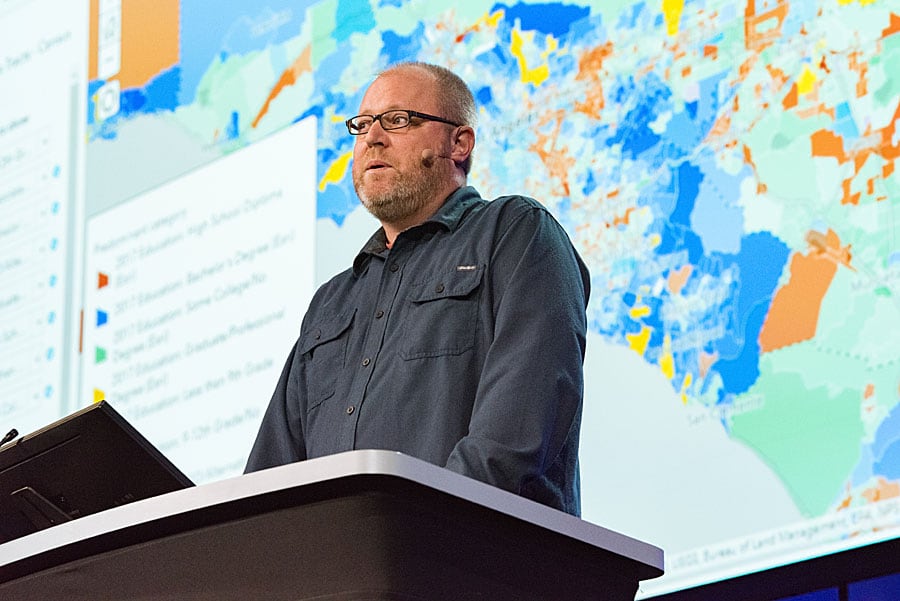
Jeremy Bartley, from the Esri software product development team, gave a shout-out to the developers in the audience before showing some apps created by ArcGIS Online users such as Texas A&M University; the Dubai Electricity and Water Authority; and the City of Tempe, Arizona.
“You are making so many great maps and apps,” he said.
Bartley then showed improvements to ArcGIS API for JavaScript such as the ability to opt in to rendering FeatureLayer with WebGL. (Learn more.) This capability—along with smart mapping and ArcGIS Arcade, a new scripting language in ArcGIS Online—makes working with your data and making beautiful and meaningful maps easier than ever. Watch this presentation from Bartley.
Clustering Data
Thanks to the release of clustering capabilities in ArcGIS API for JavaScript, it’s also easier to visualize large point datasets in ArcGIS. Users can now enable clustering of point data in layers to show clearer patterns of events on a map.

To illustrate how clustering works, ArcGIS API for JavaScript engineer Kristian Ekenes displayed a map that represented a large number of 311 calls, such as graffiti and illegal parking complaints, in New York City. These incidents appeared as small points on the map.
“As you can see, this is not a very useful visualization,” Ekenes said. “The points are too cluttered and, in many cases, are stacked on top of one another, making it impossible for me to see spatial patterns in my data.”
Enabling clustering on the data layer, however, makes all the difference. “The clutter is removed from the map, and clusters appear, summarizing my data,” said Ekenes. “So I can get insight into where more incidents tend to be reported. And when I click on a cluster, the total number of features comprising that cluster is displayed in the pop-up. But perhaps my favorite part of the clustering implementation is that the mapped attribute is summarized in the pop-up as well.”
Watch Ekene’s presentation in this video.
Mapping in 3D
ArcGIS 3D mapping engineers Javier Gutierrez and Russell Roberts announced that the next release of ArcGIS Online will support 3D web scenes on mobile and tablet browsers in addition to desktop browsers.
“This is very exciting,” Gutierrez said, “because just by clicking on a URL, without installing any app, everyone will be able to interact with a 3D scene on their phone.”
Roberts displayed a 3D scene on a screen by using his Apple iPad. The scene showed hundreds of thousands of buildings in Raleigh, North Carolina. He then analyzed walk times to metro stations from residential buildings.
“Going into my building scene layer, I just need to pick the walk time attribute,” Roberts said, “and using the Counts and Amounts style [in ArcGIS Online], I am going to pick a new color ramp and adjust the position of the sliders. You can see, as I make these changes, the scene is updating. You can see that all the buildings in yellow have over a 12-minute walk time and the ones in blue have less than that.”
Gutierrez said that the next release of ArcGIS API for JavaScript will include edge rendering. “With edge rendering, you will be able to style your scene layers with or without textures,” he said. “Edge rendering will improve depth perception and help you see all the details of the 3D geometry.”
View the entire presentation.
Analyzing Data in ArcGIS Pro
Spatial analysis product engineer Lauren Bennett showed what ArcGIS Pro can do when it comes to analyzing traffic data.
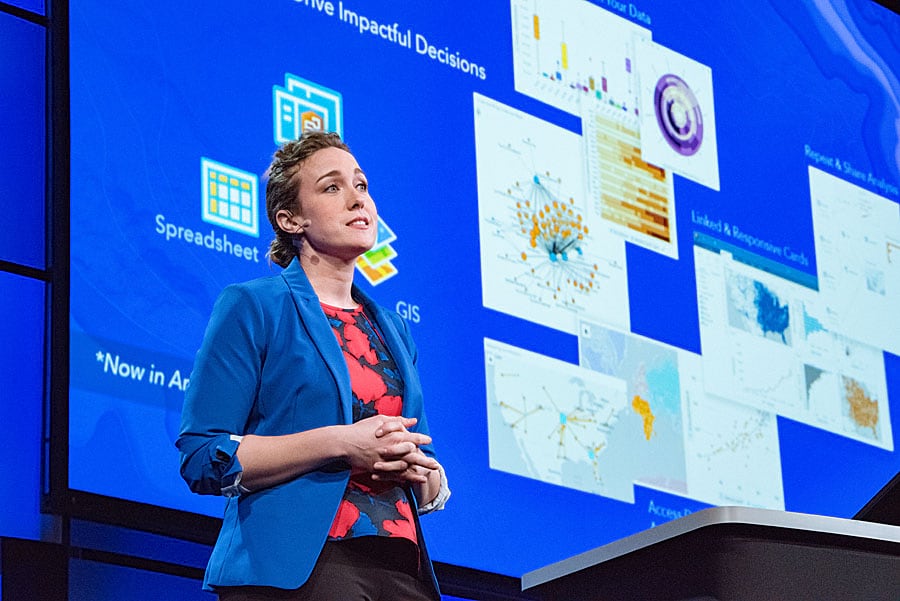
“ArcGIS Pro is one of the most powerful tools in your toolkit [for your work] as analysts and data scientists,” she said. “It’s a fully integrated analytic workstation that makes it easy for you to visualize and explore your data, ask and answer complex questions, and apply The Science of Where.”
Bennett demonstrated a new density-based clustering tool in ArcGIS Pro by using it to analyze traffic congestion in the Los Angeles area. The traffic data was provided by Waze.
“We are looking here at 5:00 p.m., rush hour,” she said, referring to a map of the traffic data. “But looking at tens of thousands of points on a map really isn’t telling us a whole lot. To find the natural spatial clusters in our data, we will use the new density-based clustering tool.” The tool detects areas where points are concentrated as well as where they are separated by sparse or empty areas.
Watch this video to see Bennett go into greater depth about density-based clustering.
Looking Ahead
The Plenary Session was followed the next day by a keynote address by Joseph Sirosh, corporate vice president of the Artificial Intelligence and Research Group at Microsoft. Sirosh said that with the emergence of AI, change is coming to software.
“In the future, with AI, software becomes sentient,” Sirosh said. “It develops the ability to understand what the data means. It allows us to build models that predict things. The cloud, with its unlimited computing power and its ability to integrate vast amounts of data across applications—that is the ocean in which AI is being born,” he said.
All future software will integrate the cloud, data, and intelligence, according to Sirosh.
“Data from all over—not just from regular applications but [from new types of] sensors being invented, and data about all interactions—all of that data is the oxygen that feeds AI. And algorithms, the incredible advances in AI such as deep learning, and others—that gives us sight, the ability to see into the data and act predictively with it.”
To see the one-hour presentation about AI, view this video.
Watch the complete collection of 2018 Esri DevSummit presentations.

