Maps and data from the most-current American Community Survey (ACS) five-year estimates are now available in ArcGIS Living Atlas of the World.
ACS data helps determine how $675 billion dollars in federal and state monies are spent annually, so access to the latest available data is crucial for policy makers and their staff and GIS analysts.
The United States Census Bureau released its 2013–2017 ACS data in early December 2018. Within days, the layers in ArcGIS Living Atlas of the World were updated with the new data and the appropriate TIGER boundaries. That means that anyone who uses these layers now has immediate access to the latest census data. The nationwide data (which also covers Puerto Rico) includes state, county, and tract geographies. Each year, the layers will be updated in a similar pattern. This essentially eliminates the hours or days normally spent locating, downloading, processing, and doing quality assurance to have this valuable data in a GIS-ready format.
After the massive wildfires in Santa Barbara County, California, in late 2017 and early 2018, government analysts used ACS Census Bureau data to track damage boundaries and target recovery efforts. In the past, when a task like this called for current US Census Bureau data, ArcGIS users had to first download data directly from the US Census Bureau website and translate it into a GIS-compatible format. This process, which required additional steps and expertise, could create delays on time-sensitive projects.
The ready-to-use Living Atlas ACS layers provide instant access to publicly available, fully documented, and ready-to-analyze data sourced directly from the census APIs. They cover topics such as basic population characteristics, housing, education, poverty, home ownership, journey to work, employment, and many more that you can use as is or customize for your specific needs.
Each ACS estimate comes with the associated margin of error. There are two versions of each feature layer: one for boundaries and one for centroids. Each layer comes with ready-to-use cartography and pop-ups but can easily be customized or reconfigured for your own web maps. You can browse this ArcGIS Online group of example maps and apps for inspiration.
“Those who have worked with census data know that the process of making multiple data tables GIS ready can be very time-consuming,” said Lisa Berry, Esri cartographic product engineer. “Now there’s no need to manually process the data. Living Atlas will not only have a subset of ACS data readily available for GIS workflows, but the data will also be updated automatically each year when the US Census Bureau releases its new data.”
You can explore several of the maps below:
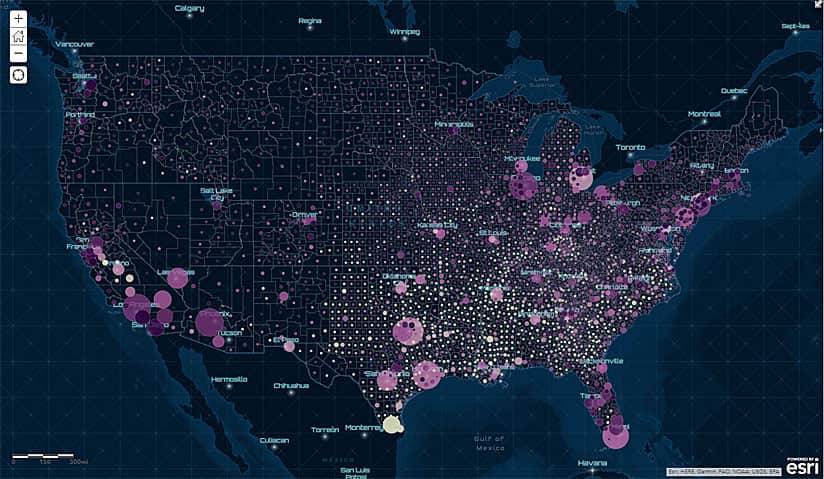
- Children in Poverty
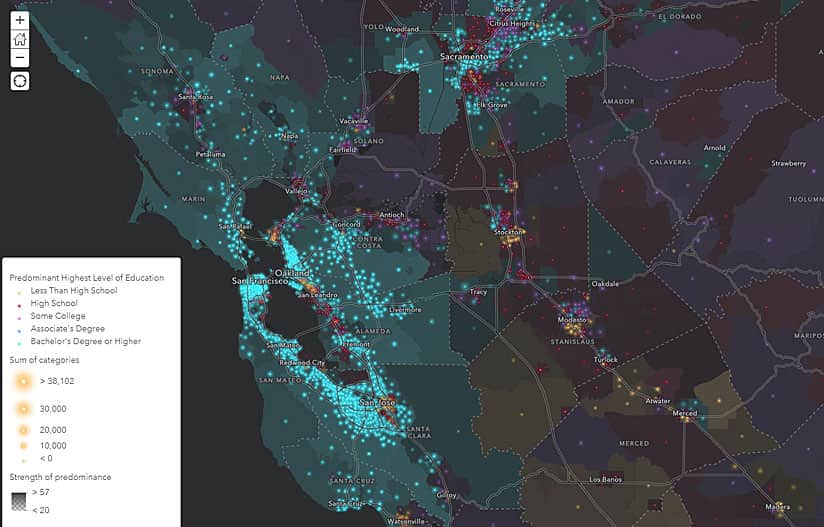
- Predominant Highest Level of Education in the US (ACS)
- What language do people speak at home other than English?
- Where are households using a smartphone as their only computing device?

Read this blog, check out the FAQs for ACS Hosted Feature Layers, or view this story map for more information about how to access and use the layers.