We are excited to announce that new feature layers containing the latest 2013-2017 five-year demographic and housing estimates of the American Community Survey (ACS) are now available within the ArcGIS platform through ArcGIS Living Atlas of the World. These ready-to-use layers allow instant access to publicly-available, fully documented and ready-to-analyze data sourced directly from the Census API.
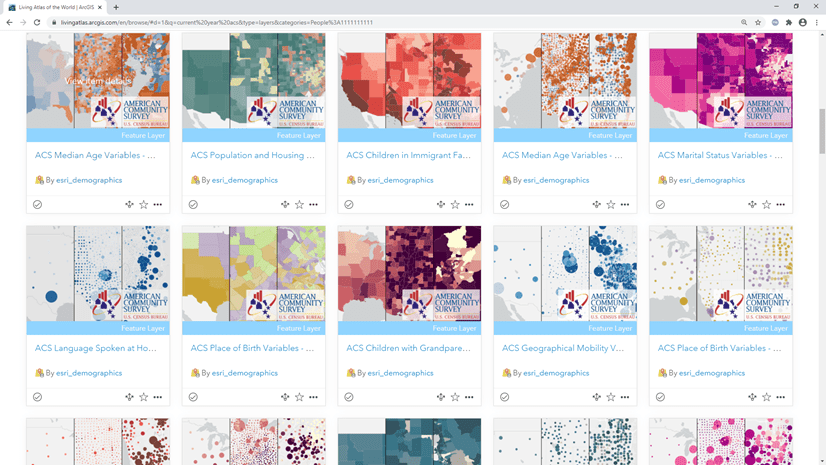
We’ve taken over 70 of the most popular ACS tables, including many of the newly-released Computer Ownership and Internet Connectivity tables, and created feature layers for ArcGIS Living Atlas of the World. This means all ArcGIS users have access to over 900 attributes of publicly-available data at the state, county, and tract levels.
Browse Living Atlas by topic or subject area to discover the layers that are relevant to your work. Services include attributes on housing, education, earnings, youth, veterans, marital status, poverty, and much more. All the feature services available are available in an ArcGIS Online content group called ACS Current 5-Year Estimates.

There are two versions of each feature layer: one for boundaries and one for centroids. Each and every estimate comes with the associated margin of error.
What?
The American Community Survey (ACS) is the largest demographic survey conducted by the Census Bureau. It enables local officials, community leaders, businesses, and researchers to understand the changes taking place in their communities. The ACS is the premier source for detailed population and housing information. This data determines how $675 billion dollars in federal and state spending are spent each year, so access to the latest available data is crucial for policy makers, their staff, and their GIS analysts. Many government organizations are required by law to use ACS data when doing mandated reporting, applying for grants, and doing analysis on populations.
Why?
As those of you who have worked with American Community Survey data know, the process of simply getting the treasure trove of ACS data tables into a GIS-ready format can be very cumbersome. Now there’s no need to make sure your GEOID or FIPS field has leading zeros, join to geography, and manually calculate totals and percentages (and the associated calculated margins of error). We’ve done that for you. We also refresh the data values for you right after Census releases new estimates.
We’ve also included three value-added benefits in these layers:
- These layers have cartographic-friendly geographies with nice coastlines instead of the international borders.
- We added calculated fields (noted by the “_calc_” stub in the field name) for common totals, percentages, and ratios that people often derive, along with the associated margin of error for each calculated field.
- We’ve taken the time to create complete and descriptive alias names which makes the services more user-friendly.
You can easily add these layers in ArcGIS Pro, ArcGIS Online, configurable apps, dashboards, Story Maps, custom apps, and mobile apps.
How Do I Use This?
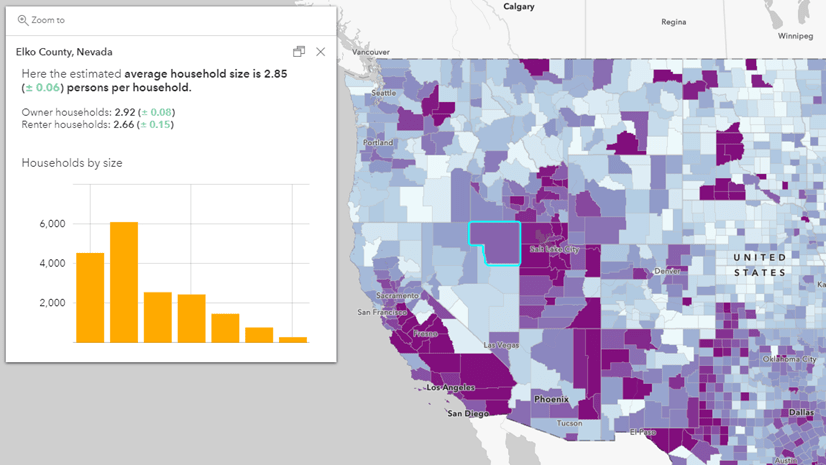
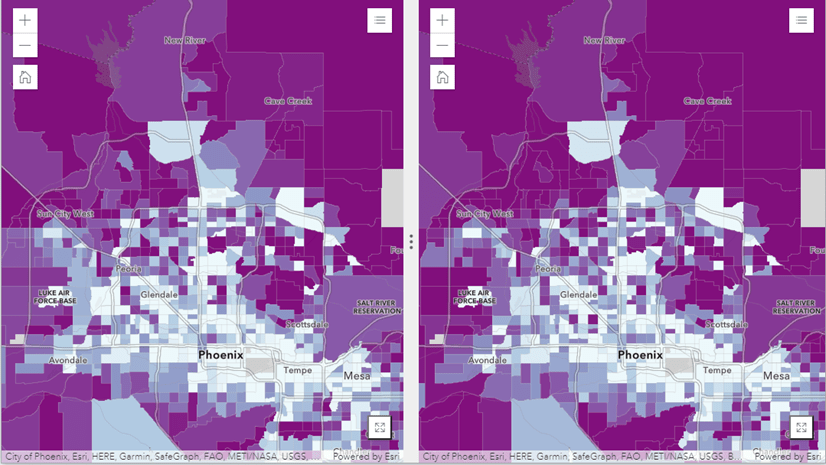
These layers are publicly available and ready to be accessed, shared, and used within GIS workflows. Each layer comes with ready-to-use cartography and pop-ups, but can easily be customized or reconfigured for your own web maps. You can browse this ArcGIS Online Group of example maps and apps for inspiration.
To start, it might be helpful to filter the layers by your state or county, since this is a national data set. Then pick an attribute or two and let Smart Mapping help you explore your data. And if you’d like to calculate a custom value using the available attribute fields, you can do so using Arcade Expressions. Each layer includes margins of error, so if you’d like to include the margins of error in your maps, you can. Finally, save your web map and use it in a story map or a configurable app. See the blog post “Make a Map of Your Community” for a full tutorial.
When using this data, please cite United States Census Bureau’s American Community Survey 5-year estimates accessed through ArcGIS Living Atlas of the World, with the most recent vintage and the specific table ID(s) found in the top of the Description and in the Credits (Attribution) section of each layer’s Item Details page.
When Do These Layers Get Updated?
These layers will be updated when Census releases new 5-year estimates (typically in December). Any maps or applications you create that call to these layers will be automatically refreshed with the latest data. All symbology, pop-ups, labels, and other configurations that you have saved will remain intact, but the values in the attribute fields will be refreshed within days, and your map will render these new values. All you need to do is simply check your maps that now reflect the newest data to see if you want to make any adjustments, rather than build the whole thing again from scratch. The time saved means more time spent actually using the maps and layers in your day to day work.
I Want Details – Tell Me More!
For information on the exact fields available, click on a layer within the group and navigate to the Data tab on the Item Details page. Use Fields view (rather than Table view) to quickly look up what’s available. Each layer’s description in the Item Details is fully documented with the specific table(s) and any appropriate data notes.
Check out this accompanying FAQ site that contains all the gory details including the full list of layers available and naming conventions used for the calculated fields.
We will be discussing more of the capabilities of these layers and demonstrating ways to make customized web maps from them at the upcoming Spatial Data Webinar in January. If you run into a question as you’re using these layers, or any Living Atlas layers, feel free to post on the ArcGIS Living Atlas space in the Esri Community.
A whole-hearted thank you to everyone who made this possible: @Lisa Berry, @Paul Dodd, @Julia Holtzclaw, @Jennifer Bell, and @Jim Herries. We did it. Woot! Also, thank you to all the American Community Survey respondents who make all this data possible which is so important for America’s communities.
This blog post was edited on 11/19/21 to change “every December” to “typically in December.”

Commenting is not enabled for this article.