
The introduction of the World Wide Web in 1989, made possible by its inventor Sir Timothy John Berners-Lee, changed our world in significant ways: many people now go online every day to shop, read the news, and do business.
Massive amounts of data are shared online, along with many GIS web maps and apps. Software developer Pinde Fu realized the possibilities that Web GIS would bring as early as the mid-1990s, when he built his first web application using Esri technology.
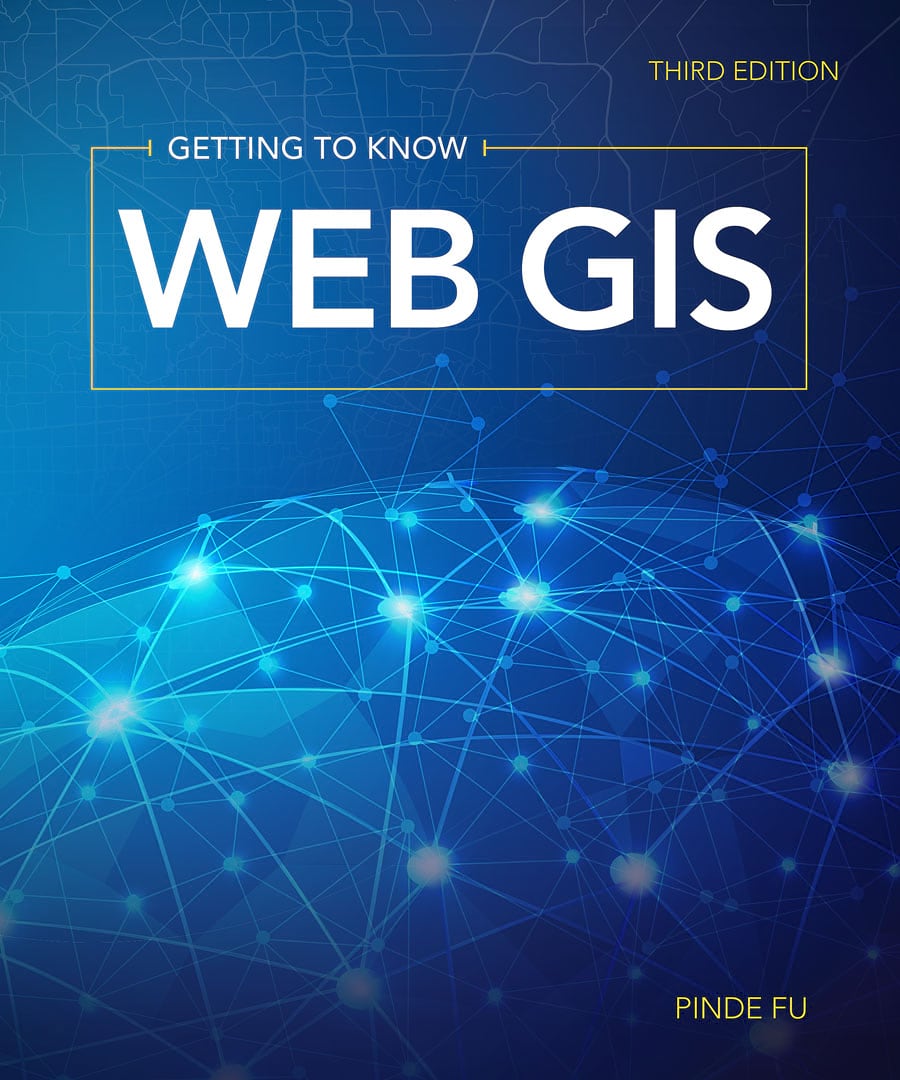
Today, Fu, who leads the ArcGIS platform engineering team at Esri Professional Services in Redlands, California, teaches and writes about Web GIS extensively, including the book Getting to Know Web GIS, third edition, published this month by Esri.
Readers of Getting to Know Web GIS will hone their technical skills in Web GIS, learning how to create web maps, web apps, and Esri Story Maps apps and then use web apps to collect data in the field, author an operations dashboard, and conduct spatial analysis. They also will get to create web maps with real-time data and author 3D web scenes and web apps.
What’s new in this third edition?
Dr. Jie Chang, an Esri software product engineer on the 3D analysis team who has many years of experience working with imagery, contributed a chapter on image services and raster analysis. Readers will learn how to publish image services and make large volumes of imagery and remote-sensing datasets available online for fast visualization and spatial analysis. With this capability, vegetation index, soil moisture, and land-cover changes can be revealed easily, quickly, and dynamically.
An entire chapter is now devoted to working with mobile apps. GIS apps used on mobile devices are becoming more ubiquitous as organizations increasingly take GIS into the field to collect data, navigate to locations, and track and monitor operations in real time. The web analytics company Statcounter has reported that mobile Internet usage, including from tablets and smartphones, has now topped desktop use globally. And according to a recent report from Cisco, Internet Protocol (IP) traffic from smartphones alone will be greater than that from personal computers (PCs) by 2021.
Real-time GIS is the focus of a new chapter that emphasizes the Internet of Things (IoT), smart cities, and smart homes in the context of Web GIS. Readers will learn how ArcGIS GeoEvent Server can ingest large volumes of sensor data, process the data, and produce output on the fly. In one of the assignments, readers also get to use the new Operations Dashboard for ArcGIS web app to create a dashboard with a map, lists, charts, and gauges that show real-time information on it.


“Operations Dashboard is [now] web based and easier to use,” Fu said.
With the Esri ArcGIS platform rapidly evolving to offer greater support for mobile and Web GIS, the book offers tutorials on how to author smart surveys, collect data with Survey123 for ArcGIS and Collector for ArcGIS, and create a native app with AppStudio for ArcGIS. And there’s new material on big data analysis and vector tiles and technology trends such as virtual reality (VR), augmented reality (AR), IoT, and artificial intelligence (AI).
Tutorials that were done in previous editions in ArcMap are now done in ArcGIS Pro, an ArcGIS Desktop application. Many other tutorials can be done using ArcGIS Online or Portal for ArcGIS in ArcGIS Enterprise. In an optional tutorial, ArcGIS GeoAnalytics Server is required to conduct big data analysis.
Fu says that ArcGIS GeoAnalytics Server uses distributed computing, which means that the big data analysis is done in the database and only the results that are needed are extracted.
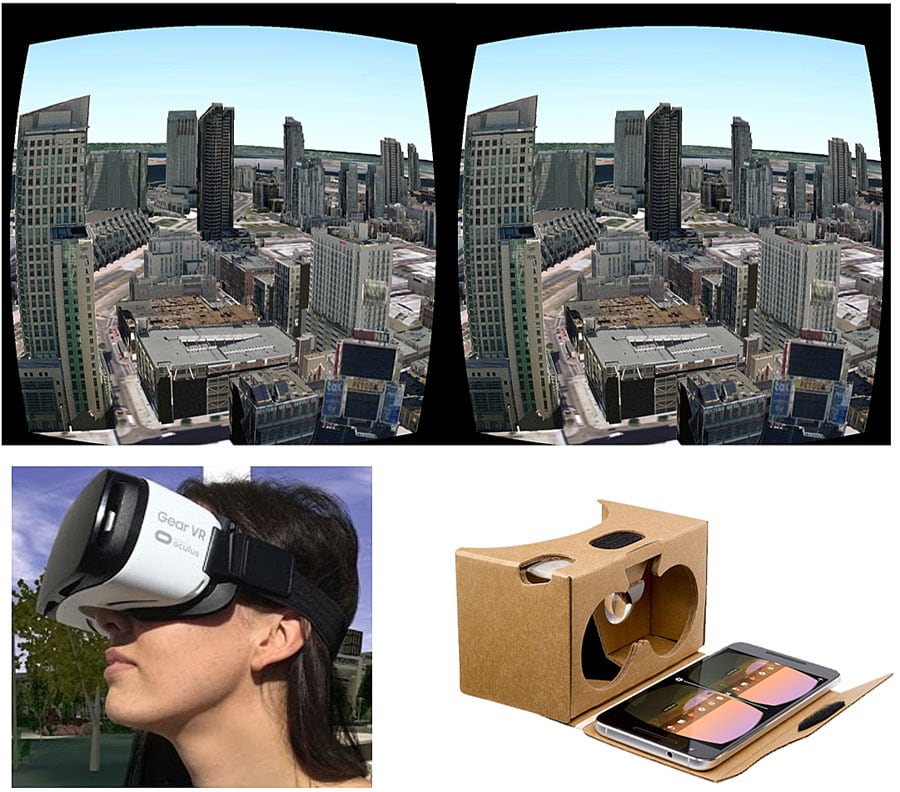
There is also an emphasis on 3D web scenes in the new edition of Getting to Know Web GIS, with one chapter devoted to teaching the fundamentals of 3D GIS and exploring and creating web scenes. That same chapter introduces VR and AR and explains how the two technologies can be used to visualize GIS data.
“With VR, users are immersed inside maps. Users not only see 3D scenes in front of them but also around them as they look up, look down, and look around,” Fu said. “This will be useful in architecture and urban planning to see, for example, how a building will look in 3D before it is constructed,” he added.
“AR can augment our understanding of the world. For example, it can allow us to ‘see through’ the ground and walls and see the pipelines and wires under the ground and behind the walls,” Fu said.
Getting to Know Web GIS includes tutorials and assignments based on relatable, real-life scenarios. Readers use Web GIS technology to create a points-of-interest city tour, find a good location to buy a house, determine the best site to open a new restaurant, and build an app for reporting potholes or other street maintenance issues.

Fu teaches GIS at the University of Redlands in California and the Harvard Extension School and enjoys seeing what type of web apps students create after they learn to use Web GIS.
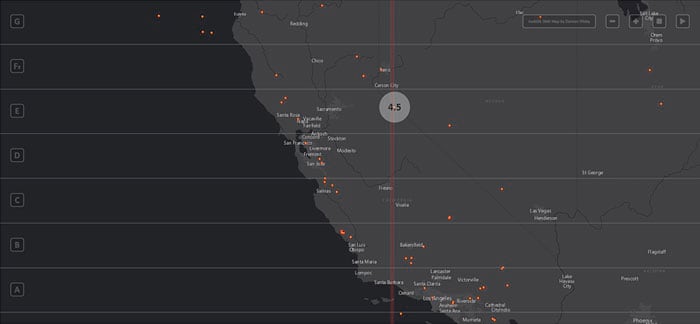
Students have, for example, created a web app for reporting problems on campus such as broken glass and fallen tree branches. One student used ArcGIS API for JavaScript to develop an earthquake audio map for visually impaired people that uses sounds to indicate the location and magnitude of quakes. A higher pitch, for example, means the earthquake is on the north side of the map, while the higher the volume, the larger the earthquake’s magnitude.
“I hope this book sparks [the] imagination and encourages creative uses of Web GIS,” Fu said.
Getting to Know Web GIS, third edition, is available in print (ISBN: 9781589485211, 486 pages, US$94.99) and as an e-book (ISBN: 9781589485228, 486 pages, US$94.99). Both the print edition and the e-book can be purchased from most online retailers worldwide.
