Cities depend on surface water infrastructure to prevent flooding and protect the environment of lakes and rivers; however, maintaining a robust and functioning system of storm pipes and catch basins takes a tremendous amount of time and energy. Using ArcGIS Experience Builder and ArcGIS Dashboards, the City of Renton, Washington, has created a comprehensive portal to streamline the process of compiling and communicating information about the city’s surface water infrastructure.
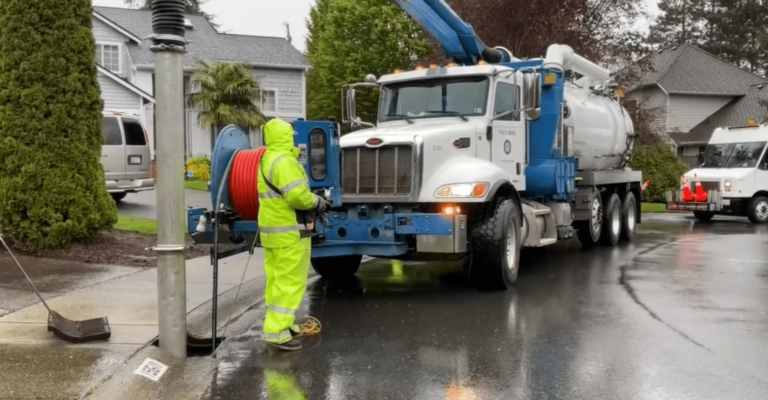
Prior to implementation of the portal, city maintenance crews relied on paper maps to record maintenance activity. For instance, a maintenance worker might clean a stormwater line, highlight that line on a physical map, and record it in a Microsoft Excel spreadsheet.
“We would struggle in getting organized information [that was] needed from our maintenance crews for reporting purposes,” said Joe Farah, Renton’s surface water engineering manager. “Somebody put their information in Excel, somebody put it in a Word document, and then [we had to reconcile] that. Having all that information visually in dashboards has been life changing for us.”
Laying the Groundwork
Nizar Salih, the GIS analyst behind Renton’s surface water portal, began by using ArcGIS Dashboards, creating individual dashboards to track maintenance and regulatory requirements.
“[At first] it was one dashboard,” said Salih. “Now there are two, now three. Where can I have all those in one place?”
ArcGIS Experience Builder, an application primarily used for the creation of web apps, proved ideal for getting all these dashboards together. Salih was able to tailor the portal to meet the specific needs of the city.

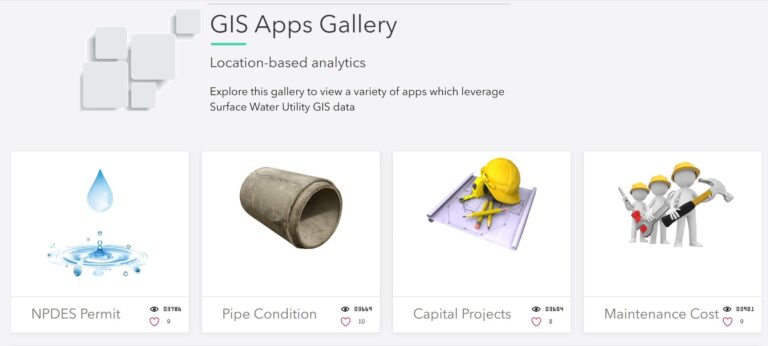
Currently, the portal contains 14 dashboards for tracking information about pipe maintenance, treatment facilities, and maintenance costs. It is used to assist staff in complying with the Clean Water Act’s National Pollutant Discharge Elimination System regulations, maintaining the city’s stormwater system, and compiling information about capital projects. The portal also includes links to other software used by the city’s surface water staff.
“I just fell in love with Experience Builder because the limit is your imagination,” said Salih. “It has all the tools that help you do what you want to do.”
Not only was the process intuitive, it also inspired Salih to try to expand the portal beyond simply tracking the work done by the surface water maintenance section of the city’s public works department.
“I think I would [like to] bring more focus into what the workers are doing,” said Salih. He added that he would like to visualize “the entire process of how they clean the catch basin and a storm pipe. What are people doing for us out there?”

Municipal maintenance employees, Salih noted, are the ones putting in the work in the field. He sees the portal as a way to make their job easier and ensure that everybody is on the same page about what needs to be done to keep the city’s surface water flowing.
Up and Running
Now that the ArcGIS Experience Builder portal is live, the city has put it to a variety of uses, all vital to a well-functioning surface water system.
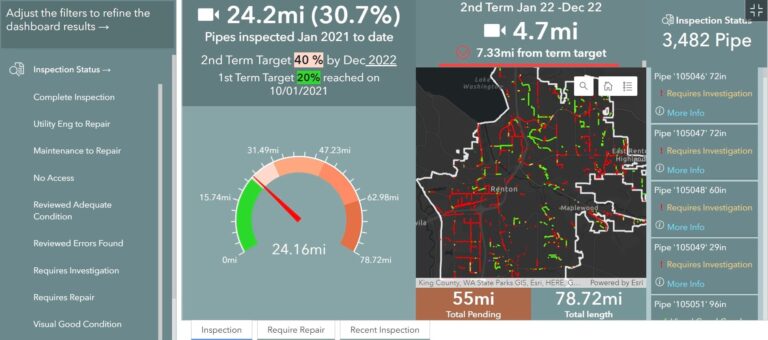
“We have to meet certain maintenance standards imposed upon us by state and federal regulations,” Farah noted as an example. “So that means we have to clean our pipes once every five years. How do we know we’re meeting that goal? How do we know how well we’re on track toward cleaning all our pipes?”
The portal provided a consistent mechanism to get administrators and maintenance workers on the same wavelength about when and how requirements are being met. In addition, the city was more reliably able to gauge progress on those requirements.
“Visually we’re able to track how well we’re [meeting] that goal and whether we need additional resources,” said Farah. “It cut down on our reporting time significantly.”
The portal is also used to track routine maintenance and operation of the city’s stormwater system. Evaluating pipe condition, for instance, is a continuous headache for any public works department, and Renton is no exception.

“[Some pipes] are made out of what we call degradable materials, like corrugated aluminum. Water washes out that metal very quickly,” Farah said. “Concrete pipes have also given us problems throughout the years.”
Using the portal, surface water engineers are able to designate pipes as problems to address in the future, or flag them for maintenance staff to repair more quickly. Using the various dashboards, maintenance and engineering staff members can view the projects that have been assigned to them, streamlining the repair process.
Of course, the surface water section also uses the portal to keep track of capital projects such as laying new pipe.
“If somebody comes to me and asks, ‘What are you doing right now? Where are your projects located?’ I can just go to the capital projects dashboard and show them how many projects we have under way,” said Farah. “It’s a good visual tool for presenting information to city officials and even to the public.”
Overall, the portal “really boosted productivity,” Salih said, because maintenance and administrative employees were able to get a clear, consistent picture of their progress as well as the work yet to be done.
“Whenever in an organization you cut down on the number of times you have to go and ask someone [for] information, the more you have information at your disposal that updates on a daily or weekly basis, [the more] efficient [the] organization,” said Farah.
Learn more about different ways to use ArcGIS Experience builder and ArcGIS Dashboards:
- Get started with ArcGIS Experience Builder – Gallery template
- Pushing the limits of Arcade in dashboards

