A new kind of business intelligence drives success, creating happy people, healthy communities, and a better bottom line for firms as diverse as The Wendy’s Company; Con-way Freight; and Lululemon Athletica, Inc.
Representatives from those companies, along with Bank of America, Nike, and others, showed how they achieve those goals using GIS and location analytics, telling their stories at the 2014 Esri Business Summit in July. Nearly 400 business managers and executives attended the event at the Hilton San Diego Bayfront in California.
Companies like Lululemon, with a mission statement of “Creating components for people to live longer, healthier, fun lives,” use GIS to better understand who their customers are, where they live, and the best places to serve them.
Starting Small
Booth Babcock, the integrated planning manager for Lululemon, says his company puts community first. Lululemon is a high-end, international athletic apparel company headquartered in Vancouver, British Columbia, Canada. The company was founded in 1998, as Babcock said, “by a bunch of yogis,” to fill a gap in the clothing market for active women participating in sports.
Babcock said the company was looking for a solution that could help guide its growth and was fast and affordable. The company found that Esri’s Business Analyst Online (BAO) was that solution.
“We wanted to sign up and instantly have access to mapping,” said Babcock. “We’re not really software guys, but after 20 minutes, we were up and running.”
Lululemon doesn’t have a loyalty card program. As the company continued to grow and open new storefronts, it was important for the business to understand who made up the customer base. BAO provides the data Lululemon needs for its North American market.
The company strives to provide outstanding service to its customers, called guests, so implementing a lengthy survey at checkout wasn’t an option. Instead, the company decided to ask for each guest’s postal or ZIP code. Using this information, Lululemon was able to map where customers were coming from and understand the demographic makeup of the guests from those areas. This gave Lululemon a sense of the people who were frequenting its stores. They weren’t exactly who company executives had expected.
Instead of only the young, single women and men with high disposable incomes living in upscale urban communities that the company initially started serving, Lululemon’s guests also included a lot of suburban moms and dads. Understanding who its customers really were helped the company seek retail locations that it traditionally might not have considered—easily accessible malls as well as busy urban streets.
Now Lululemon can study different markets in the United States and Canada and find its customers. “This works well because we can replicate the same workflows over and over,” Babcock said. “And it’s not a black box; we can do whatever we want with it.” (Watch an interview with Babcock.)
The best part? According to Babcock, starting small with BAO meant that Lululemon, like other companies, can handle the occasional misfire in style. Lululemon can drop a project and move on. This helps the company’s bottom line look good (As well as that of its customers, thanks to those great black stretchy pants the company is known for.)
Going from “Can I Do It?” to “I Did It!”
Karan Singh, director of research and strategy of General Growth Properties (GGP), agrees that starting small—in this case, implementing ArcGIS Online instead of a larger solution—was the key to going from “Can I do it?” to “I did it!”
GGP operates 120 regional malls across the United States, including some of the most well-known shopping centers: Tysons Galleria in Washington, DC; Los Angeles, California’s Glendale Galleria; and the Ala Moana Center in Honolulu, Hawaii.
The company’s analysts use ArcGIS Online to view each mall and drill down to individual stores to analyze store performance. Brokers within GGP use this information to convince potential retail tenants why the GGP managed mall is the best location for them. Integrating locational, market, and geographic data with sales and tenant-level analytics gives the analysts and managers a better way to manage the right mix of stores and provide the best variety of retail, entertainment, and food choices to the people in the area.
“Our demographics change every day,” Singh said. “One day we might be engaging with Lululemon, and the next with Brighton Collectibles, so it’s important that we understand the people who come and shop at our malls and that we present this to our retail customers.”

A Better Work Environment
The benefits of GIS outlined during the four days of the conference were many, and they didn’t stop at just helping the bottom line.
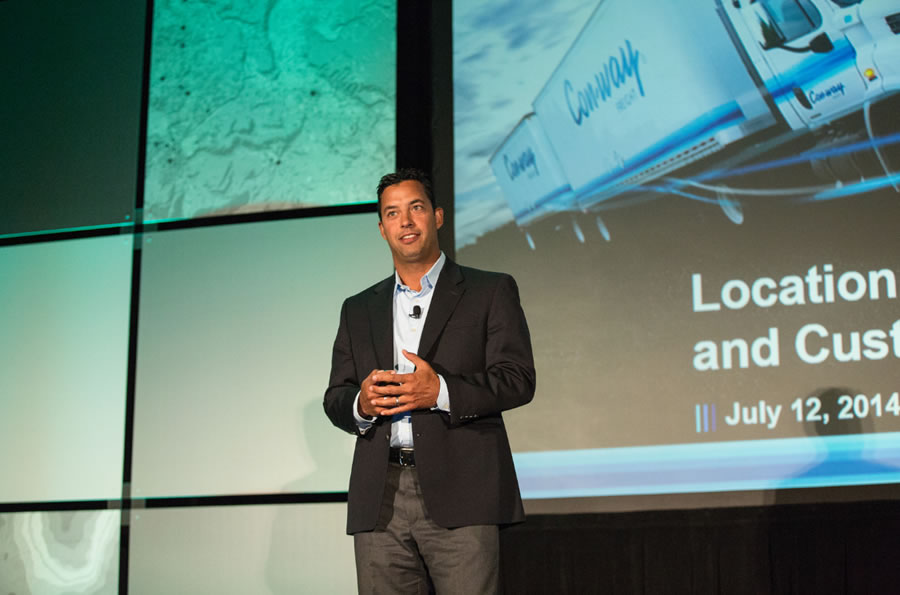
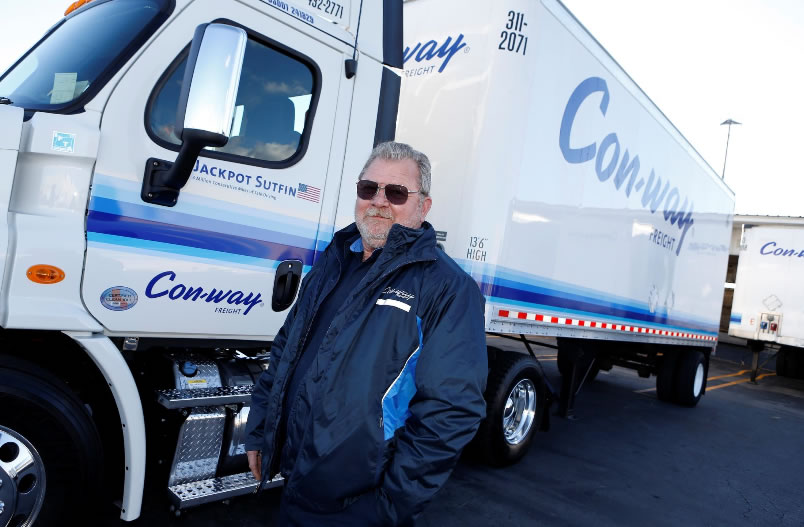
Jeff Rivera, vice president of national account sales at Con-way Freight, talked about how integrating GIS into their lean business culture helps improve the working conditions of drivers like James “Jackpot” Sutfin. Sutfin has worked for Con-way, a $5.5 billion freight transportation and logistics services company based in Ann Arbor, Michigan, for almost 30 years.
Sutfin has driven three million miles without an accident or an injury—an incredible feat in light of all the things that can go wrong on the road including rigs that break down, traffic congestion, and customers late with shipments. And when Sutfin is late or misses a delivery window, it is frustrating for both him and the customer.

Esri is helping Con-way understand what obstacles drivers like Sutfin encounter and make those unknown barriers—traffic, late customers and road closures—visible. Using ArcGIS, managers are able to see where there are unnecessary wait times, heavy traffic, or bad routes and time windows for delivery, helping the company to save time, money, and eliminate these time gobblers or what Con-way managers refer to as ‘waste’. This improves morale and job satisfaction among the drivers and, ultimately, provides better customer service.
“Esri provides a clear solution to transform how we route our drivers, so we can eliminate waste and increase value,” said Rivera. “Esri solutions helped us work with our customers differently.”

Taking the Guess Work out of Site Location
John Crouse, director of real estate services for The Wendy’s Company, the popular fast-food chain, uses GIS and location analytics to better understand its customers’ behaviors and make more informed decisions. This is a challenge because Wendy’s doesn’t collect customer data through loyalty cards or other means. He told the audience that in the past, to figure out where new restaurants should be opened meant guessing about who their customers were.
Today, there is no more guessing. Wendy’s relies on Esri’s Tapestry Segmentation data to provide insight into who its customers are so the company avoids opening restaurants in the wrong locations (i.e., where they may attract fewer people).
Tapestry provides accurate, structured classification of neighborhoods in the United States based on proven segmentation methodology and socioeconomic and demographic characteristics. The system combines the who of lifestyle demography with the where of local neighborhood geography. Users can see where important changes are taking place and where population has stayed the same.
Using GIS and location analytics, Crouse’s department can provide critical information to make the best real estate decisions.
“GIS takes the subjectivity out of our work and helps us do things that benefit the company,” Crouse said. He estimates that in the first two years, the company saved up to three-quarters of a million dollars. (Watch a video interview with Crouse.)

Taking it to the Streets
Chick-fil-A is another fast-food chain that relies on GIS to open up successful restaurants. Steady growth since the first restaurant opened in 1967 has led Chick-fil-A to become the largest quick-service chicken restaurant chain the United States, with more than 1,700 locations in 39 states and sales of more than $4.6 billion annually.
Instead of pushing the end products of data and maps to the field, it has taken GIS to the field. Chick-fil-A conducts predictive analytics with ArcGIS. Staff can view and edit data in the field using web maps on computers or mobile apps, providing a foundation for operator-driven growth.
This privately owned fast-food restaurant chain headquartered near Atlanta, Georgia relies on operators instead of franchisees to open and run the restaurants. Chick-fil-A’s Chan Lee, a senior analyst, spoke about the company’s success and dedication to its operators, attributing the achievements of Chick-fil-A to them and their devotion to the communities where the restaurants are located.
The operators take the company’s core value “making a positive impact on communities and the people in them” to heart. They are known for fund-raising for local charities and donating to local schools.
It is important to ensure that other Chick-fil-A restaurants aren’t opened in communities where a Chick-fil-A is already established. To avoid that, the company conducts market analytics using Esri’s ArcGIS platform.
“We really care about our operators and our customers,” said Lee. “So, we are very careful about placement and cannibalization. The only way to ensure we don’t have cannibalization is through GIS.”
