Have you ever worked with hundreds or even thousands of points that overlap, making your map look more like a Jackson Pollock painting than a map of meaningful patterns?
With new clustering capabilities in ArcGIS Online, you can now easily uncover hidden clusters in your data. This tip provides the steps used in an ArcGIS Online demonstration shown at the 2018 Esri User Conference (Esri UC) Plenary Session. Follow these simple steps to go from points on a map to patterns on a map using this web map example of power plants around the globe.

Step 1: Open a Map with Points in ArcGIS Online
- Open this sample map of over 20,000 power plants around the world, or open a map with your own point dataset. Note: Clustering currently works with feature layers containing up to 50,000 points.
- Notice how the points in the Power Plants map overlap, making patterns somewhat difficult to decipher. You will be able to resolve this issue in step 2.
Step 2: Enable Clustering
- Click the Content tab on the left side of the page.

- Under the Power Plants layer, click the Cluster Points button.

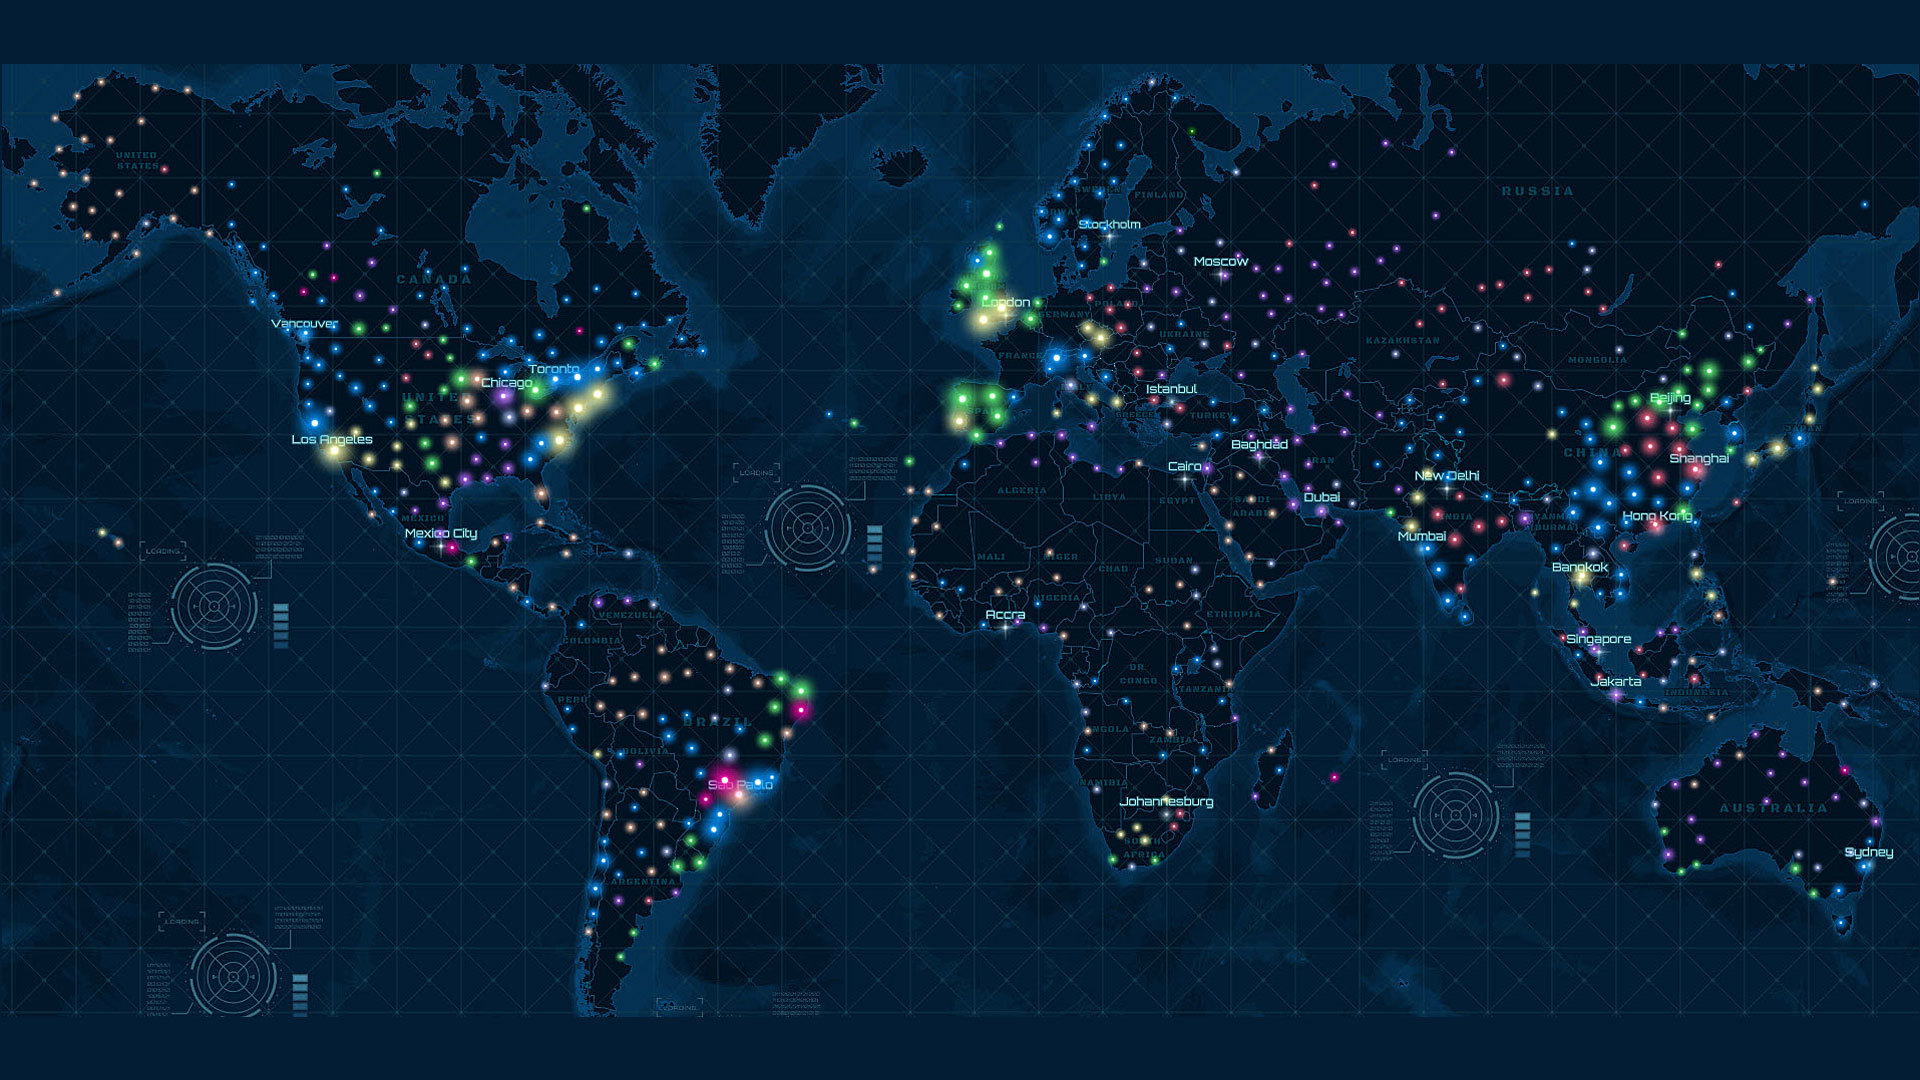
- Move the slider to the left or right to view more or less clustering and choose a setting that works best with your data. For the Power Plants map example, move the slider all the way to the left to show less clustering. Doing so reveals clusters of hydropower plants in the northwest United States (in blue), wind plants in Spain (in green), gas plants in the Middle East (in purple), and solar plants in Japan (in yellow).

Step 3: Configure the Clustering Pop-Up
- Every interactive web map deserves a great pop-up. To edit the clustering pop-up, click the blue text Configure Clustering Pop-up found below the slider.

- Click the green CONFIGURE button.

- The default pop-up reveals the number of features and the predominant or most common fuel type in each cluster. The second sentence changes depending on the type of attribute visualized in the map. In the Power Plants map example, the attribute visualized is a type or category, so the default pop-up reveals the predominant value. If the attribute visualized is a number, the clustering pop-up will reveal the average value in the cluster.

- You can edit the pop-up to better explain each cluster. In the first sentence, change the word features to power plants and change the second sentence to The most common fuel type in this area is: {expression/cluster_type_fuel1}.
- Click OK, then OK, then OK again.
- Click one of the clusters on the map to view your custom pop-up.

Clustering provides greater insight into your point datasets, making your maps more legible and patterns identifiable. The automatically generated clustering pop-up reveals valuable information about your attributes and offers an interactive and exploratory experience for your viewers. Explore hidden patterns in your point dataset with clustering!
To learn more about clustering, visit the following sites: