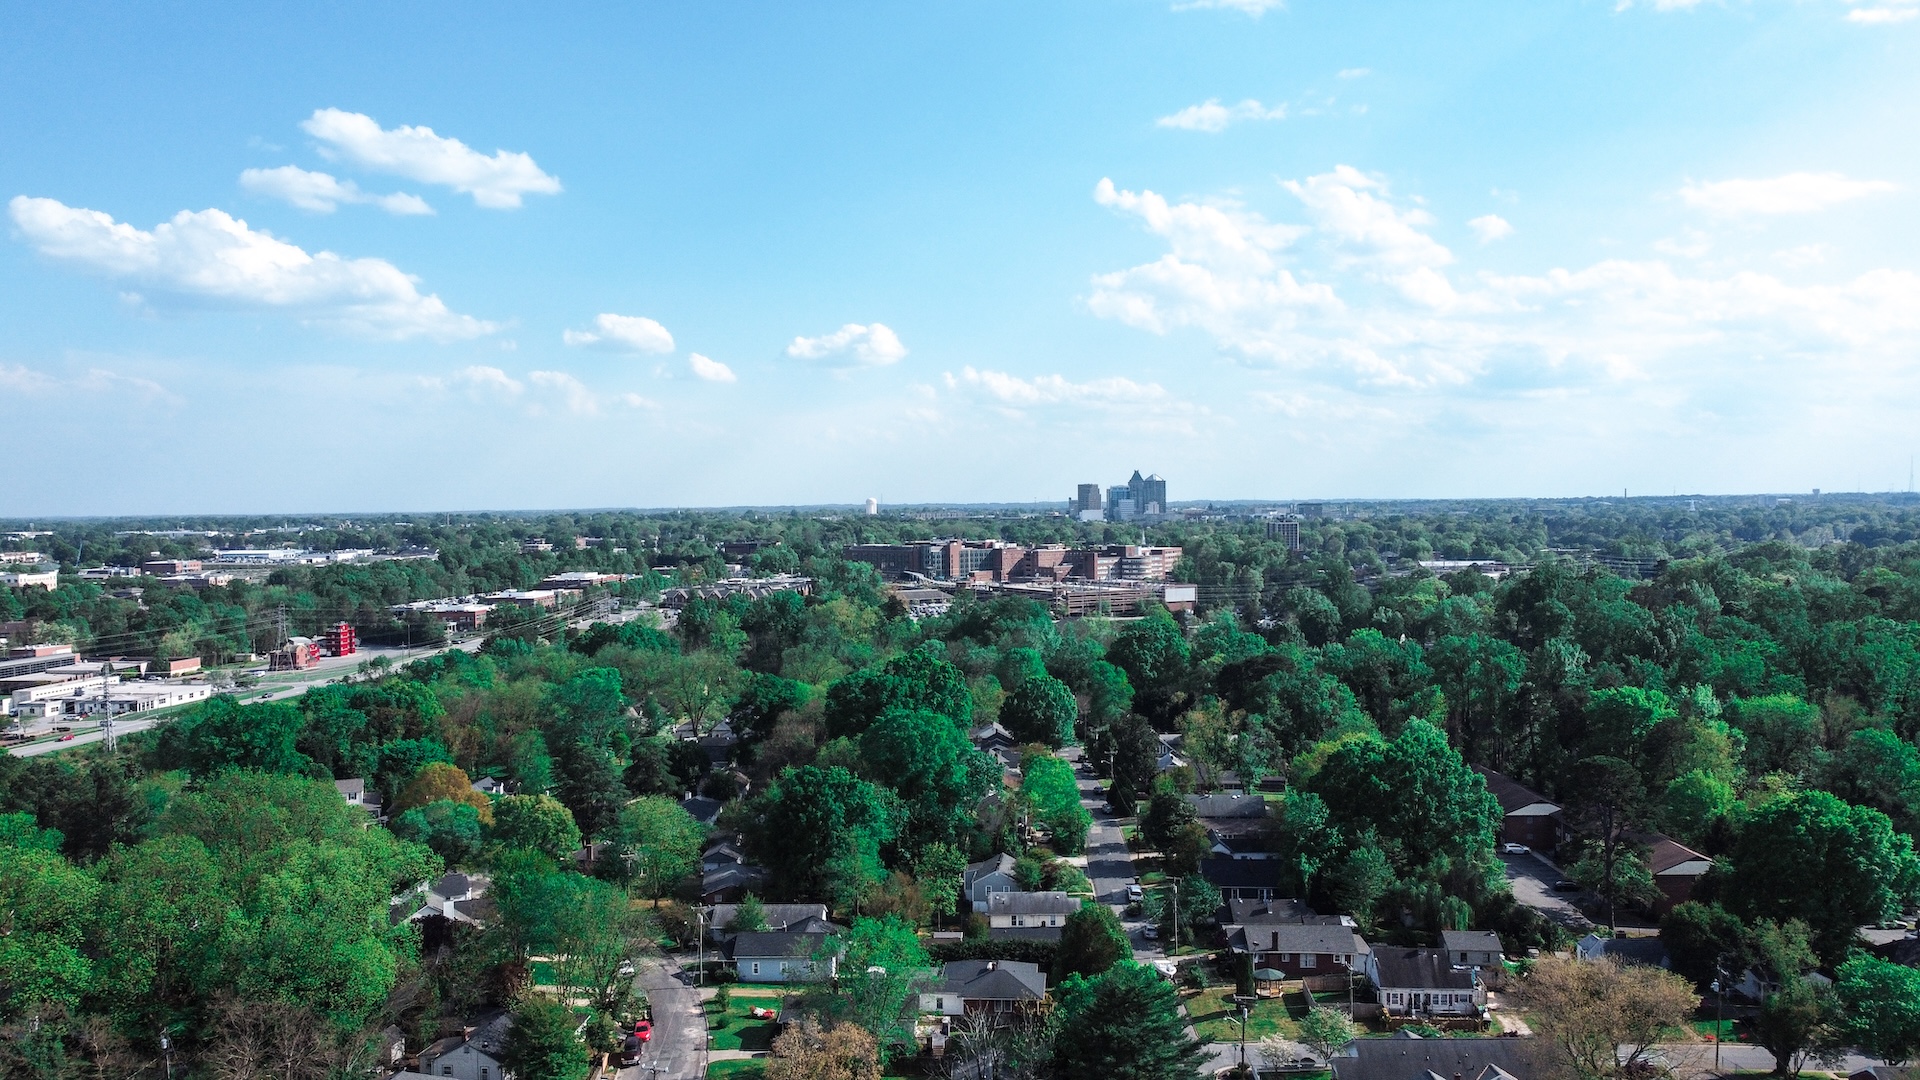
Cities—with their dense buildings, paved surfaces, and limited vegetation—are warming 29 percent faster than the rural areas around them, according to a study of 2,000 international cities from 2022. As noted by the World Health Organization, higher temperatures can intensify health risks, such as heat-related illness, and contribute to poor air quality—especially in low-income neighborhoods, where there are fewer trees and green spaces.
One way to combat the dangers of rising temperatures is to plant more trees. In cities, a healthy tree canopy can cool local air by up to 10 degrees Fahrenheit compared to exposed, paved areas, notes the Arbor Day Foundation.
To guide strategic tree planting aimed at cooling overexposed areas, the City of Greensboro, North Carolina, introduced the Tree Canopy Assessment and Priority Planting Program. The city aims to maintain 40 percent tree canopy coverage, meaning that nearly half of the city is shaded or covered by tree crowns. The program collects community data, such as where trees are planted and where more are needed, to inform future policy recommendations. The program also delivers education to the community.
“The primary goal was to map the tree canopy, determine where the gaps in the canopy exist, and [locate] the best places to plant trees based on the needs of the most vulnerable parts of the city,” explains John Hendricks, GIS analyst for the City of Greensboro.
City officials teamed up with several organizations—including Esri partners SymGEO and Planning Communities—to assess Greensboro’s existing and historic tree canopy and identify priority areas for planting new trees. The city wanted to develop a solution that would engage residents in reforestation efforts and make information accessible to the public.
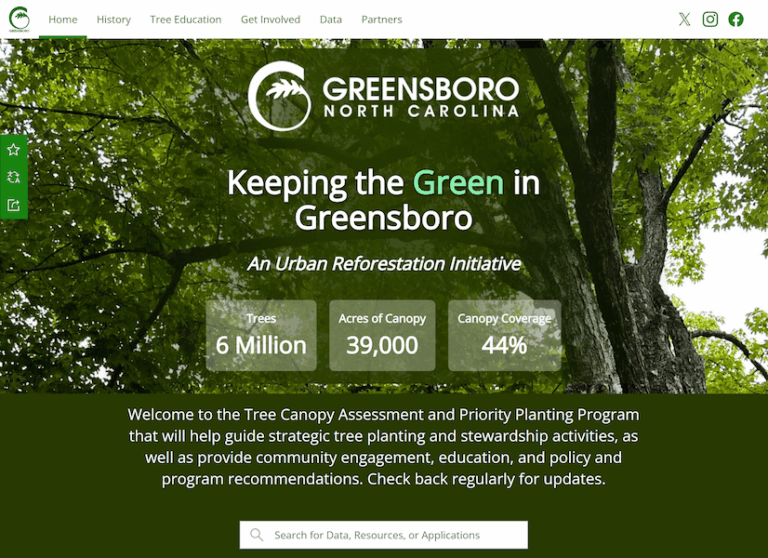
Using ArcGIS Hub as the foundation for the project, the project team brought together ArcGIS StoryMaps, ArcGIS Dashboards, and ArcGIS Survey123 in an interactive, public-facing platform that lets users explore the city’s urban forest. The maps, educational resources, and dashboards on the hub site help residents understand the benefits of a healthy tree canopy and stay up to date on the program’s progress.
Tree Canopy Assessment
To start the project, SymGEO led a comprehensive tree canopy study to determine how much of the city is covered by canopy. The city received a federal grant to conduct the study and, later, create educational programs about the importance of tree canopies.
The SymGEO team used forest inventory analysis methods to extrapolate data from more than 5,000 trees across the city to estimate Greensboro’s canopy coverage. This technique collects and analyzes data on the condition, quantity, and health of vegetation and trees.
SymGEO then used the ArcGIS Image Analyst extension in ArcGIS Pro to run a deep learning model that automatically identified tree cover in high-resolution aerial and satellite imagery from the National Agriculture Imagery Program. The model provided accurate, comparable results that showed what percentage of Greensboro is covered by tree leaves, branches, and stems when viewed from above.
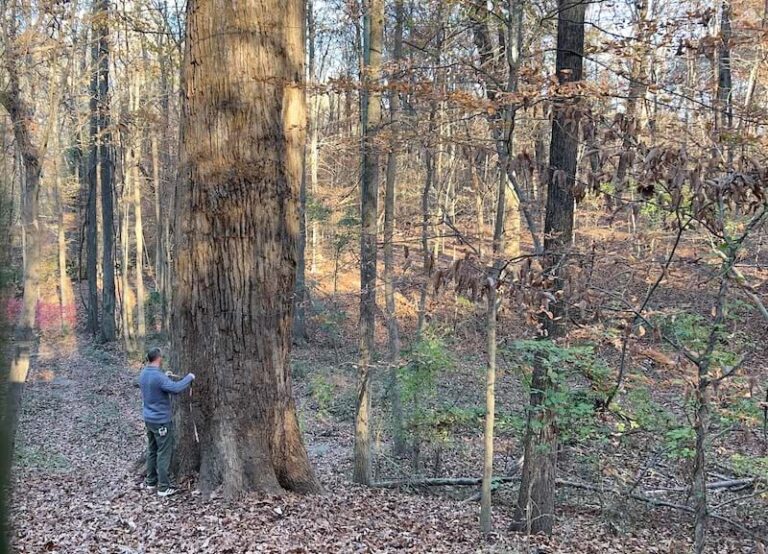
Once SymGEO confirmed the city’s tree canopy extents, the project team combined this information with other data to estimate the total number of trees across the city. This data also helped the team assess how the canopy changed over time and gauge whether measures taken in the past have increased or decreased the tree canopy.
From there, the SymGEO team used the i-Tree Eco app to calculate which tree species and planting locations would benefit the environment the most. Planning Communities also used the study to conduct a tree canopy and vulnerability assessment. Looking at a range of socioeconomic and environmental issues—such as various communities’ resilience in coping with environmental impacts and how various tree species are affected by environmental conditions—the SymGEO team helped identify priority areas for tree planting and stewardship.
The results of this detailed analysis are presented through interactive dashboards and ArcGIS StoryMaps stories on the hub site.
A Community Engagement Hub
Educating residents about the initiative and progress made on tree planting was a key part of the project. The team—which included the City of Greensboro; SymGEO; Planning Communities; and, for this part of the project, Breece Robertson Consulting—worked together to ensure that the hub site served as a central place to get information.
“The hub site offered a great way to educate the public about the project, the importance of the canopy, and its long history in the city,” says Hendricks. “It enabled us to present the canopy and planting location data in a very straightforward and meaningful way.”
By combining interactive tools such as ArcGIS StoryMaps and ArcGIS Dashboards in a single site, residents and city staff can explore the assessment, understand its findings, and access program resources without having to navigate multiple applications.
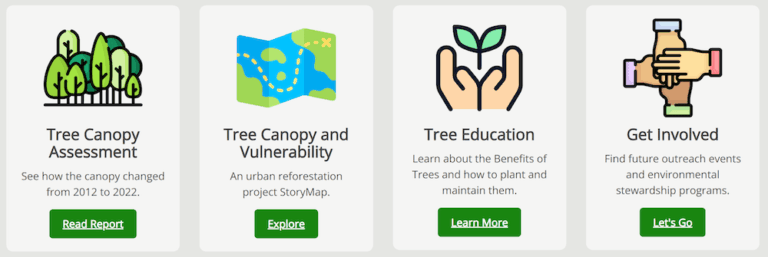
ArcGIS Hub supports easy updates. Using drag-and-drop building blocks called cards, city staff can add new pages that contains anything from a new dashboard to a YouTube video. Cards can point users to different experiences within the hub site, or to social media pages.
“ArcGIS Hub provided the ideal platform because the project wasn’t just about publishing maps,” says Kevin McMaster, principal at SymGEO. “It was about creating a single destination where city staff, residents, nonprofits, and community partners could access information, explore data, and participate in Greensboro’s urban forestry efforts.”
An Inside Look at the Site
Project partners worked together to identify the information that would be most valuable on the site, such as the benefits a robust tree canopy brings to residents. Planning Communities created an ArcGIS StoryMaps story to explain the tree canopy assessment and its results. The story includes an overview of the project, key findings, web maps, photos, links to dashboards, and tree canopy information.
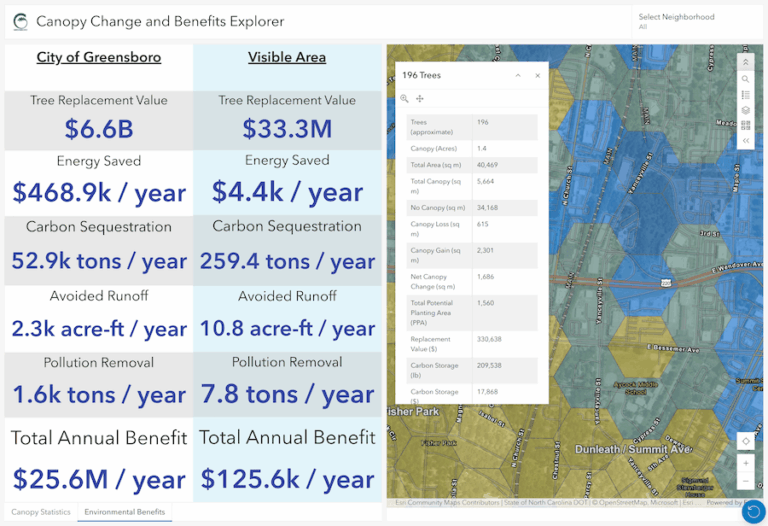
The interactive dashboards on the site allow visitors to explore canopy statistics, environmental benefits, and historic canopy change via maps and charts. Users can also view priority planting areas, canopy deficits, and neighborhoods where investments will have the greatest impact.
An ArcGIS Survey123 form was created for residents to report newly planted trees as well as existing ones to help map trees in the city and encourage residents to participate in the program. By leveraging GIS technology, Greensboro is not only improving urban forestry decision-making but also empowering residents to actively shape the city’s green future.
“Creating a place for [residents] to interact with their data in a useful way was a high priority for this project,” Hendricks says. “Every Hub element and dashboard was designed to get the residents to understand how the canopy impacts their house, their neighborhood, and the city as a whole.”
Planning for a Greener Future
The public response to the new hub site, Keeping the Green in Greensboro, has been positive, and the site has garnered several thousand views since it launched in late 2025. It offers access to every canopy assessment report completed since the year 2000 as well as educational resources and future planning information—all in one place.
City staff manage the platform and can easily make updates to information such as the resources or planning documents. In addition, the dashboard data can be updated as new information is available on canopy gains or losses, helping track progress over time. This means Greensboro residents are receiving the latest information available.
“The hub site has shown city leaders a different way to communicate with [residents],” says Hendricks. “It provided a great avenue to . . . show the residents that the city can be modern and nimble, but also present important data in an engaging way.”
McMaster believes any city can move beyond static reports and create living resources that support planning and funding decisions. He says the project team’s approach helped make complex environmental data understandable and actionable, and the use of Esri technology means the solution is scalable for communities of all sizes.
“We believe the greatest value of GIS comes when complex analysis is translated into tools that support better decisions and meaningful public engagement,” says McMaster.