The Esri Maps for Public Policy App Enables Collaboration and Drives Fact-Based Decision-Making
The new Maps for Public Policy web app from Esri provides free access to preauthored policy maps, allowing anyone to interactively explore various issues that communities face today. The app, announced by Esri president Jack Dangermond at the National League of Cities (NLC) City Summit in November 2018, is a bipartisan resource that is designed to help policy makers and citizens make fact-based decisions.
The policy maps featured in the app make data easier to understand. They highlight potential opportunities for users to get involved in and influence social initiatives, fostering not only awareness but also civic engagement. The app gives users ready-to-use location intelligence and express access to policy maps, so they can skip the steps of obtaining and preparing the data.
Expediting the process of visualizing community data was a key driver for Esri to create this free app.
“Maps are something that people use to quickly understand and fathom the dimensions of situations,” Dangermond said during his announcement at the NLC City Summit. “We appreciate the opportunity to support people with technology—not to go to the right or go to the left, but to go forward with data-driven policy.”
Esri Maps for Public Policy is powered by the extensive portfolio of authoritative data available in ArcGIS Living Atlas of the World, the foremost collection of geographic information from around the globe. The data layers are living, meaning that they’re regularly updated for accuracy and curated for quality. Every time the data layers in the Living Atlas get updated, the maps in the app get updated as well. There are datasets on demographics, infrastructure, gross domestic product, and the environment that come from sources including the American Community Survey (ACS), the US Census Bureau, and the US Department of Housing and Urban Development (HUD). A team of Esri geographers preauthored the app’s policy maps, performing analysis on high-priority social, economic, health, infrastructure, sustainability, and environmental issues to furnish a collection of useful data that is relevant to today’s changing political environs.
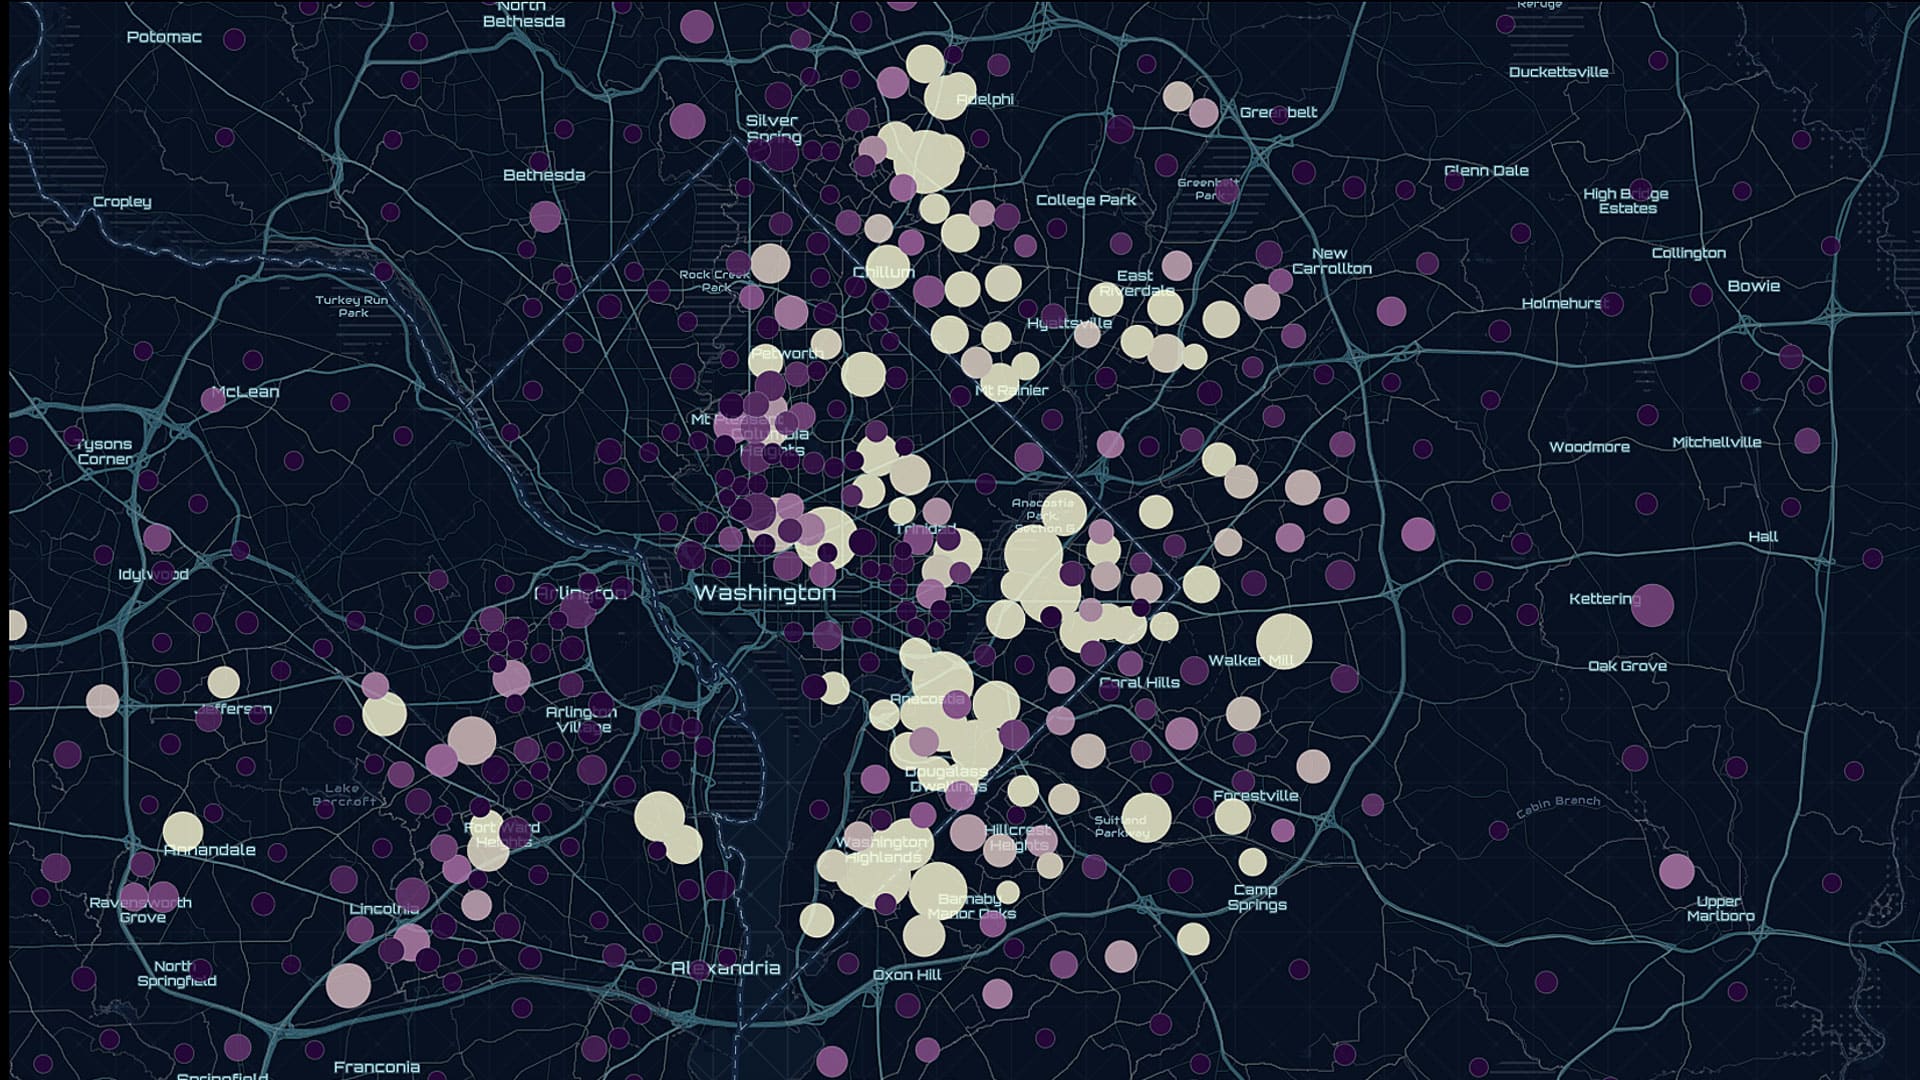
To explore this collection of preauthored policy maps, users can open the app in a web browser, select a location of interest, and choose a topic to examine: population, housing, or education. A collection of map cards then appears, which users can search and filter. Anyone can personalize the app by adding or removing cards while browsing the more than 400 available maps. When users select a card, the data populates ready-to-use maps of the selected location. Users can then click on the map to see popups with additional information.
Esri Maps for Public Policy offers users the opportunity to investigate data at the local, state, and national levels so they can better understand how location impacts policy. The app includes data on social equity and health, economic opportunity, transportation and infrastructure, resilience and sustainability, the environment and natural resources, and public safety. By exploring this data, policy makers and citizens can work together to tackle numerous issues facing their communities.
Here are some resourceful ways to use the Maps for Public Policy app.
Build a Healthy Community
Understand how geography affects people’s access to health care and mental health clinics. View drug poisoning or overdose mortality rates, drug drop-off locators, and opioid prescription claims. Take a look at the Environmental Protection Agency (EPA) National Air Toxics Assessment and develop a greater understanding of how poor air quality affects public health.
Promote Equal Opportunity
Browse neighborhoods by housing affordability and compare this to homeownership and homelessness rates. Visualize how diversity, race, gender, age, and educational attainment affect income levels. Research areas where poverty persists and see the risks and opportunities for improvement in neighborhoods below the poverty line.
Plan Eco-Friendly Developments
View the US census tracts that have been identified as certified economic opportunity zones. Analyze national foreclosure rates to discover demographic variations. Look for areas that would be ideal for implementing green infrastructure, get a better understanding of conservation land use, and learn about ecological integrity.
Design Cities That Work
Find the best route for your morning commute. Analyze daytime population and traffic patterns to see how cities can design better infrastructure. Learn how job accessibility is being transformed by public transit, teleworking, and hypercommuters (people who spend more than 90 minutes traveling to work).
Address Public Safety
Plan efforts to overcome environmental hazards by looking at areas that are vulnerable to wildfires and by surveying patterns of human movement during a hurricane. View the national firearm fatality and drug poisoning rates to decipher how crime takes a toll on communities.
For some, Esri Maps for Public Policy can be a starting point for doing further analysis and executing more comprehensive GIS projects. Within the app, the title of each card links to the map source in ArcGIS Online. Current ArcGIS Online users can log in and open the preauthored policy map layers to perform their own research and explore. Users can add additional Living Atlas layers to the policy map or import other community data to support specific causes.
The app’s sharing capabilities make it easy to collaborate. After users have collected their maps of interest, they can simply click the Share icon in the upper right-hand corner of each map. Options for sharing include email, Twitter, and Facebook. Anyone who receives the link can then view the collection of maps as the sharer intended them to be seen, eliminating the need for users to re-create the same map and collection experience during each app session.
Esri Maps for Public Policy helps people use maps for community impact and, if needed, take action. Together, everyone can move forward with facts.