
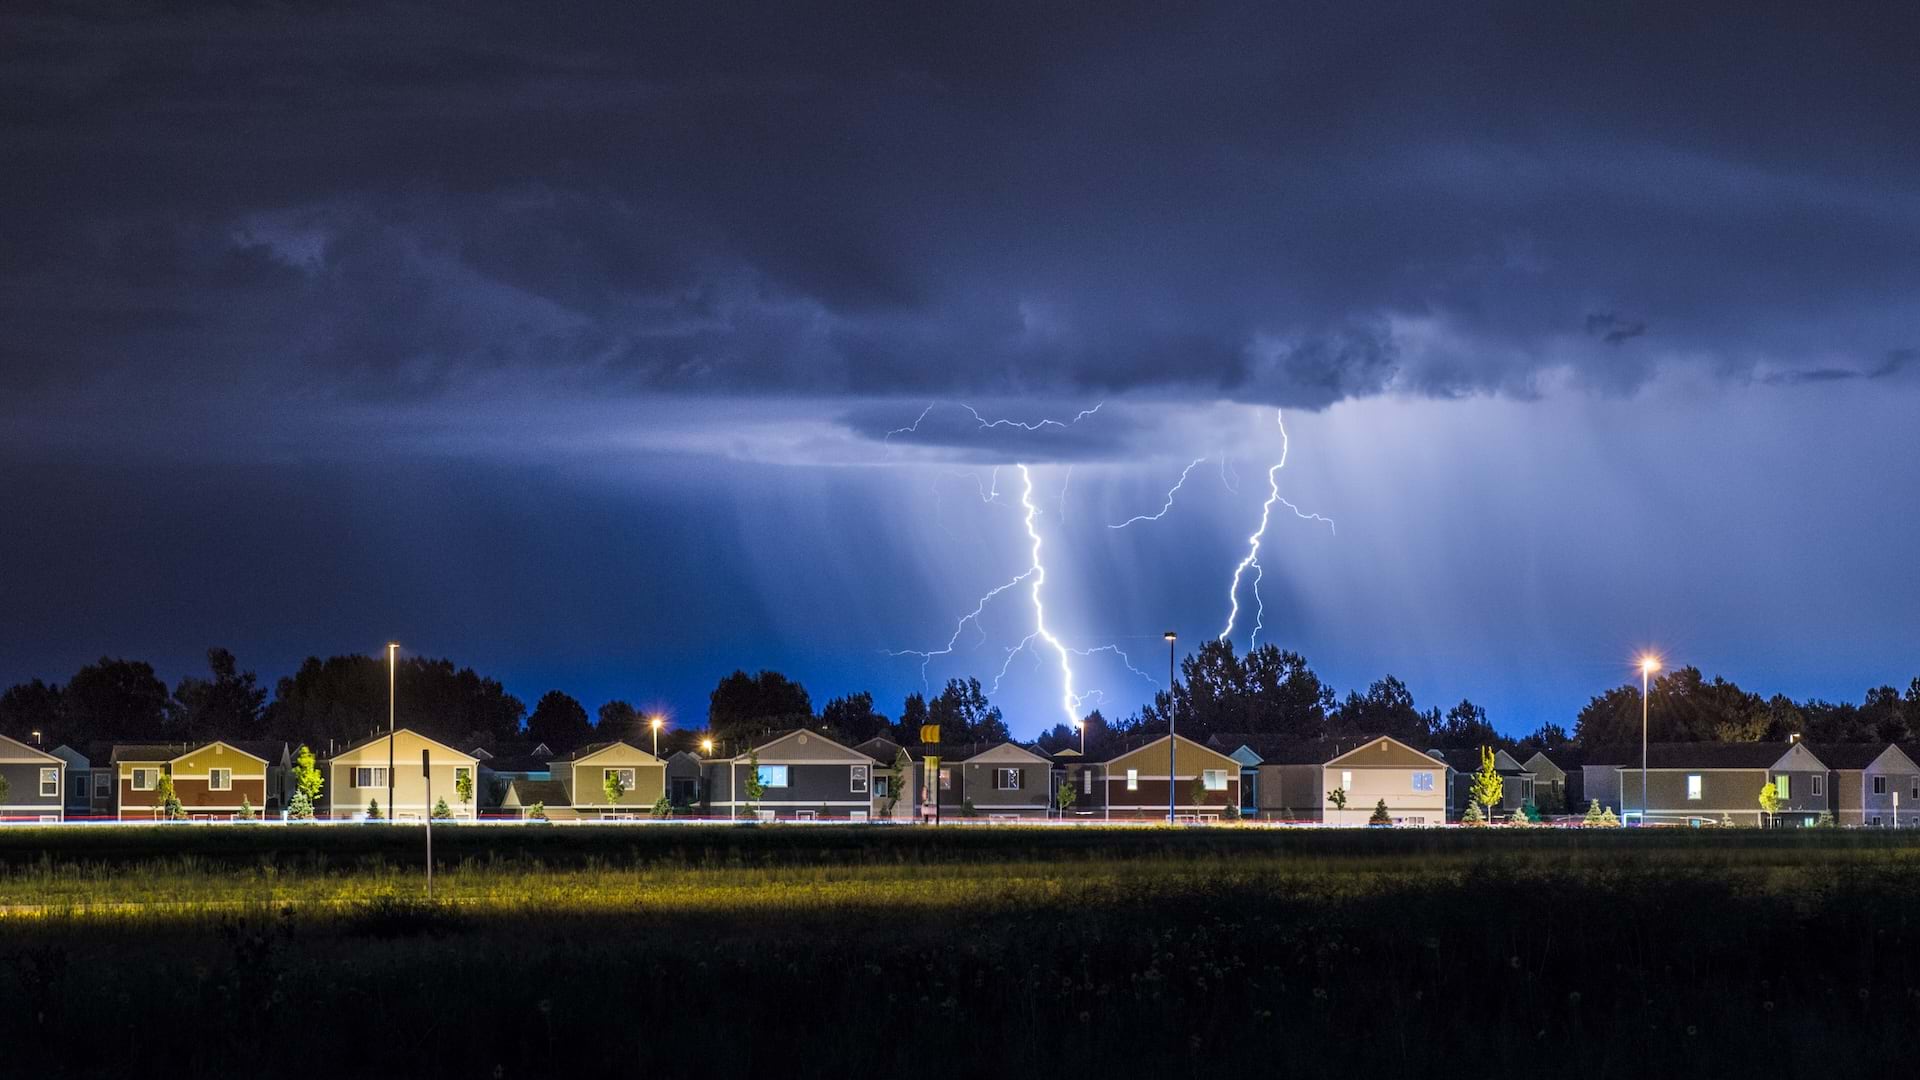
When a hurricane or cyclone churns toward the state of Rhode Island, local emergency managers need to know more than where the storm will hit. They need to understand which backup generators could flood; which wastewater facilities may lose power; and which critical assets, such as electrical transformers and health facilities, face the greatest risk.
The University of Rhode Island’s Coastal Hazards, Analysis, Modeling and Prediction (CHAMP) system answers these questions precisely, delivering real-time forecasts that pinpoint specific infrastructure vulnerabilities days before a storm makes landfall. Built on GIS technology such as ArcGIS Pro, ArcGIS Enterprise, and ArcGIS Online, CHAMP transforms complex storm surge models into actionable intelligence for emergency responders across southern New England.

GIS Technology as the Integration Point
Four days before a hurricane threatens Rhode Island’s coast, a conversation begins. Emergency managers and University of Rhode Island researchers activate the CHAMP system. For 96 hours prior to the storm’s landfall, it will deliver increasingly precise forecasts of where storm surge will strike and what infrastructure the surge will affect.
Austin Becker, professor and chair of the university’s Department of Marine Affairs and director of its Marine Affairs Coastal Resilience Lab, leads a team of about 10 people who developed CHAMP in partnership with Rhode Island’s emergency management agency. The CHAMP team includes experts from the university’s Department of Ocean Engineering and Environmental Data Center as well as from a federally funded research, education, and community engagement program called Rhode Island Sea Grant.
Starting in 2014, Becker and Isaac Ginis, a University of Rhode Island professor of oceanography and an expert in hurricane modeling, set out to make scientific storm models more accessible to emergency managers. This is what CHAMP does, Becker says. It brings together critical information about specific assets on the ground, such as backup generators, electrical transformers, or HVAC units, and shows how they could be affected at different stages of the storm.
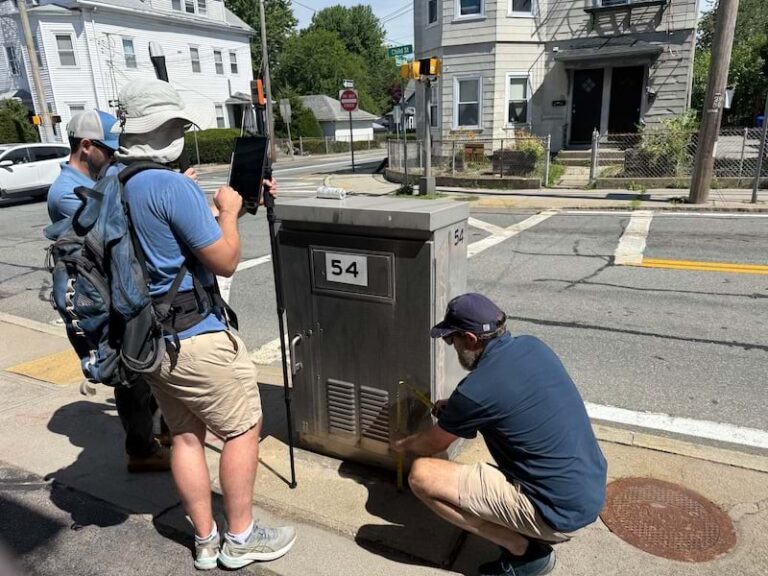
For each asset, researchers have recorded its precise location, measured the flood level at which damage would occur, photographed the site, and documented what facility managers indicated would happen if flooding reached that point. During a storm, these managers provide updates using ArcGIS Survey123.
When emergency managers activate CHAMP, researchers run a tool—a model called ADCIRC (short for advanced circulation)—on supercomputers, generating flood forecasts for the entire region. Staff at the university’s Environmental Data Center process those model outputs using GIS technology, comparing predicted flood levels against the database of hazard consequence thresholds—the points at which damage is expected from wind or flooding—along with descriptions of those consequences from a subject matter expert.
The comparison process is straightforward but powerful. For example, an electrical transformer may be located 3.28 feet off the ground; if forecasting indicates flooding is likely to exceed that height, the system flags that asset as at-risk.
Less than two hours after the model completes, emergency managers use a dashboard created with ArcGIS Dashboards. On the dashboard, they can see which facilities and assets face threats, along with details such as vulnerability levels, projected wave height, and asset classifications. CHAMP dashboards update twice daily as storms approach, and researchers host webinars for emergency response managers to explain the model’s outputs and address questions.
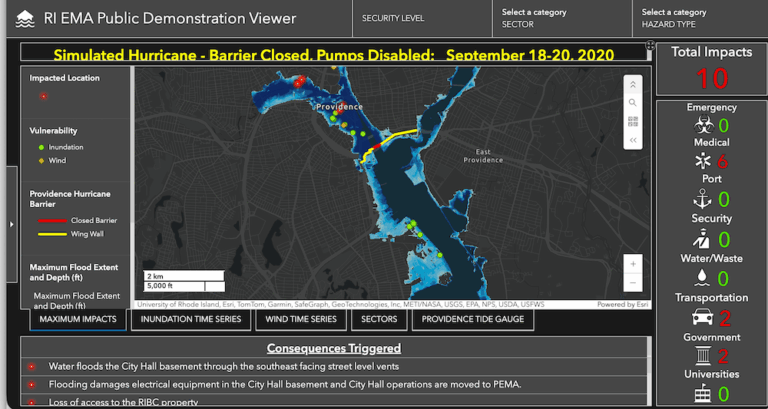
The system uses ArcGIS Pro for data management and to generate customized PDF report templates that summarize predicted storm impacts, flood depths, and consequence threshold breaches. Emergency managers can use these reports for briefings and operational planning. ArcGIS Enterprise supports the development and management of the secure Infrastructure Asset Consequence Thresholds database, storing field-collected vulnerability data and integrating it with ADCIRC model outputs. And ArcGIS Online serves as the public-facing front end, hosting the interactive dashboards made with ArcGIS Dashboards, where emergency managers view active storm forecasts, explore hazard layers, and download impact reports. Security settings help ensure that sensitive infrastructure data is visible only to authorized users.
Building Intelligence from the Ground Up
The system became fully operational in 2021, when it provided its first real-time forecasts for Tropical Storm Henri. Rhode Island emergency managers have activated CHAMP two or three times annually during storms. The system’s power lies in its integration of two distinct data sources: high-resolution storm wind and flooding forecasts, and detailed infrastructure vulnerability assessments. Additionally, the ADCIRC model provides local coastal flooding predictions based on storm characteristics from the National Hurricane Center.
Vulnerability assessments include hundreds of these consequence thresholds, which researchers have collected from site visits of infrastructure facilities in the state. These assessments also include the specific flood or wind conditions that could trigger damage or operational disruptions.
The Rhode Island Geographic Information System, the state’s designated GIS dataset clearinghouse, maintains more than 300 statewide open-source web, feature, and image services, managed in cooperation with technical GIS experts from the university’s Geospatial Extension Program and the URI Environmental Data Center’s GIS lab. This statewide data infrastructure is the same foundation that CHAMP draws on to locate and display critical assets on its dashboards, providing the basemap layers and data services that make rapid visualization possible during a storm.
Data accuracy is critical when using the CHAMP tool for disaster response. Researchers validate CHAMP water-level predictions by using flood images that Rhode Island residents upload to a platform called MyCoast following storm events. Researchers also evaluate CHAMP’s accuracy by comparing model predictions with observations from the US National Oceanic and Atmospheric Administration’s tide gauges and wave buoys.
Impact Beyond State Coastal Areas and Around the US
Various municipal agencies use CHAMP’s scenario-planning capabilities to identify vulnerabilities and justify resilience investments. For example, the Rhode Island Department of Environmental Management assessed wastewater treatment facilities statewide, and managers used CHAMP data to apply for grants to make improvements to pump stations.
CHAMP’s value has drawn interest beyond Rhode Island’s borders. It has been adapted as a pilot program for Connecticut’s Department of Energy and Environmental Protection, with a 2024–2025 demonstration project focused on the cities of New London and Groton—chosen for their critical port infrastructure and regional transportation networks. The pilot program aims to build a consequence threshold database and storm modeling dashboard to support resilience planning, with an eventual transition to real-time emergency operations.
A separate pilot program is under development for the US Coast Guard units covering southeastern New England and parts of Long Island Sound. That implementation focuses on maintaining operational readiness of Coast Guard facilities, predicting impacts such as server room flooding that could knock out communications across an entire sector and helping Coast Guard commanders allocate resources ahead of approaching storms.
CHAMP represents one component of the Rhode Island Natural Hazards Tools Collaborative broader resilience toolkit. Another, called STORMTOOLS, provides probabilistic flood forecasting for long-term planning, showing what 100- or 500-year storms might look like with expected sea level rise. The MyCoast platform enables community scientists to upload flood photos, creating a crowdsourced database that validates models. And a program called Network for Environmental Sensing and Technology (NEST), led by Brown University, deploys real-time flood sensors across the state.
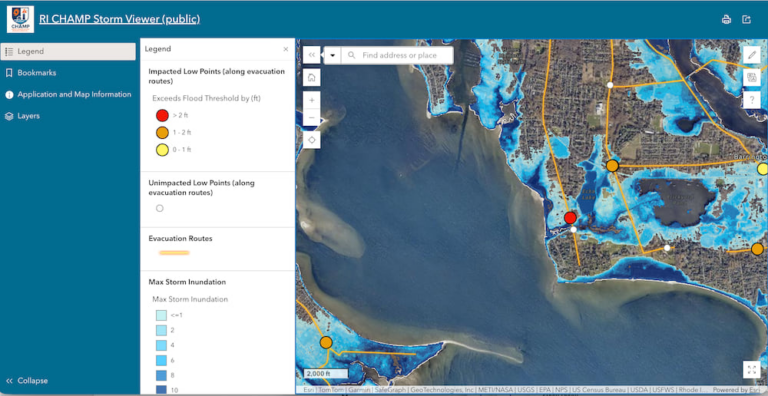
Each tool serves distinct purposes, such as emergency response, long-term planning, public engagement, and real-time monitoring. Looking forward, the CHAMP team is working to integrate inland flood models with ocean storm surge predictions, helping to broaden the technology’s use beyond the state’s coastal areas.
For Becker, the dashboards, models, and databases are ultimately in service of a single goal: giving regional emergency managers the clearest possible picture before a storm arrives. Keeping the next major hurricane in mind, he says the scale of CHAMP’s impact will ultimately be measured when future storms strike.
“It’s going to be a really great tool to have when there’s a [dangerous] storm coming,” Becker says. “I think it will prove its value in spades.”
For more information, contact Austin Becker abecker@uri.edu or Charles LaBash at labashc@uri.edu.