
As one colorful poster in the San Diego Convention Center noted, “It has been 2 years, 11 months, and 29 days since we’ve been together,” referring to members of the geospatial community who attend the Esri User Conference (Esri UC). “We are happy you are here.”
In fact, it seemed that everyone who attended the Esri UC in person in San Diego, California, July 11–15 was happy to be there.
“There are so many geospatial professionals doing impressive work, solving big problems, and telling fantastic stories,” said Katie Wheatley, senior GIS analyst for EA Engineering, Science, and Technology, Inc., PBC. “To be able to see what others are doing with the software and technology and meet new people has been more beneficial than I imagined it would be.”
Esri president Jack Dangermond was overcome with emotion when he welcomed the nearly 15,000 in-person attendees and more than 16,000 virtual participants to the Plenary Session. While attendees come from all over the world, speak different languages, and work in various disciplines, Dangermond noted that everyone at the Esri UC approaches problem-solving from a common angle: geographically.
“The world that we are living in is changing rapidly, increasingly dominated by the human footprint,” Dangermond said, referring to challenges such as pollution, wildfires, food shortages, and a steep decline in biodiversity.

But by bringing people, ideas, and data together—by Mapping Common Ground, the theme of this year’s Esri UC—Dangermond believes that geospatial professionals can create understanding and find solutions. And the speed at which geospatial technology is advancing means that GIS professionals will have profound effects on the way civilization evolves.
Throughout the Plenary Session, audience members got to see Esri staff present new products such as ArcGIS Knowledge, which employs graph analytics to map relationships among datasets, and ArcGIS GeoAnalytics Engine, which brings GIS software to where big data is stored. And attendees greeted many updates to ArcGIS Pro—including dynamic feature clustering and new animated symbols—with enthusiasm.
The user presentations, however, truly showed how innovative the GIS community can be when grappling with challenging problems. Taken together, the presentations demonstrate the widespread impacts that maps and the geospatial community have on people, places, animals, and ecosystems.
“What you do and how you do it matters. No one else understands things like you do or is equipped to provide the solutions you can,” Dangermond told the audience. “You are being called upon at this most critical point in human civilization to provide the language, methods, and infrastructure for helping the world find common ground.”
A New Dimension for a Fast-Growing City
Over the next eight years, more than 40,000 people are expected to move to Sioux Falls, South Dakota. The city wants to ensure a sustainable growth, so its civic analytics team has been experimenting with cutting-edge GIS, like using reality capture technology with 3D GIS.
After developing a 3D mesh of Sioux Falls, the civic analytics team created a 3D parcel finder for residents to use. This is particularly helpful for visualizing condo parcels.
“In 3D, we can see each condo parcel’s shape and location and quickly identify its parcel information,” said Lauri Sohl, civic analytics manager for the City of Sioux Falls.
To plan the future of Sioux Falls, the civic analytics team is employing ArcGIS Urban. It lets city officials view new development plans in context as web scenes. According to Christopher Anderson, a civic analytics specialist for Sioux Falls, this allows the city to identify “poor street connectivity or zoning transitions and see how the proposals fit in around existing housing and facilities.”
Austin Brynjulson, another civic analytics specialist for the city, illustrated how the team is working with the fire department to enhance public safety by using the 3D mesh for preincident planning.
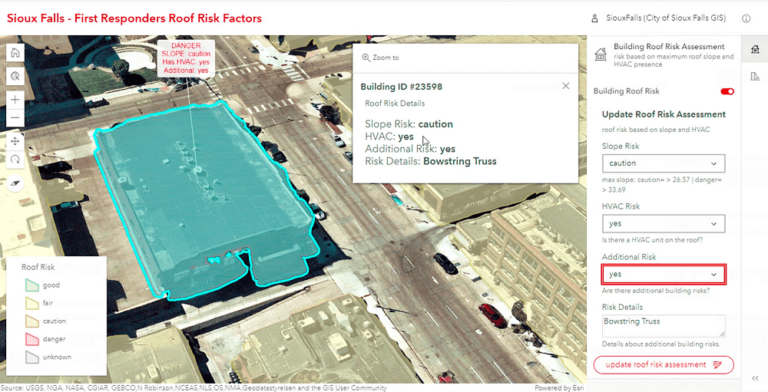
“They were immediately drawn to the detail of the building rooftops, pointing out all the dangerous features,” Brynjulson said about the firefighters. So the civic analytics team built an app that shows the overall risk of rooftops.
The City of Sioux Falls also employs its 3D mesh during winter storms to keep residents abreast of road plowing operations.
“This team is making it easy and efficient to use data as we tackle the challenges and opportunities of a growing city [and] create a better future for our residents,” said Sioux Falls mayor Paul TenHaken in a video message.
DOT Builds Common Ground with Hub Technology
The Massachusetts Department of Transportation (MassDOT) manages 36 regional airports, 18 transit stations, more than 300 miles of transit lines, 37,500 lane miles of roadway, and pedestrian and bike paths that traverse more than 14,000 miles of the state.
“For us, GeoDOT—our ArcGIS Online organization—is the foundation of what we do,” said José Simo, MassDOT’s GIS outreach coordinator. “It’s where we provide access to data [and] dashboards and build focused solutions for our users.”
GeoDOT Local is a site created using ArcGIS Hub that MassDOT’s GIS team built to increase the state’s collaboration with municipal partners.
“It brings together datasets, viewers, and easy-to-use tools designed for cities and towns,” explained Carl Hughes, GIS lead developer for MassDOT.
For example, municipalities can use the Road Inventory Submission Application (RISA) within GeoDOT Local to update the data on roads in their jurisdictions, and MassDOT automatically sees the proposed changes in its database. Municipal employees can also use the Massachusetts Project Intake Tool, or MaPIT, to launch projects digitally.
“Previously, municipalities initiated projects using paper forms and manual processes. This often resulted in the need for resubmissions for the same projects,” which wasted time and taxpayer dollars, said Hughes. “With MaPIT, project initiation has gone from months to days.”
MaPIT leverages ArcGIS Web AppBuilder; ArcGIS Enterprise; ArcGIS Roads and Highways, which hosts MassDOT’s linear referencing system; and the department’s internal reference system for projects.
To ensure that MassDOT is distributing project funds equitably, a dashboard within GeoDOT Local provides a geographic view of infrastructure investments based on how many roadway miles cities and towns own and where people live and work. A related tool called Engage enables MassDOT to understand each community’s unique characteristics and ensure compliance with civil rights codes and environmental justice responsibilities.
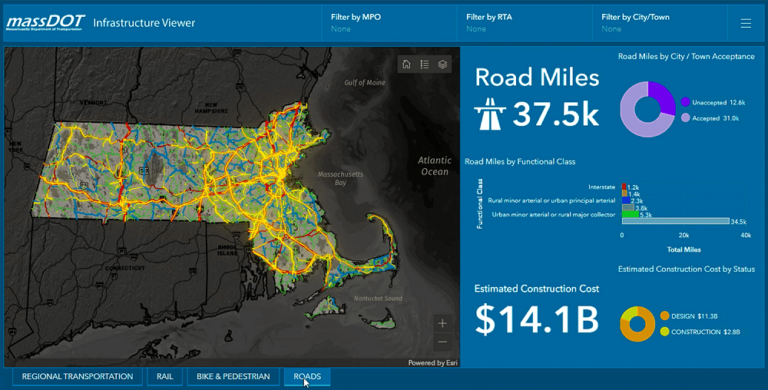
“The positive response to our GeoDOT Local collaboration strategy has been really exciting,” said Hughes. “Over 85 percent of municipalities are now participating, and the equitable distribution of infrastructure funding has improved dramatically.”
ArcGIS Utility Network Sparks Transformation
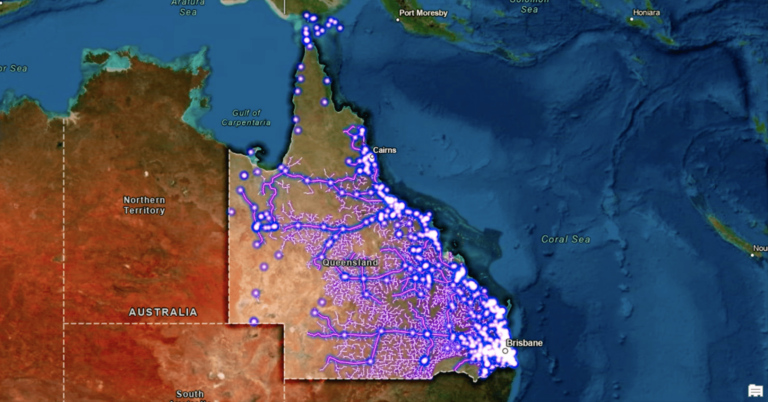
Energy Queensland in Australia maintains 153,000 substations and nearly 130,000 miles of connecting power lines while serving more than 5.2 million customers and supporting over 3,500 mobile workers. To keep the lights on for such a vast operation, efficiency is key.
That is why the electricity provider has undertaken a digital transformation that allows it to operate more quickly and comprehensively and gain a better understanding of its customers’ needs.
“We took our legacy GIS data and, using [the] ArcGIS Utility Network model, modernized our electrical and communications network,” said Shannon Connolly, GIS delivery executive for Energy Queensland.
In practice, this means that the grid can be viewed at any scale, from the whole distribution network to individual meters. The data can also be viewed in 3D, allowing users to locate and edit assets quickly and easily.
In addition, Utility Network enables staff at Energy Queensland to trace the grid from energy sources, such as solar farms, to customer service points. This is particularly useful for mobile crews who see this information in real time with ArcGIS Field Maps when responding to outages and maintenance requests.
GIS also helps Energy Queensland better trace communities’ vulnerabilities to natural disasters, such as bushfires, cyclones, and severe flooding. Energy Queensland can de-energize, inspect, and reenergize specific points on the network as needed during an emergency.
“ArcGIS Utility Network is underpinning our ability to achieve a sustainable and resilient future,” Connolly said.
Engineering Carbon Neutrality
Egis, a French engineering group, conducts infrastructure projects all over the world. One of the company’s goals is to contribute to achieving worldwide carbon neutrality by 2050.
“[We can] do this by designing intelligent cities, smart buildings, resilient infrastructure, and low-carbon solutions,” said Vincent Keller, head of the rail digital engineering department at Egis.
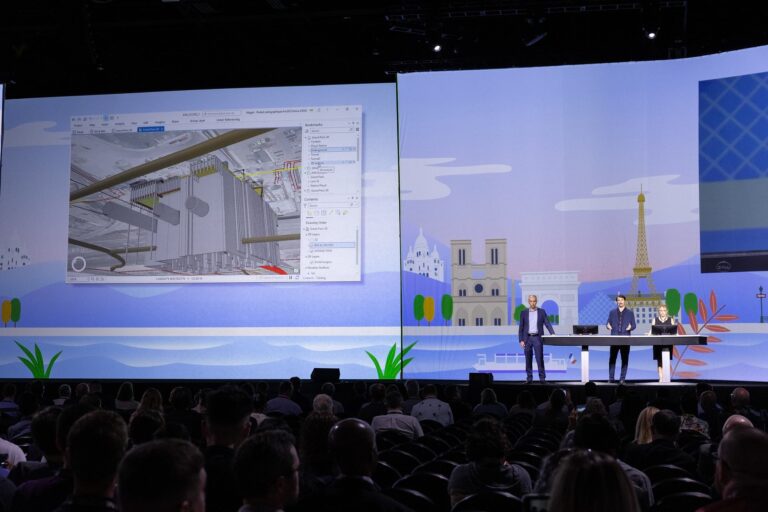
One of Egis’s biggest projects is constructing the Grand Paris Express rapid transit lines, part of a larger effort to revitalize the rail system in Paris, France. The plan is to build nearly 125 miles of underground metro lines between 2024 and 2030, including 68 new stations and 7 new depots. More than 10,000 workers are already involved in the project.
“With ArcGIS, we’ve been able to centralize all the data about existing utilities and buildings,” said Thomas Lesage, Egis’s digital transformation officer.
This allows Egis to use building information modeling (BIM) to visually track possible conflicts, such as whether the construction of a new station would require decommissioning existing services.
To collect data about each construction site, 70 on-site Egis collaborators take geolocated pictures each day and upload them to Field Maps. Clients can view this and other real-time data with ArcGIS Dashboards to track construction progress.
“In this case, the GIS platform becomes the single source of truth that provides potentially all the relevant views and dashboards to make decisions in a short time,” said Keller.
The Egis team has also streamlined management of existing assets and construction projects through ArcGIS and BIM data integration. This helps Egis ensure data continuity not only between construction sites and clients but also between BIM and GIS, boosting efficiency and increasing transparency with stakeholders.
“The project will change the lives of many people,” concluded Keller. “We believe the processes we’ve presented will also change the lives of many project managers.”
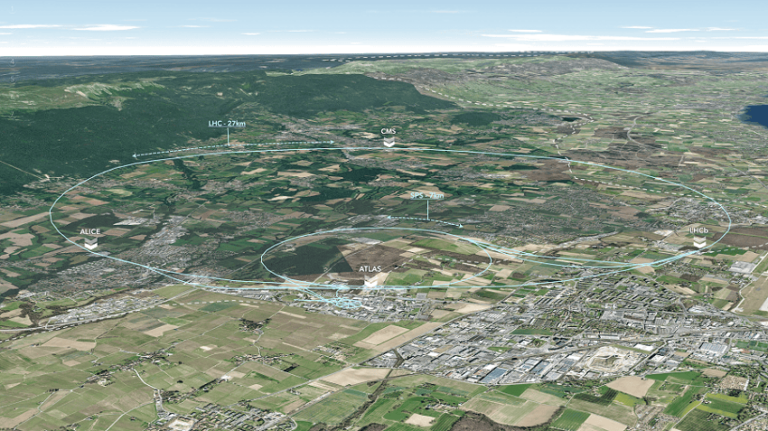
GIS Creates Space for Particle Physics
The European Organization for Nuclear Research (known by its French acronym, CERN), a particle physics research institute in Geneva, Switzerland, is most famous for its Large Hadron Collider (LHC), which sits more than 320 feet below ground and tests the properties of accelerated particles. But CERN houses many other projects as well—along with the scientists who work on them—at 18 sites on 540 acres of land. The complex includes 700 individual buildings that accommodate more than 15,000 workers.
“In a way, CERN is a small city,” noted Youri Robert, team referee for topography and geomatics at CERN.
The geomatic engineering team at CERN is dedicated to making sure this small city runs smoothly, giving people not just a place to work but also space to carry out their projects effectively.
To overhaul what was previously a time-consuming process of organizing floor plans, team members used GIS to build basemaps of the facility and computer-aided design (CAD) files to create indoor layouts. They then converted the indoor CAD plans to a geodatabase format. This provided an easy-to-read display of all the departments in CERN that was also linked to the organization’s human resources database.
The plan eventually went beyond simply mapping space for people to work. The geomatics team ended up integrating data from the team in charge of aligning the 1,600 magnets of the LHC, and this now allows the alignment team to work even when the LHC tunnel is closed.
“Seeing the benefits for asset maintenance, more and more teams requested a layer in the system,” said Nicolas Guilhauden, geomatics engineer at CERN.
Over time, the team mapped more than 300,000 assets on the CERN campus with GIS software, and is currently in the process of integrating ArcGIS Indoors to replace previously used custom tools.
“With Indoors, we are enabling both administrative and technical teams to manage their assets in a common system,” said Guilhauden. “This collaboration at CERN will allow us to face new challenges ahead, like the Future Circular Collider, an ambitious project [aimed at] discovering a new universe of particles.”
A Geographic Approach to Conservation
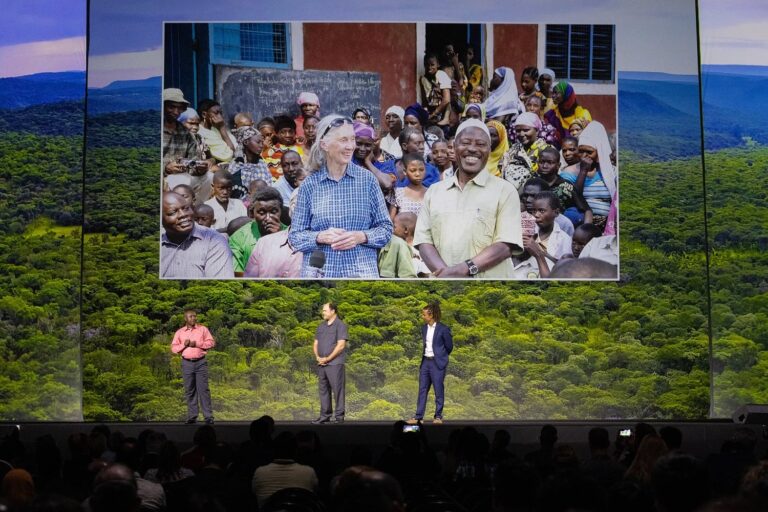
Listening to and working with communities on conservation is at the core of how the Jane Goodall Institute (JGI) helps people meet their own needs while preserving the natural world around them.
“If we don’t help people find ways of living other than destroying their environment, we can’t save chimps’ forests or anything else,” said Dr. Jane Goodall in a prerecorded video played for the Plenary Session audience. She was outlining JGI’s method for holistic conservation—the subject of a forthcoming book from Esri Press. “It just makes all the difference, working with the people [and] listening to what they say.”
By bringing technology like GIS into communities that lack it, JGI enables them to monitor and address the health of their forests. With this approach, “places that were utterly destroyed can once again support the natural world,” said Goodall.
Three presenters took the stage on behalf of JGI to demonstrate Goodall’s vision: Japhet Jonas Mwanang’ombe, national coordinator of Roots & Shoots Tanzania; Dr. Lilian Pintea, JGI’s vice president of conservation science; and Merlin van Lawick, communications associate for JGI.
Mwanang’ombe detailed how, by using JGI’s Tacare approach to conservation, one Tanzanian community replaced an invasive eucalyptus species that was stressing its water supply with native plants.
“My goal is to make sure we try to recover what we have lost,” said Mwanang’ombe. “Mapping is helping us to document not only what scenarios exist today but also the future of what we want to have.”
JGI also uses satellite imagery to help communities fight deforestation. The bird’s-eye view allows community members to connect the emotional reality of deforestation to the tangible work they need to do to restore the land to health.
“Mapping common ground allowed us to develop a common language [and] a common understanding, and it helped develop trust between us as true partners in conservation,” said Pintea.
It’s important that this work continue far into the future, noted van Lawick, who is Goodall’s grandson. “Sharing common ground,” he emphasized, “is one of the only hopes that we have for our generations to create a sustainable future.”
A Climate of Geospatial Collaboration
Climate change was a big topic at this year’s Esri UC. Special guests and keynote speakers underscored the valuable work that geospatial practitioners already—and must continue to—do to ameliorate the effects of a changing climate and spur humans to modify their behavior.
David J. Hayes, special assistant to the president for climate policy at the White House, introduced the audience to a new climate resilience portal that Esri and the federal government are building. In line with goals in President Joseph R. Biden’s climate agenda, it will enable federal agencies to develop and share information about climate change more easily.
Wade Crowfoot, secretary of the California Natural Resources Agency, updated Plenary Session attendees on California’s effort to conserve 30 percent of its land and coastal waters by 2030. He and Dr. Nathaniel Roth, chief scientific and data adviser for the California Department of Conservation, demonstrated CA Nature, an online GIS site that synthesizes data about biodiversity, climate change, public access to recreation, and more. Users of CA Nature can explore each of these topics using maps and charts and to see where there are additional opportunities for conservation.
Two presenters from the National Geographic Society—Dr. Jill Tiefenthaler, its chief executive officer, and Ronan Donovan, a National Geographic Explorer—reinforced the importance of map-based storytelling to create common understanding. Tiefenthaler announced National Geographic’s new Global Storytelling Institute, which can help geospatial practitioners more effectively communicate geography-based stories. And Donovan showed the audience how he employs geospatial analysis to find out where conflicts between humans and wolves are common, and how to use that data to foster coexistence.
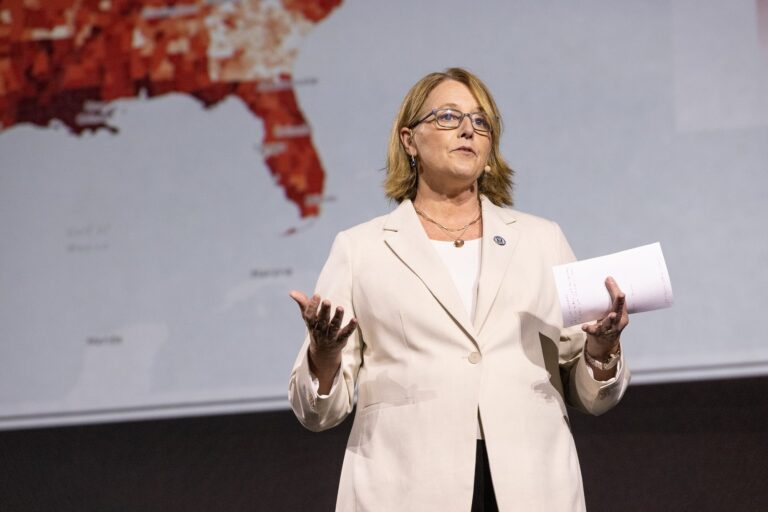
To round out the special presentations, keynote speaker Deanne Criswell, administrator of the Federal Emergency Management Agency (FEMA), focused on how analyzing data from past disasters and performing predictive modeling is key to preparing for a future with more natural hazards. FEMA’s National Risk Index, a geographic database, does this by examining communities’ risk of and social vulnerability to experiencing disasters. Users can employ the tool to evaluate their own communities’ risks, and it can help emergency managers better focus their resources. As Criswell emphasized, emergency preparedness and response are collaborative endeavors.
“Connect and grow with each other,” she implored the audience. “Keep innovating and creating so we can save the most lives, protect the most property, and create sustainable communities for generations to come.”