
The 2019 Esri Developer Summit Delivers a Road Map
Location is paramount in the geospatial world.
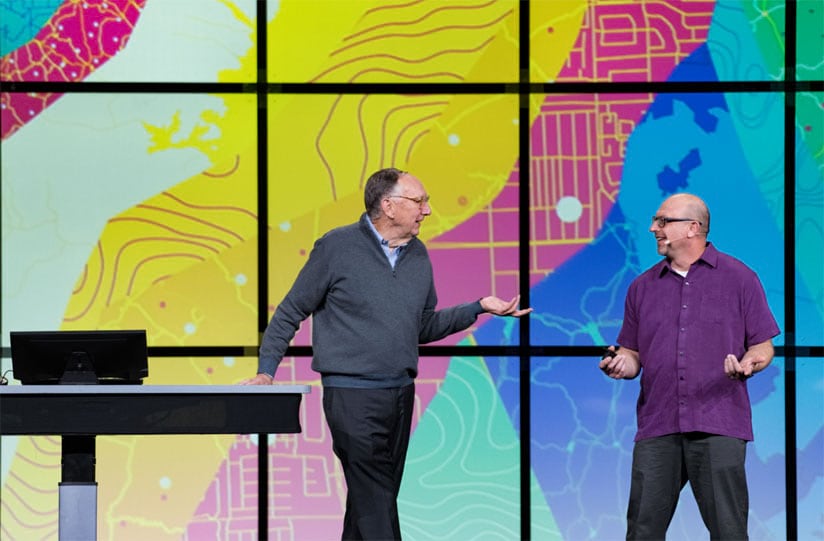
“Location has an aspect in every bit of decision-making and analysis and visualization, and it’s just going to become a more powerful tool,” said Jim McKinney, chief technology officer (CTO), desktop development, at Esri said in a video welcoming 2,100 geospatial app developers to the Esri Developer Summit (DevSummit) in Palm Springs, California, last March.
The developers, who came from around the world, kept busy all week, dashing to technical workshops, meeting with Esri staff, and—for the athletic minded among them—playing in a spirited dodgeball tournament. The technical sessions, however, were the bread and butter of the summit, with about 200 sessions designed to teach them how to best work with Esri technology including ArcGIS API for JavaScript, ArcGIS API for Python, ArcGIS GeoEvent Server, ArcGIS Runtime SDKs, AppStudio for ArcGIS, Web AppBuilder for ArcGIS Developer Edition, and many other products.
Attendees also watched about a dozen Plenary Session demonstrations, including one on the new ArcGIS Notebooks for analyzing and visualizing big data and another on the ArcGIS Vector Tile Style Editor, which can be used to easily create beautiful and well-designed custom styles for Esri vector basemaps.
The theme of this year’s DevSummit was GIS—Inspiring What’s Next, with the Plenary Session designed to show attendees the latest capabilities in ArcGIS. But before Esri staff dug into the nitty gritty of the technology, McKinney gave a shout-out to the geospatial app developers. These are the people who often work behind the scenes, building the apps that colleagues in their organizations use to visualize, manage, analyze, and share information and depend on to make critical decisions.
“Your work, your creativity, your code, the apps that you build, and the systems that you build enable people to make better decisions and make a positive difference for your organizations, for your enterprises, for your customers, for the public, and for our planet,” said McKinney. “And that is awesome.”
Esri president Jack Dangermond also lauded the developers’ work.
“Our sense is that you are doing the system’s thinking. You are doing the engineering. You are building the applications that backdrop so much of what is happening in the geospatial world today,” Dangermond told the audience. “Some of you are doing it with lightweight applications, [while] some of you are doing it with machine learning and heavy-duty analytics. Some of you are setting up architectures and making whole organizations come to life [geospatially].”
Dangermond said that despite the negativity in the news, the work that geospatial app developers do is a positive force, and that deserves a big thanks. “Your work is one of the bright lights of the planet,” Dangermond said. “It’s literally building that infrastructure that I think will make positive change on an ongoing and sustained basis.”

What’s New, What’s Next
The building blocks for that infrastructure include Esri technology, plus resources like the ArcGIS Developer Subscription. This subscription-based program offers a complete mapping and location analytics platform for developing apps.
Esri has completely redesigned the developer experience to bring the power of mapping and location intelligence to all developers, making powerful capabilities more accessible. This includes common capabilities like visualization, routing, and geocoding, as well as sophisticated analytical capabilities, offline workflows, and the ability to host their own data. The experience starts with the ArcGIS for Developers website, where developers get a dashboard tailored to the type of developer they are and their interests.

Developers can sign up for an Essential subscription, which lets them access all of Esri’s APIs and SDKs for web, native, and mobile platforms; host, query, and manage content; style basemaps, and benefit from hundreds of tutorials, samples, and open-source projects. They can also use tools like the Vector Tile Style Editor, which gives them the ability to style Esri vector basemaps. Builder subscriptions, which include everything in the Essentials subscription, add commercial app deployment for an unlimited number of revenue-generating applications, more tools for building and testing, and Esri technical support . All developer subscriptions get up to 1,000,000 free map views per month and a pay-as-you-go model to use Esri’s routing and analytical services, which have been substantially reduced in price.
“It’s tailored to the work that you do,” Euan Cameron, CTO of developer technologies, said about the program. “We present content that’s specific to the needs of your development efforts. We’ve got tools like the new ArcGIS Vector Tile Style Editor, where you can style vector basemaps . . . [and] we have lots of open-source projects for you to start doing your development.” Watch this video to learn more.

Esri software development director Sud Menon gave the audience a comprehensive overview of the ArcGIS platform. “ArcGIS itself is part of the Esri Geospatial Cloud,” Menon said. The Esri Geospatial Cloud includes geoenabled systems that work with an organization’s GIS. One of these is Insights for ArcGIS, which fuses location analytics with open data science and business intelligence workflows to solve spatial problems. Insights was recently made available to non-GIS analysts via the Insights Analyst User Type in ArcGIS Online and ArcGIS Enterprise, making the analytic capabilities of Insights accessible to analysts outside of the GIS department who need to easily analyze spatial and non-spatial data together using maps, charts and tables. The yet-to-be released ArcGIS Urban will give urban planners a web-based GIS solution to do urban planning and design; create, manage, and share plans; visualize projects and see zoning regulations in 3D; compare design scenarios; analyze the impact of their plans based on a set of built-in indicators; and engage with the public.
Another new addition to the ArcGIS platform will be ArcGIS Indoors, according to Menon. “ArcGIS Indoors is . . . ]a complete indoor mapping and location system, allowing users to do things like wayfinding and orienting themselves indoors, and providing organizations with the ability to do performance monitoring [and] space and asset visualization,” Menon said.
Watch Menon’s presentation in its entirety.

Esri staff also gave the audience a taste of some of the new Esri technology they’ve been working on since the 2018 DevSummit.
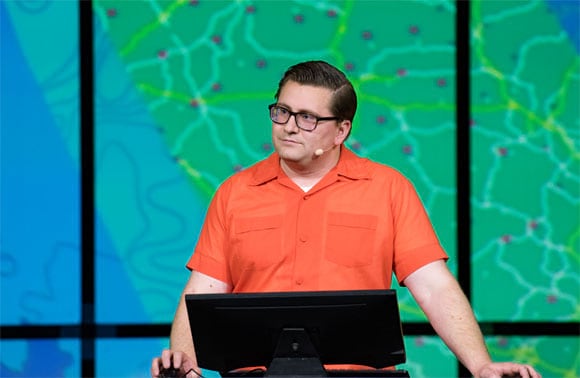
Patrick Arlt demonstrated how to use the new Vector Tile Style Editor to customize a basemap from ArcGIS Living Atlas of the World. Arlt, an applications engineer at Esri, showed the developers how to use the editor’s quick edit tools to style the basemap’s layers. He selected different colors to represent land, water, roads, boundaries, buildings, and nature. He differentiated minor roads from the major roads using different shades of purple. And he made the labels for all the place-names on the map larger by changing the font size. All this work took just minutes.
“With my style looking good, I can save it and start using it in all my maps and apps across the entire platform,” Arlt said. “This shows you some of the intelligent defaults and bulk editing tools we’ve built to help you style your own basemaps.” Watch Arlt’s presentation.
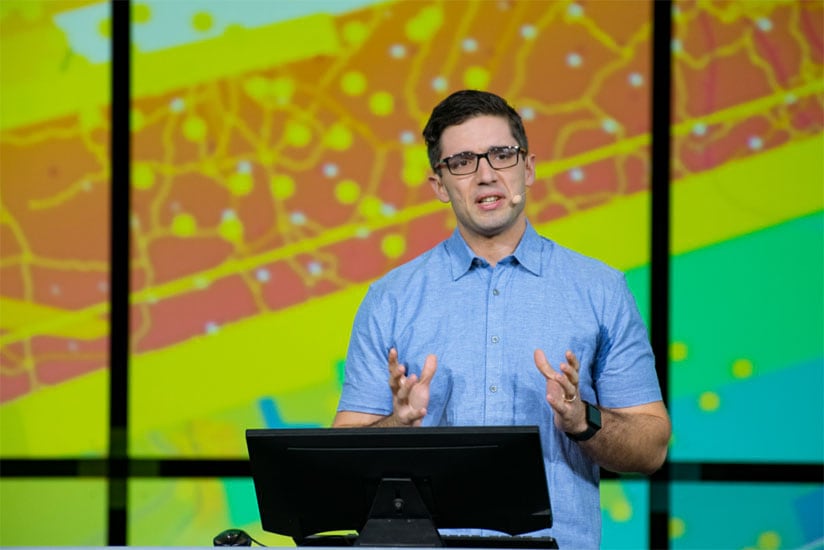
Shannon Kalisky, product manager for analytics and data science at Esri, demonstrated how to use the new ArcGIS Notebooks for analyzing and visualizing big data to solve complex problems.
“ArcGIS Notebooks puts familiar data science tools directly in Esri’s Geospatial Cloud, allowing you to use Jupyter to create hosted Python notebooks that are tightly integrated with your portal,” she said. “All this is powered by the new ArcGIS Notebooks Server that runs within ArcGIS Enterprise.”
During her presentation, Kalisky demonstrated how to import data into the notebook and conduct an analysis on watershed health using Superfund and watershed data. She said that ArcGIS Notebooks gives users access to ArcGIS API for Python and ArcPy, plus the standard GeoAnalytics, and raster analysis tools in Portal for ArcGIS for doing analyses. Watch this video to see Kalisky run her watershed analysis and learn about other, more sophisticated analyses that can be done with ArcGIS Notebooks using machine learning driven by ArcPy.

Advanced spatial analysis also can be done in ArcGIS Pro, as Esri product engineer Orhun Aydin demonstrated during his presentation on modeling the movement of plastic debris in the Pacific Ocean and its detrimental effect of the debris on marine life and coastal health. “Plastic pollution in the world’s oceans is a global problem that is impacting humans and marine animals alike,” Aydin said. “Ocean currents . . . form areas of swirling movement called gyres, where plastic debris accumulates and creates plastic islands.”
Aydin said that plastic debris is hard to detect using imagery from satellites. “Instead, we can simulate how plastics move in the ocean, using an open-source Lagrangian ocean modeling library that I’ve integrated into a Python toolbox,” he said. “This model uses multiple inputs such as surface winds and ocean currents.”
He went on to show how the movement of plastic debris can be analyzed and mapped as plastic islands. Aydin then used tools available in ArcGIS Pro, such as the Multivariate Clustering tool and the R-ArcGIS bridge, to evaluate the impact of the plastic islands on marine life, for example, leatherback turtles, including analyzing whether the turtles tend to evade or linger near the plastic islands. In his analysis, Aydin found that some leatherback sea turtles loitered around plastic islands.
“This might mean that these leatherback turtles are either feeding on plastics, or they might be caught (by) plastics from these plastic islands,” he said. Watch Aydin’s presentation and analysis from start to finish.
Data-Driven Analysis and Geospatial Deep Learning
Jay Theodore, CTO for the ArcGIS Enterprise group at Esri, spent a few minutes stressing the importance of the geospatial infrastructure that Esri technology provides for data analysis. “Analysis starts with your data because that’s where all your true information can be extracted from,” Theodore said. “ArcGIS works with all types of data, whether it be your raster data from satellite or drone imagery or your big data stored in S3 buckets. It could be CRV, optimized row columnar (ORC) or [Apache] Parquet files. It could be a folder of shapefiles, or it could be your utility network contained in an enterprise geodatabase.”
In ArcGIS Enterprise Portal for ArcGIS, developers can then organize that data into web layers, web assets like web scenes, and web maps, Theodore said. Analysis and data science can be conducted using ArcGIS Enterprise and expanded on, as needed, using servers such as ArcGIS Image Server, ArcGIS GeoEvent Server, and ArcGIS GeoAnalytics Server. “For real-time streaming analysis, you have ArcGIS GeoEvent Server. You have ArcGIS GeoAnalytics Server if you are working with large volumes of data,” Theodore said. “Similarly, for raster analysis, you have ArcGIS Image Server.”
Watch this video to hear Theodore’s presentation on spatial analysis and data science.

Theodore also touched on how raster analytics capabilities, available in ArcGIS Pro and ArcGIS API for Python, can be used to conduct spatial deep learning. His colleagues, Vinay Viswambharan, Esri product manager for imagery, and Rohit Singh, managing director at the Esri R&D Center in New Delhi, India, demonstrated how ArcGIS can be used to extract detailed information from imagery. In their example, they showed how the Bureau of Land Management (BLM) could search for and find unpermitted oil and gas well pads in southeastern New Mexico using Sentinel-2 imagery mapped using ArcGIS.
“Sentinel-2 imagery is great for change detection, primarily because the refresh rate of the imagery is once every five days,” Viswambharan said, using the Swipe Layer tool in ArcGIS to compare two sets of imagery to search for new well pads. “When I compare the two images, clearly you can see at least three new well pads. And when I overlay the well points that are provided by the state, you will see a problem. There are at least two new well pads in here that do not have permits issued.”
But how can the BLM find all the unregistered well pads over a large area such as southeastern New Mexico? It’s done with deep learning, Viswambharan said. Singh then walked through the workflow using ArcGIS Notebooks. First, he brought in training samples to study and learn from—the locations of the objects—in this case, well pads—and the imagery. He dropped the layer of the known well pad locations into ArcGIS Notebooks, along with the Sentinel-2 imagery for the area of interest. Using various tools such as Detect Objects Using Deep Learning (which are also available in ArcGIS Pro), he deployed a training model to locate all the well pads. Once the results came in, they were added to ArcGIS for visualization and analysis.
“Overlaying the data that is provided by the state [on the map], I can now extract the well pads and identify all the well pads that are unregistered,” Viswambharan said. “To summarize, ArcGIS has powerful deep learning capabilities. In addition to ArcGIS Pro and the map viewer, Python API seamlessly integrates with these deep learning capabilities.”
To see the entire deep learning workflow, watch the presentation.

Real Software Engineering
The keynote speaker this year was Glenn Vanderburg, vice president of engineering at First, a company that specializes in predictive analytics for real estate transactions. Vanderburg is a longtime software developer who has done a lot of thinking about software engineering, hence the title of his talk, “Real Software Engineering.” He presented a thought-provoking look back at how the field of software engineering has evolved over the last 50 years and brought up the burning question in the industry, Should software developers really be called engineers?
Watch Vanderburg’s one-hour presentation.
Developers who want to learn about geospatial app development using the ArcGIS platform will have another opportunity when Esri hosts the Esri European Developer Summit, November 4–6, 2019, in Berlin, Germany.