Empowering the Democratic Process with Intelligent Mapping
Elections are the foundation of democratic society. 21st century elections leverage technology at every step in the process to insure accuracy, openness, timeliness, and fairness. From operations and public outreach to redistricting and campaigning, intelligent maps effectively serve the public and meet expectations.
Here are eight things you can do today to leverage the power of geographic information systems (GIS) technology to make elections smarter in your community.
1. Locate Early Voting Centers
Early voting centers allow participation by voters who may not be able to vote on the set Election Day. The availability and hours of operation for early voting centers can vary by jurisdiction, and registered voters are more likely to participate in a given election when they can find an early voting center located conveniently near their home or place of business.
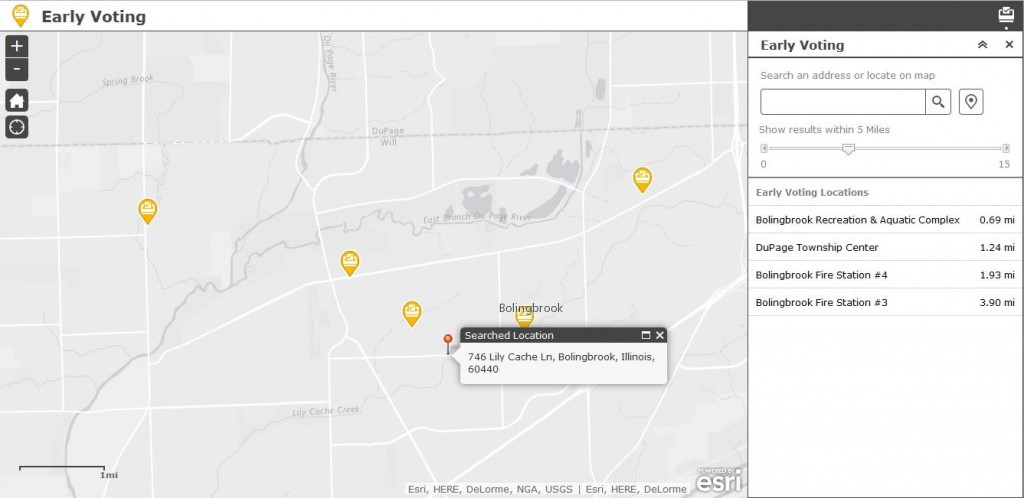
Early Voting is an app that can be used by citizens to find early voting locations where ballots can be cast in person or by mail. This app can be accessed from a smartphone, tablet, and desktop computer.
Get started with the Early Voting app so you can help citizens find locations closest to them, view hours of operation, and generate driving directions.
2. Find Election Polling Places
Election polling places are typically located in public facilities and are used to gather and count ballots on Election Day. Each voting precinct has a designated polling place, and each polling place is open during specified hours depending on the type of election.

Election Polling Places is an app that can be used by citizens to locate the polling place where ballots can be cast on Election Day. This application can be accessed from a smartphone, tablet, and desktop computer
Get started with the Election Polling Places app so you can help citizens to locate the correct polling place where their ballots can be cast on Election Day.
3. Report Polling Place Wait Times
Providing accurate wait times on Election Day helps voters determine the best time to vote and helps to smooth out traffic spikes that typically occur at polling places at certain times of the day.
Polling Place Wait Times is an app that can be used by poll workers to report expected wait times at their assigned polling place. As wait times are reported by poll workers, they can then be shared with citizens using the Election Polling Places app or accessed via a simple map embedded on the Clerk or Election Commission website.
Get started with the Polling Places Wait Times app so you can help encourage participation and increase satisfaction during the voting process.
4. Share Election Results
The Election Results Viewer is an app that can be used by citizens and other interested parties to review elections results. This app can be used to share results tabulated on election night; and historical results that are shared after each election. Election Results Viewer can be accessed from a smartphone, tablet, and desktop computer.
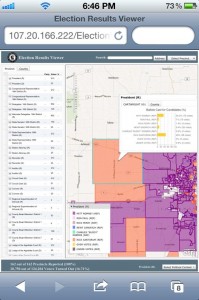
Election Results Viewer is typically used by clerks, election commissions, or other local government organizations to deliver a map-based election reporting application. This app provides access to the organization 24 hours a day, seven days a week, and typically supplements tabular results published by these organizations.
Get started with the Election Results Viewer app so you can let citizens and other interested parties quickly and easily review elections results.
5. Find Elected Representatives
My Elected Representative is an app that can be used by citizens to determine who represents them in local, state, and federal elected offices. This app can be accessed from a smartphone, tablet, and desktop computer.
Organizations can deploy a single application that includes local, state and federal representatives; or deploy multiple applications (for example, My Local Representative, My Legislative Representative) that only include representatives from one or more levels of government.
Get started with the My Elected Representative app and see how you can help citizens determine who represents them in local, state, and federal elected offices.
6. Create Districting Plans
Esri Redistricting is a Web-based solution for state and local governments, legislators, and advocacy groups to create political and geographic redistricting plans. With Esri Redistricting, you have the ability to address common needs and challenges related to redistricting at the state and local level.
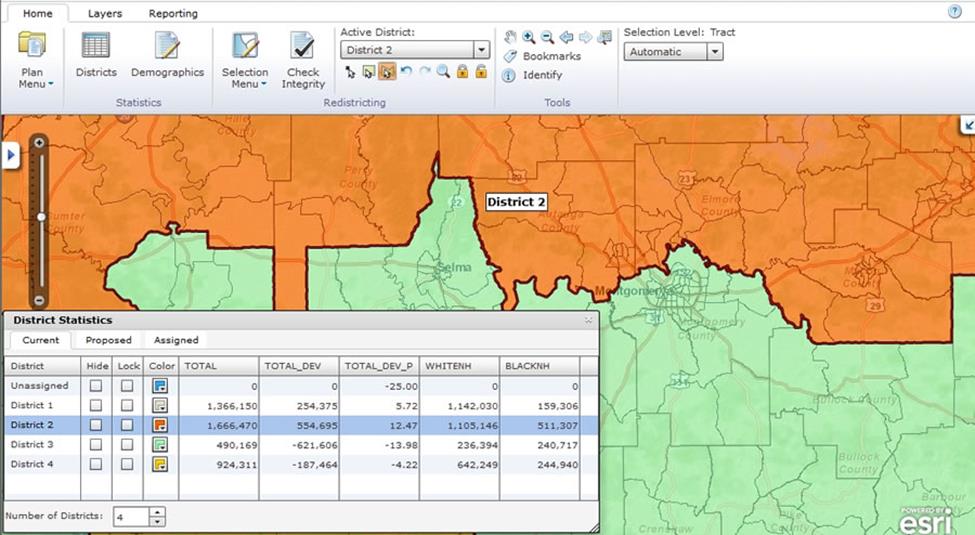
You can collaborate on district plans, create different versions of redistricting scenarios, and then share the final plan with stakeholders, including citizens.
Learn how you can use Esri Redistricting to create, manage, share, and maintain smarter plans that address common redistricting needs and challenges.
7. Identify and Reach Voters
Segmentation systems operate on the theory that people seek and live near others with the same tastes, lifestyles, and behaviors. When population is segmented by affluence, education, employment, and lifestyle, differences in their preferences become more apparent. Their behaviors—including product, leisure, and media preferences—can be measured, predicted, and targeted.
Campaigns can take advantage of valuable segmentation information by adding Tapestry codes to voter address records—they are a gold mine of information. Campaigns can identify their best opportunities to target volunteers, donations, and fund-raising and other activities. Messages about concerns and issues can then be tailored to resonate with each audience and be conveyed by preferred media for maximum reach.
Learn how you can use Tapestry Segmentation to identify and reach voters and target campaign messages.
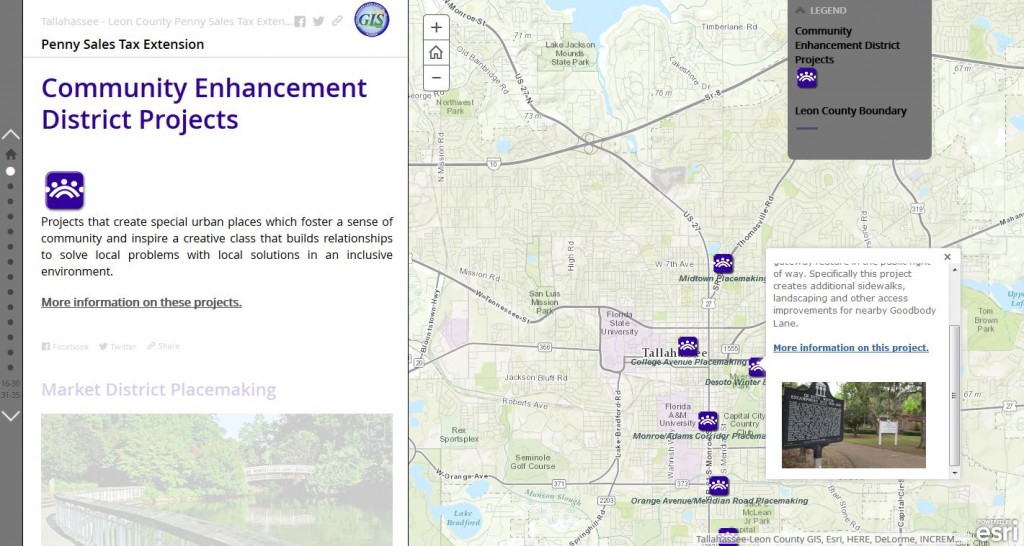
8. Communicate with Story Maps
Esri Story Maps let you combine authoritative maps with narrative text, images, and multimedia content. They make it easy to harness the power of maps and geography to tell your story.
On November 4, 2014 voters in Leon County, Florida chose to extend the penny sales tax. This Story Map was designed to help residents better understand how the penny sales tax works and what to expect in the future.
And when the election is over, the real work is just beginning for those elected. See how Oregon Senator Ron Wyden used Story Maps to communicate important and interesting information to his constituents.
Get started with Story Maps today.
—–
To learn more about the vital role GIS technology plays in making elections smarter, visit esri.com/elections.
