New York City has redesigned its truck route network for the first time since the 1970s, updating a system created long before e-commerce and same-day delivery. When a city adjusts the rules for businesses, planners need location intelligence to remain compliant and keep operations moving at the speed of business.
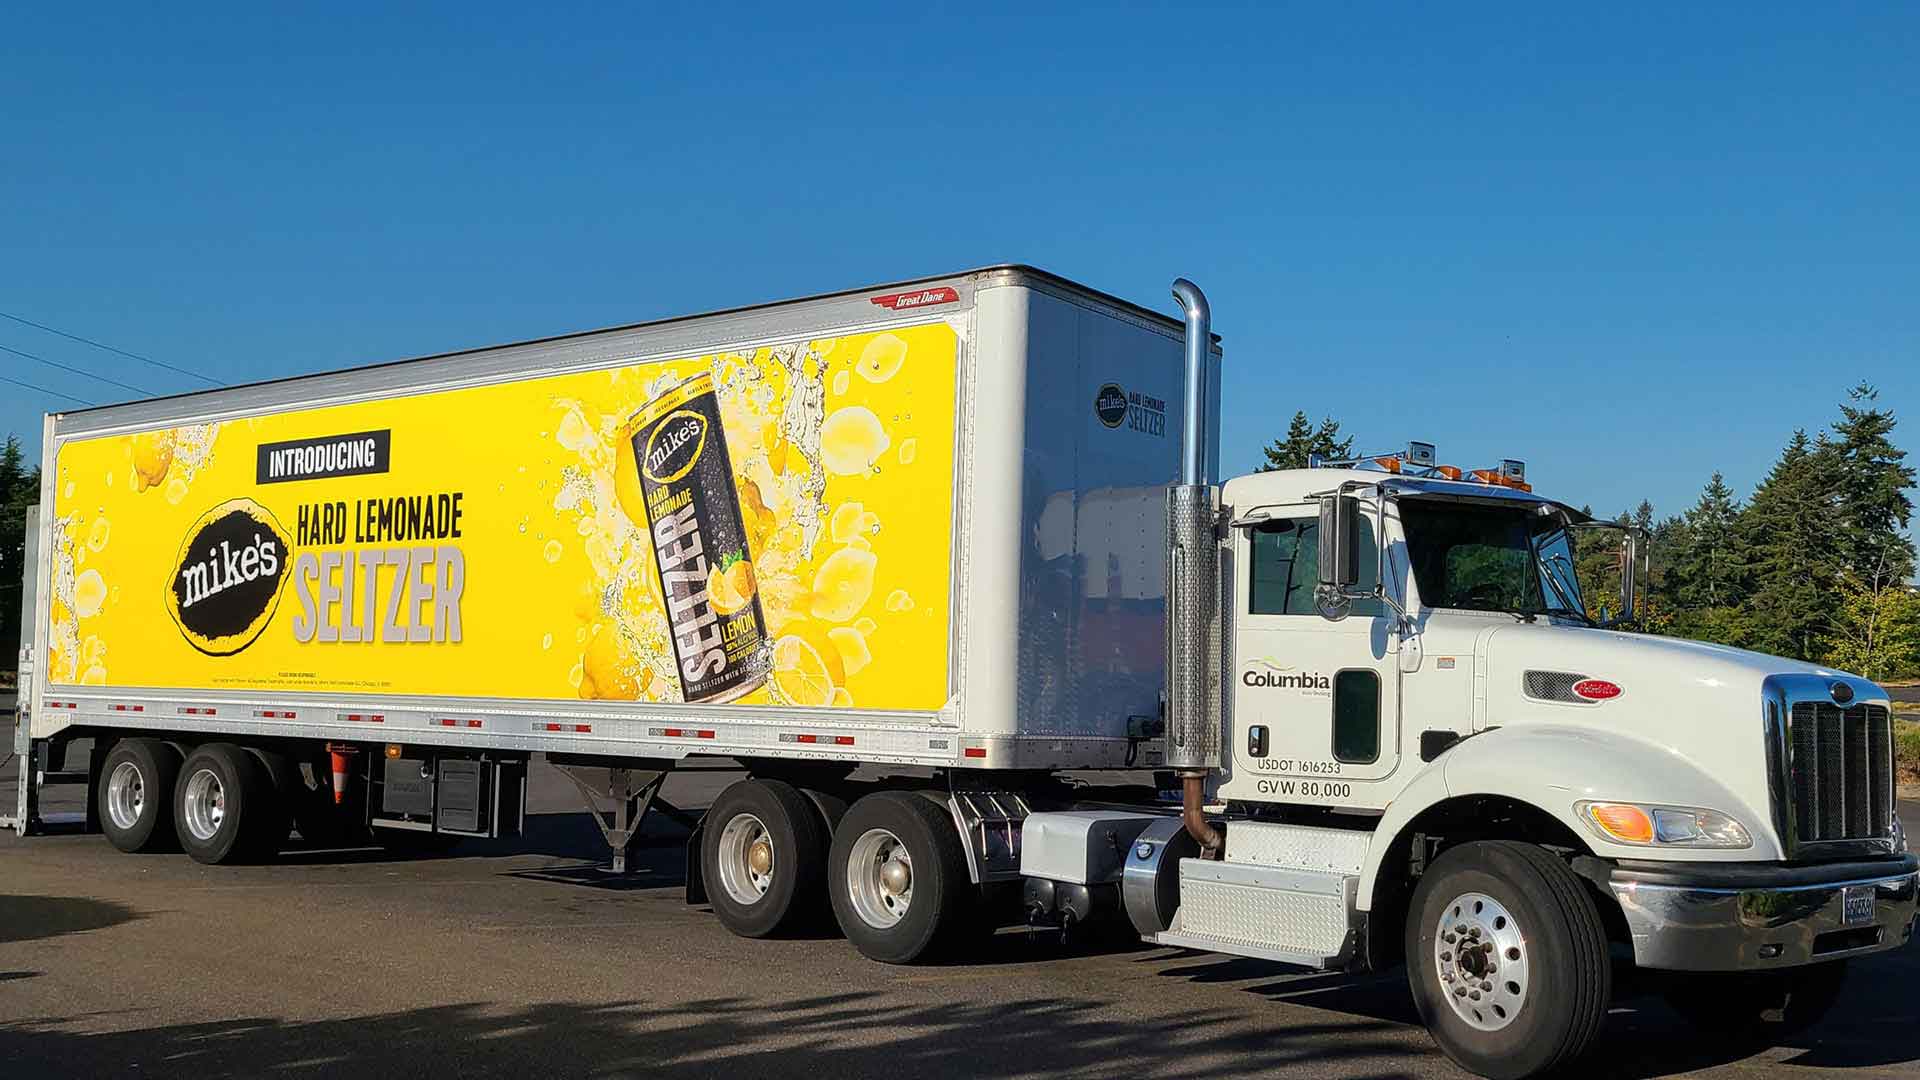
More than 90 percent of goods consumed in New York City arrive by truck, according to the Trucking Association of New York, with commercial vehicles carrying everything from groceries to industrial chemicals to HVAC equipment and the technicians who service it. For around 50 years, the network for commercial freight trucks had not changed much, leading to complaints from both residents and the businesses trying to coexist on crowded city streets.
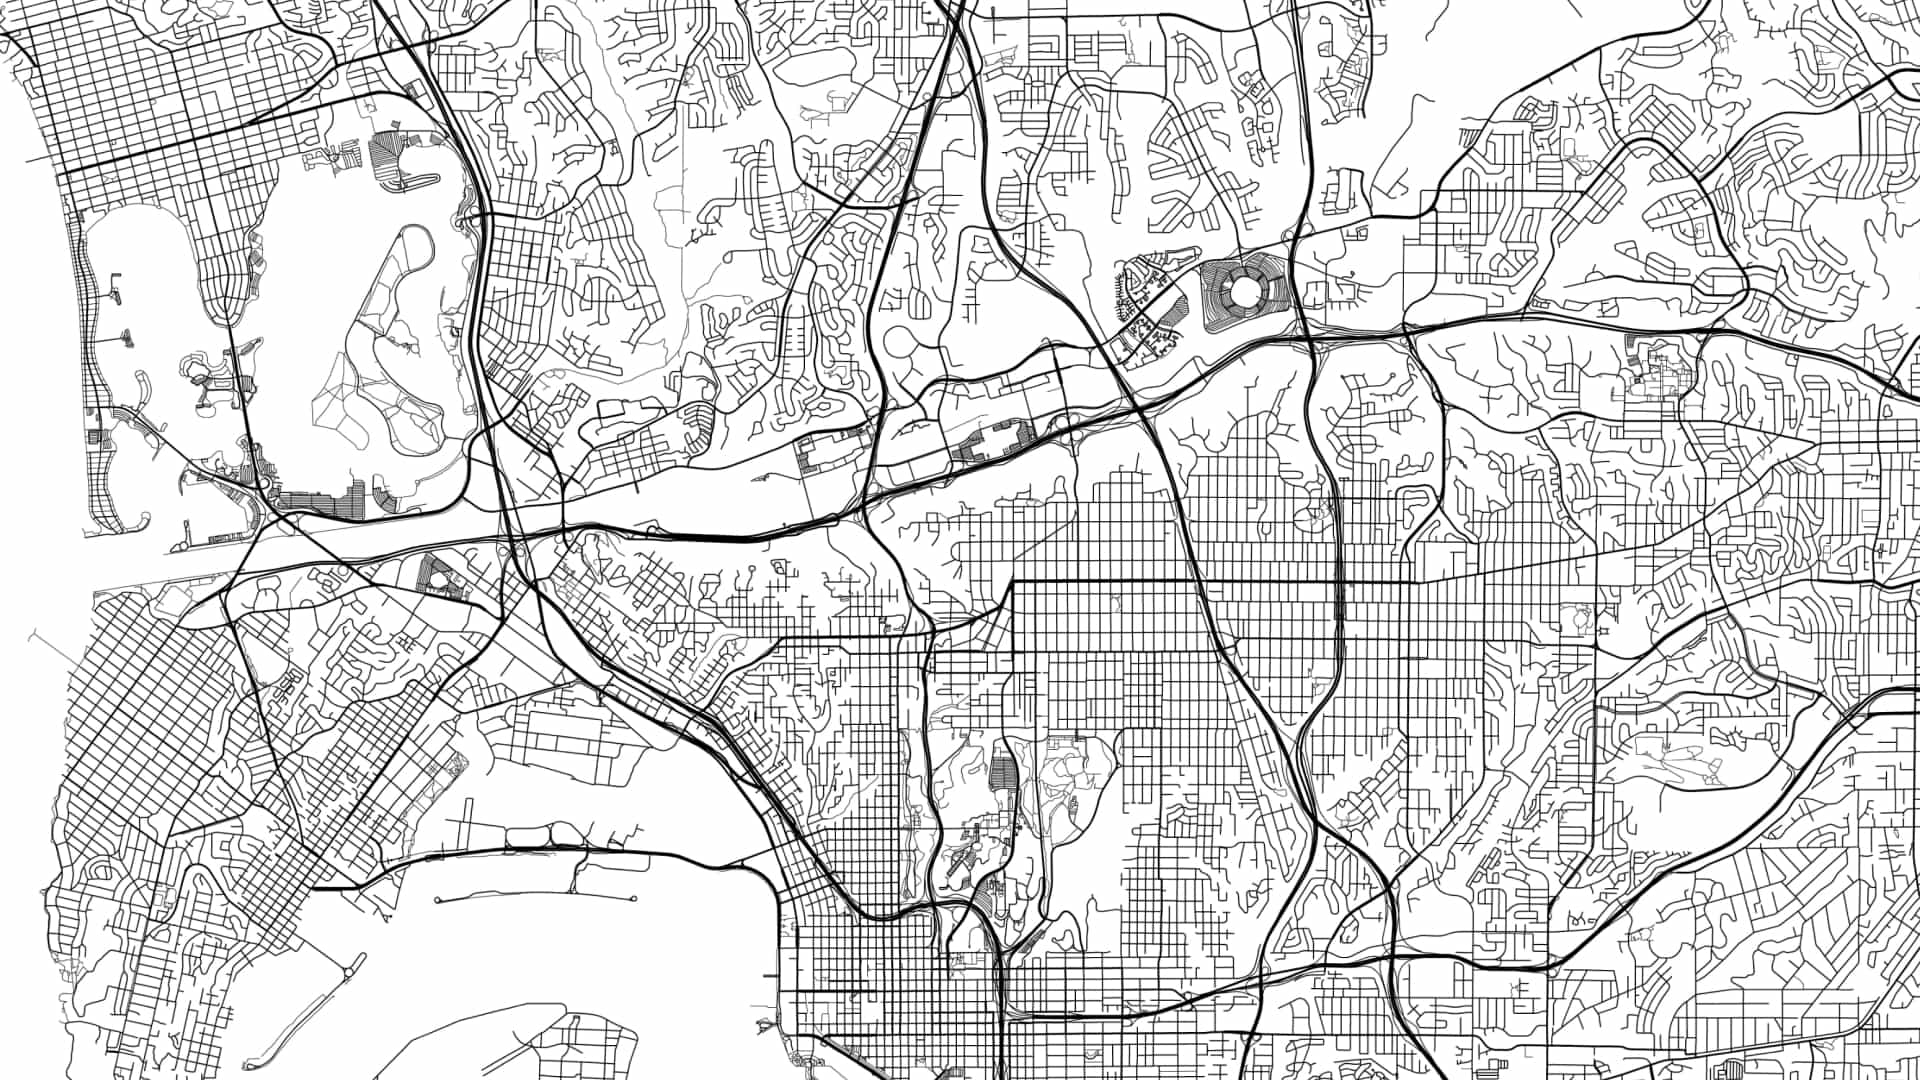
The update is intended to keep trucks and commerce moving while reducing their impact on residential neighborhoods. New York City’s Department of Transportation sought to create shorter connections between industrial zones and highways, with 45 percent of the updated network on or leading to existing highways, and 42 percent within industrial business zones. The agency is also supporting alternate last-mile strategies, including cargo bikes, neighborhood delivery microhubs, and the use of waterways to reduce reliance on trucks.
When transportation routes change, businesses must change with them. That starts with an authoritative map, and accelerates with an analytics engine that handles complex calculations and ensures a business stays not just compliant but also efficient.
What Happens When Truck Routes Change?
Optimizing the movement of vehicles through complex transportation networks is a challenge many business leaders confront—from freight forwarders to service businesses to food delivery providers. A redesigned freight network can reduce commercial traffic on one residential street while changing travel times, delivery schedules, and congestion elsewhere. Carriers must account for the new routes and restrictions without compromising customer service.
With location intelligence generated by geographic information system (GIS) technology, business and transportation planners examine the layout of a network and simulate how a change in one location could affect operations elsewhere.
One health services business used GIS to plan clinicians’ home visits. During a five-month pilot, the optimized routing and schedules saved clinicians more than 2,000 driving miles and 45 hours behind the wheel, allowing them to devote more time to patient care.
As those planners and others have learned, routing is rarely as simple as finding the shortest path between two points. It takes a complex analytics engine to balance schedules, vehicle and worker availability, service requirements, operating costs, and client needs.
Rerouting Around the Unexpected
The value of location intelligence becomes especially clear when a supply network is disrupted.
At a major meat-processing firm with operations in North Carolina, a failure at one manufacturing facility threatened as much as 15 percent of the company’s animal feed supply. Using GIS analysis to reroute feed deliveries around the shutdown, the company kept deliveries on schedule.
On a recent podcast, Dan Pimentel, president of ESP Logistics Technology, detailed a project that used location intelligence to help a large 3PL gain up to 20 percent more capacity from its existing fleet and reduce miles driven by 235 million.
When roads, regulations, or operating conditions change, business leaders can adapt quickly and effectively if they understand the intricacies of distribution network. Whether they’re faced with a revamp of city trucking routes or a kink in the supply chain, companies that have mastered location intelligence know where to go next.
The Esri Brief
Trending insights from WhereNext and other leading publicationsTrending articles
December 5, 2024 |

January 11, 2024 |
May 26, 2026 |

October 6, 2026 |
September 22, 2026 |

September 29, 2026 |