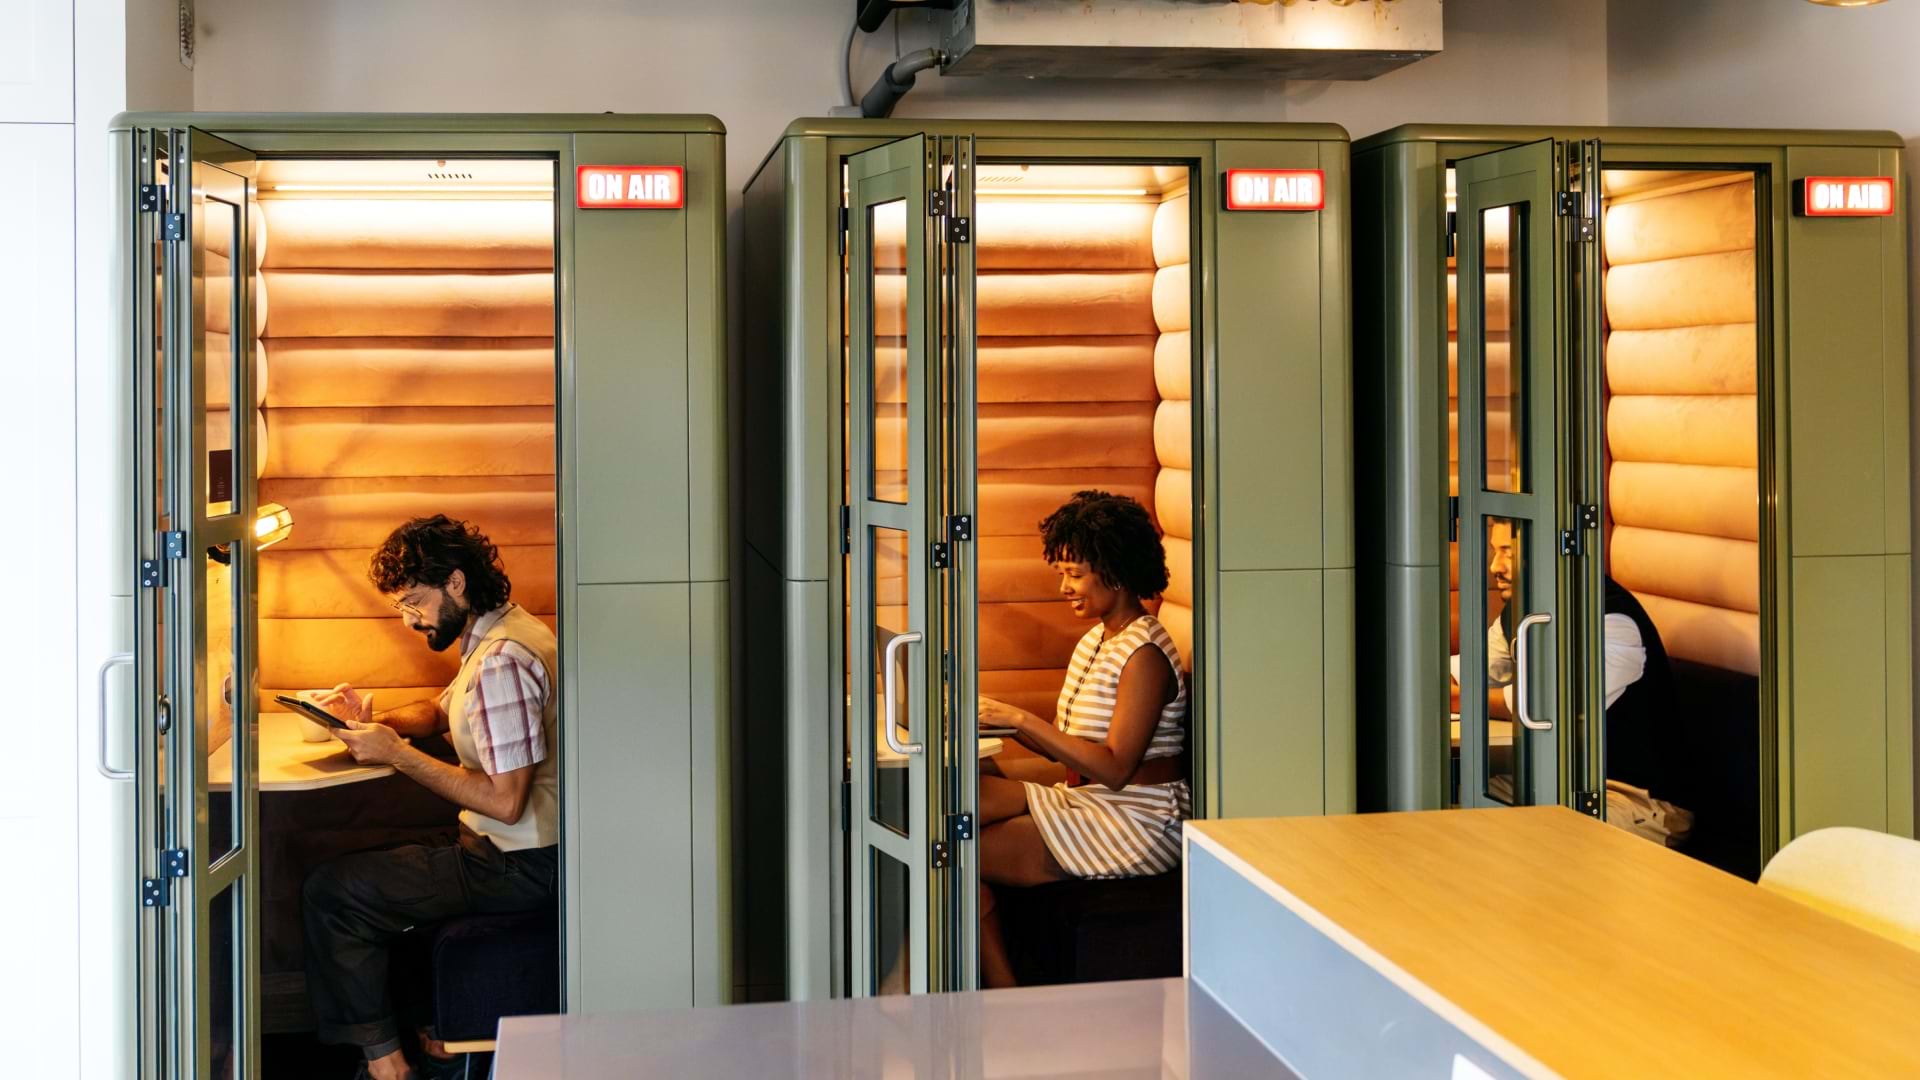
Corporate America’s return-to-office trend rests in part on a simple premise: Bring people back and engagement will follow. But recent workplace data highlighted in Fast Company complicates that assumption. Office-based workers reported the highest rate of workplace disconnection, while fully remote workers reported the lowest.
For executive coach and workplace expert Morag Barrett, that finding points to a problem that office mandates alone cannot solve. Barrett believes the workplace must be managed for connection—not merely occupied. Her recommendations center on what she calls intentional leadership habits: noticing who is isolated, creating reasons for meaningful interaction, and making connection part of how teams work rather than an expected by-product of occupying the same building.
If leaders want to understand why some employees feel connected and others do not, they first need a clearer picture of the workplace itself—where people sit, where teams gather, which spaces draw people in, and which arrangements might be stifling collaboration.
For some organizations, that picture begins with an operational basemap, a digital representation of the workplace showing floor plans, office spaces, assets, and employee-related information in one view. While a map itself won’t spark employee engagement, it can be the canvas that helps managers and workplace planners see how connections either form or break down.
Return to Office—and Lingering Bad Practices
The location of employees and teams—even equipment and amenities—can influence office cohesion and productivity. Yet, location decisions are often made from spreadsheets and static seating charts.
An operational basemap can reveal that members of a project team are spread across multiple floors, that a new employee is seated far from a potential mentor, or that collaboration spaces are disconnected from the teams that could benefit from them most.
At the main campus of Lawrence Livermore National Laboratory (LLNL), indoor mapping helps leaders manage more than 500 buildings, over 6 million square feet of space, and 8,000 employees—an environment too complex to understand with spreadsheets and intuition.
Using an operational basemap built on geographic information system (GIS) technology, LLNL staff have been “defragging” the lab, guiding employee placements and reducing redundancies such as multiple satellite offices assigned to a single employee.
The map translates a sprawling workplace into visible patterns, with a clear view of where employees and teams are clustered, scattered, or separated. With this knowledge, leaders can make more deliberate choices about adjacency, shared space, and support.
For some organizations, the basemap also helps answer questions like: Which people need more frequent contact? Which teams would benefit from closer proximity? Do certain spaces encourage informal connection, or does the layout work against that?
An Environment Built for Connection
The return-to-office debate has stirred questions both procedural and operational—mandates versus enticements, presence versus productivity. But to create a truly connected workplace, leaders need to understand which conditions help employees engage and collaborate.
While an operational basemap can’t single-handedly solve a lack of engagement, it can help an organization’s leaders see the workplace clearly enough to make better decisions. When it comes to building cohesion and culture, it pays to know where and how connections occur.
The Esri Brief
Trending insights from WhereNext and other leading publicationsTrending articles
December 5, 2024 |

January 11, 2024 |
September 22, 2026 |
May 26, 2026 |
June 5, 2025 |

April 7, 2026 |