Printing maps is essential to GIS. To print a static map from a web application, we rely on print services, just as we rely on a map service to run a web map or a geoprocessing service to run a web tool.
A print service generates high-quality printable documents with a map and elements like titles and legends in an image file format or a vector format (such as PDF). The client application can send these documents to a printer or plotter to produce an excellent-looking map, be it large or small.
Maps may be the most important element printed from your web GIS applications, but in many cases, a map is not enough to convey all the information you want. Including text and graphical elements that describe the data in the map can make your printed document more useful and informative.
Recently, ArcGIS Pro introduced a new capability to create reports. Reports combine maps (and all their component elements like legends and scale bars) with non-map elements, such as tables and textual descriptions generated from the data in the map extent.
This example report on endangered aquatic species in Canada was created in ArcGIS Pro and then packaged in a custom print service. When we embed that service in a JavaScript app’s print widget, we’re able to regularly print the report template.
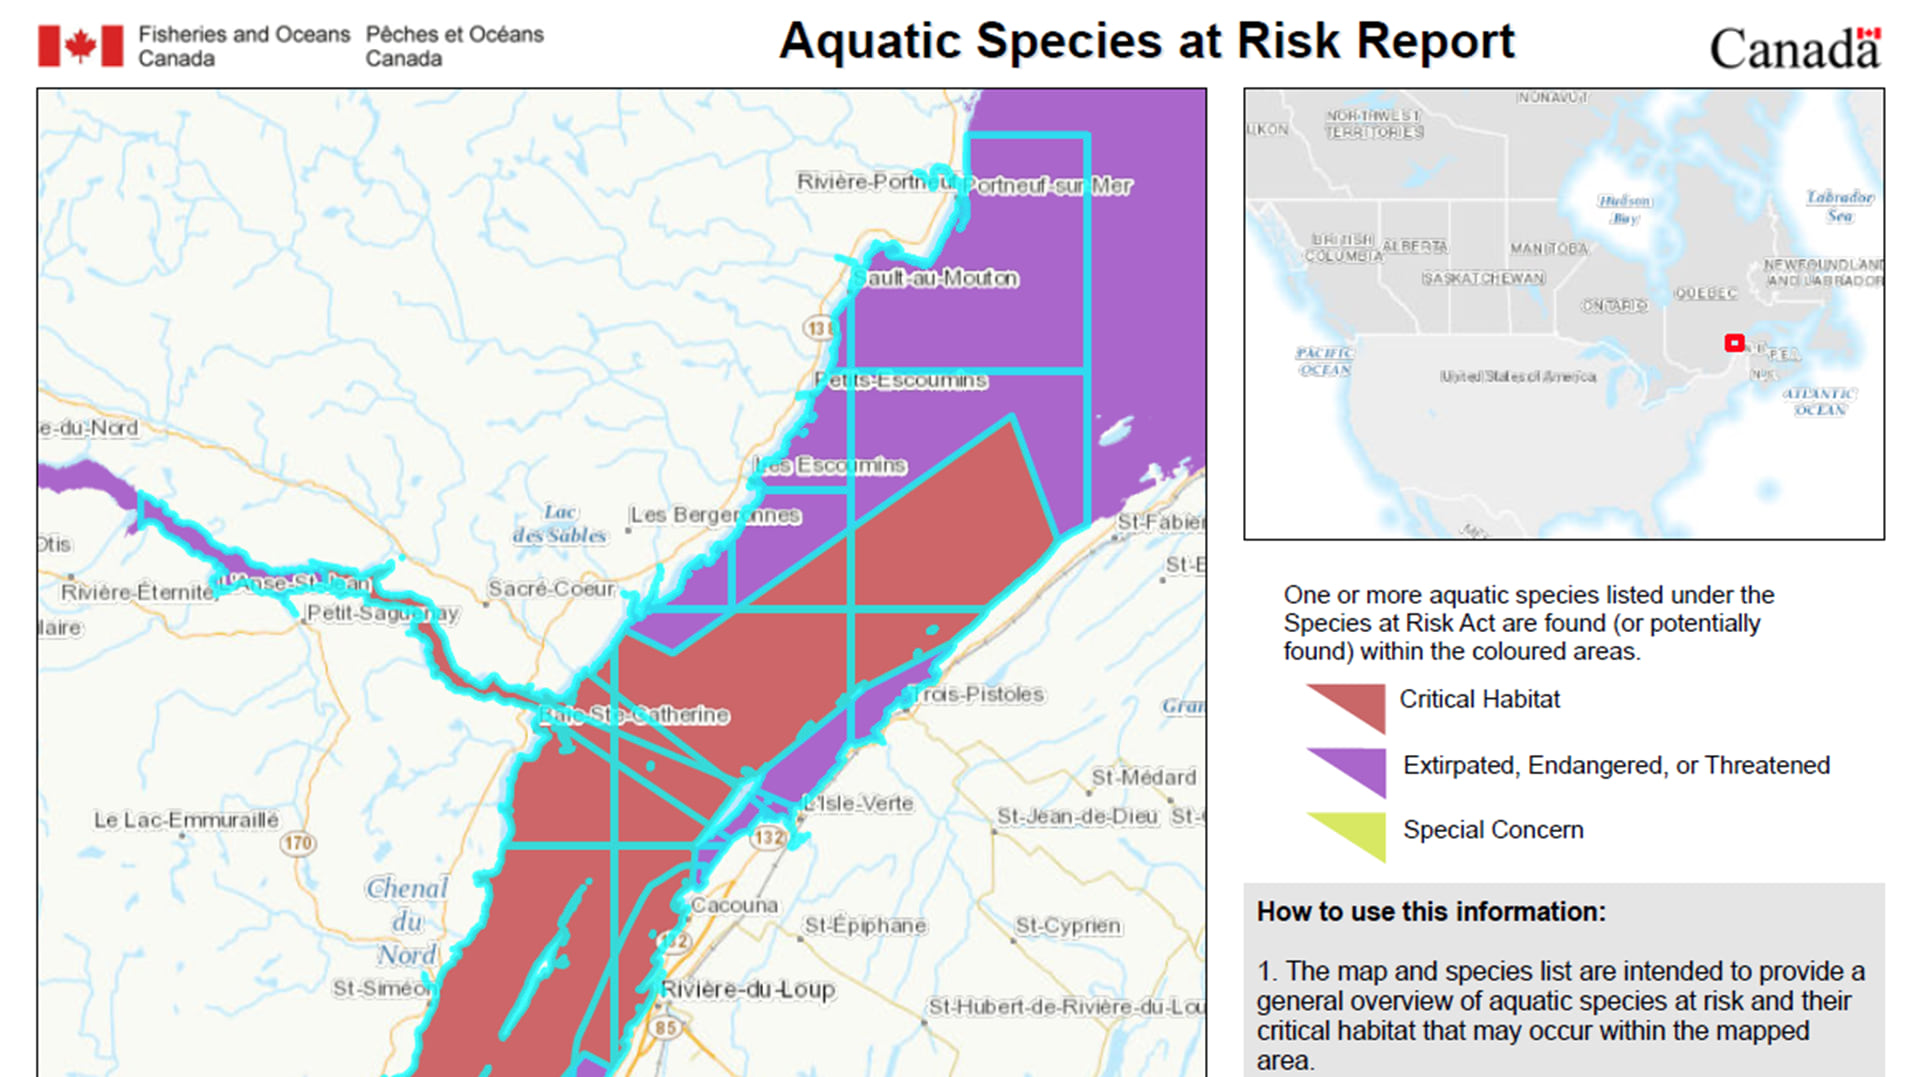
As you select features or filter them with a definition query, the other content in the report dynamically updates. This makes it easy to quickly reproduce professional-quality reports for different geographical areas and data sets while maintaining a consistent look and organization.
Here, we selected several areas of the St. Lawrence River centered around beautiful Riviere-du-Loup, Quebec. The first page of our report (above) included the map, legend, reference inset, and other textual elements. The second page (below) contains a table that shows each of the aquatic species at risk within our selected features. Had we instead selected areas around the Bay of Fundy, our map and table elements in the printed report would have described those selected features.
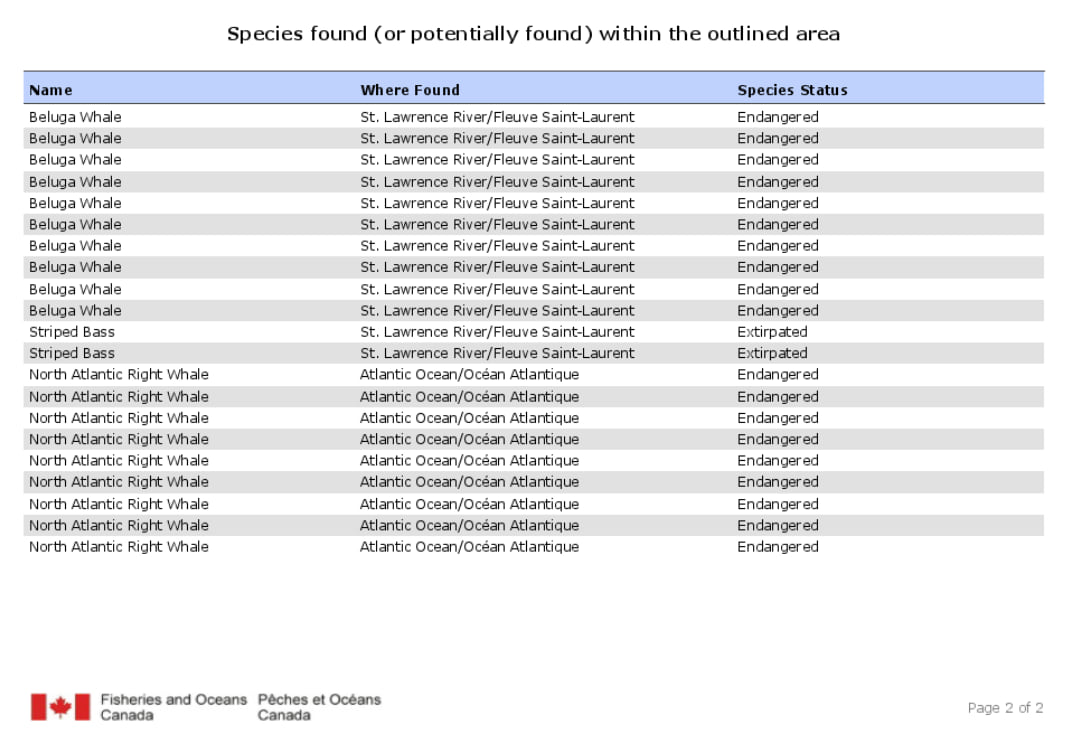
While reports are really useful on their own in ArcGIS Pro, they can also give an extra dimension to your web applications. Embedding a report in a print service allows it to function as an available template for printing in your app. Anyone using the app can set a specific map extent and then print a report, with its non-map elements describing that map extent, in the same format automatically. It’s highly reproducible, and as with other custom print templates, you can personalize it with your organization’s logos, acknowledgments, and other design elements.
Today, we’ll show you how to use reports created in ArcGIS Pro in a print service to make the report template available in your web apps.
Before we dive deep, let’s cover some basics first:
Requirements and limitations
To create and share reports, you need to be using ArcGIS Pro 2.3 or later. To embed a report in a print service, you need to publish it to ArcGIS Server 10.7 or later.
There is no generic report template available to embed – this is because reports are bound to a specific data schema. The layers with which you associate elements in the report must contain field names that match the field names you use in the report.
This workflow makes use of a custom ArcPy script tool. If you’ve never created a custom tool with ArcPy, don’t fear – we’ll help you make sense of what’s needed.
To help you learn the workflow, we’ve made some sample resources available at the following links:
- A zip file containing some sample code:
- A script tool (.tbx) ready to be published as a print service
- Two python script files (.py), and
- A report file (.rptx) created to work with a feature layer used in the following web map, created to only use selected features
- Two layout files (.pagx)
- A web map that contains a feature layer showing U.S. state boundaries
- A finished web application with Select and Print widgets
- The print widget is set up to use a print service named “PrintMapsAndReports” off your local machine:
https://localhost/arcgis/rest/services/PrintMapsAndReports/GPServer/Export Web Map
- The print widget is set up to use a print service named “PrintMapsAndReports” off your local machine:
Prepare the print service
1. Download the zip file linked above and unzip it on your machine.
Let’s assume you unzipped it in c:\data\PrintMapsAndReports folder.
2. Open ArcGIS Pro.
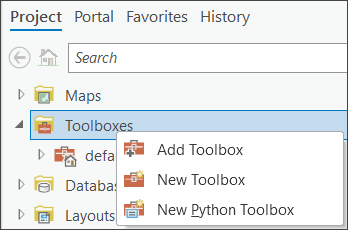
3. On the Catalog pane, right click on Toolboxes node and select Add Toolbox option from the context menu. Select C:\Data\PrintMapsAndReports\PrintTool\Printing.tbx.
4. Expand the toolbox – you’ll see two script tools in there.
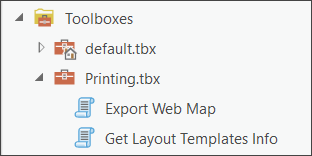
Double-click on the Export Web Map tool to open it.
5. In the tool options, specify C:\Data\PrintMapsAndReports\Templates for the Layout Templates Folder.
6. Click the Run button to execute the tool – stick around to make sure it runs successfully!
7. Next, do the same with the Get Layout Templates Info tool.
Make sure you choose C:\Data\PrintMapsAndReports\Templates folder here too.
8. Share the geoprocessing results of both tool tasks you’ve just run – either as a web tool to your ArcGIS Enterprise portal, or as a geoprocessing service to your stand-alone ArcGIS Server, if that’s what you’re using. On the Configuration tab, for the Execution Mode property, choose Synchronous.
Note: If you publish a geoprocessing service on a server running off your local machine, and name it PrintMapsAndReports, you can start it right away with the sample web map.
Use the service in a web mapping application
If you published your print service on a server running on your local machine (i.e. localhost), open the sample web application.
If you published the print service on a different machine, you need to create a new Web AppBuilder application from your portal or in ArcGIS Online. You can use the sample web map in your application if you’d like.
Add two widgets to the web app: Select and Print. For the Print widget, specify the URL of the print service you created from your Export Web Map task in the previous step.
Now, it’s time to try out your new print service! Use the Select widget to select a few states on the map.
Click on the Print widget, select State Population layout, then click the Print button. You should receive a PDF output file in a few moments with reports showing in its 2nd page.
If you had chosen A4 Portrait template, the output PDF file wouldn’t have the report part in it. It happens because the python code only generates reports when it find a .rptx file in Layout Templates Folder with the same name as the layout you selected.
What did I just do?
While you’re waiting, let’s explain what happens behind the scenes.
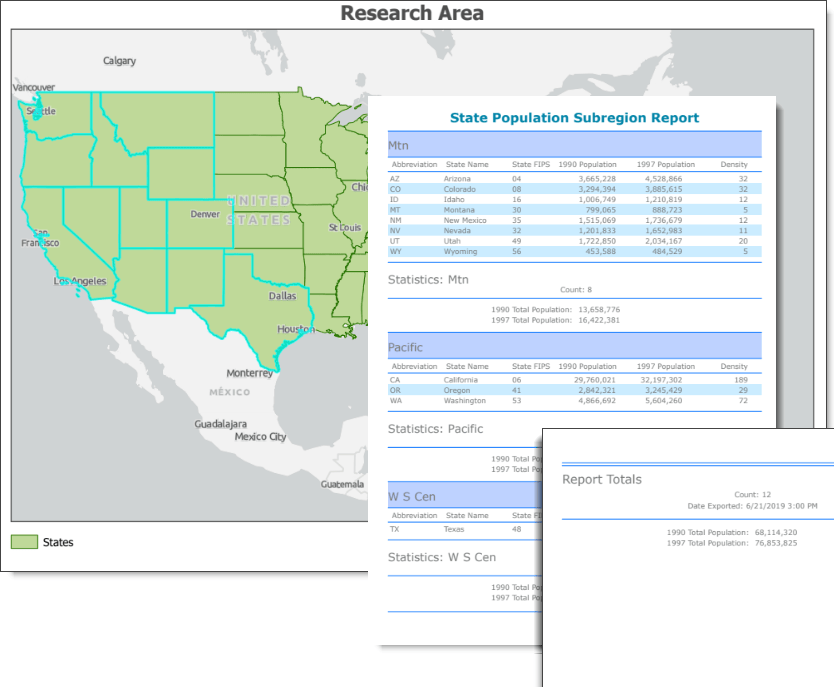
The web app makes a call to your print service URL to print from the report template, including the specific states that you selected to give info in the report’s tables.
The print service is technically a geoprocessing service running on ArcGIS Server. Printing on the server does the same basic action as running Export Web Map does in ArcGIS Pro.
While the default print service that comes with ArcGIS Server is basically parallel to Export Web Map, the custom script tool you created modifies that operation to export your specific report template.
Your custom print service performs the work of producing a PDF as specified and returns the output to the web app, which passes it to you.
Back to the map
By now, your printed map should be ready.
Click on the result to open it, and you should see your report. The first page contains the map with the selected states highlighted, while the rest of the report includes attribute tables describing the data from your selections.
Had you selected different states before printing, the printed report would have included attribute data for those states instead.
You can see how this makes printing with report templates endlessly versatile. Once your custom print service is up and running on ArcGIS Server, you and your users just need to select what they want to see and hit Print – the service will do the rest.

Hi,
Thank you for this helpful post, I was able to create and publish a report based on a hosted feature service and print it from my application.
Now, with ArcGIS Pro 2.5, came the possibility to add attachments to the Details section of a report. It works well in AGPro plugged in my hosted FS, but when I export the report file (rptx) and use in my web app, the Details section appears empty. Does your script support printing attachment, or is it possible to make an improvement so it is supported ?
Thanks
Hi,
My apologies for the delay. It is odd that it is not working for you from server side. When you say ‘the details section appears empty’, is that only empty for attached images, but the attributes showing up fine, or everything is empty (no attachment images and no attributes)?
Thanks
Hello again,
I just gave it a try and it worked for me. Just to make sure, did you upgrade your server to 10.8 as well?
Hi there,
Thank you for your help on this topic.
To answer your first question, the detail section was totally empty, attributes and image.
Regarding my Enterprise version, I am still in 10.7.1 which explain why it doesn’ work. I thaught it was not related to the ArcGIS Server version since it uses a pagx and rptx generated from ArcGIS Pro (version 2.5), but probably the server version must be compatible too.
Anyway thank you for your feedback, I am still facing some issues with report, so if you could check my thread (https://community.esri.com/thread/248881-formating-date-fields-in-arcgis-pro-report) it could be really helpfull.
Regards
Thanks for this write up, it has been helpful! I have come into an issue, when I share my tool and layer to my portal (10.7.1), the feature layer has to be public in order for the print service to work. Is there a way to make this work with out making the layer public?
Hi Anders, sorry I didn’t get a chance to reply sooner. I hope your problem is resolved by now. with ‘the feature layer’, I believe you meant the layer that you want to use as the source for the report, right? If so, I think it doesn’t need to be public. When you use a secured feature layer in your webmap, and click Print button, the request that goes to the print service includes a token. The print service uses that token to access the service. The report should do that too. If you still have the problem and can’t… Read more »
@mahoque-2 Similar to Anders, I cannot generate reports unless the report source (i.e. the feature layer I want to create a report from) is shared publicly. I used Google Chrome’s ‘Inspect’ feature and I don’t see any evidence of a token being included when sending the request to the print service…
Our version of Enterprise is 10.9.1
@Tanu Hoque, I am trying to follow the instructions and set up the print service, however, I am facing an issue with the tool, having followed the exact instructions, the first thing I found is that the web application throws an error “Unable to generate token”. Secondly, I tried to create a similar web application using WAB in my ArcGIS Enterprise but the tool shows error. Error executing tool. Export Web Map: Report: Unable to write PDF to location: ‘C:\arcgisserver\directories\arcgisjobs\…… Failed to execute (Export Web Map) My current environment is: – ArcGIS Server – 10.7.1 – Portal for ArcGIS –… Read more »
@Tanu Hoque , wondering if you have had a chance to look into the issue with the newer version?
@Tanu Hoque @ Scott MacDonald is it possible to include related tables into the reports print service somehow?
I deployed this almost a year ago and it worked great. Thanks so much for this blog. But I have a new project and I have found that this is failing to print when I include new reports. I went back and published out from the zip file to see if the issue was my new report but found that printing fails even when I make a copy of the States Report and edit it with a simple removal of a field. I’m wondering if this might have something to do with Pro version? I am currently at 3.0 and… Read more »
Thanks for posting this Tanu. I’ve been able to get it working with my Experience Builder app. I have one question though. Currently if you try and print without having selected any feature in the layer that the print widget uses to create the report off of, then the widget just spins until it fails. I’m guessing that was probably by design. My question is would it be possible to edit the code so that if you don’t have any feature selected the print widget still works and it just prints an empty report?