This is part two of the file knowledge graph blog series. In Part 1 we touched on how file knowledge graphs offer many of the same analytical capabilities as knowledge graph services in ArcGIS Enterprise. In this article we’ll take a closer look at some of the common tools and workflows you can try using a file knowledge graph in ArcGIS Pro. If you’re new to knowledge graphs in ArcGIS, this is a great starting place to learn more.
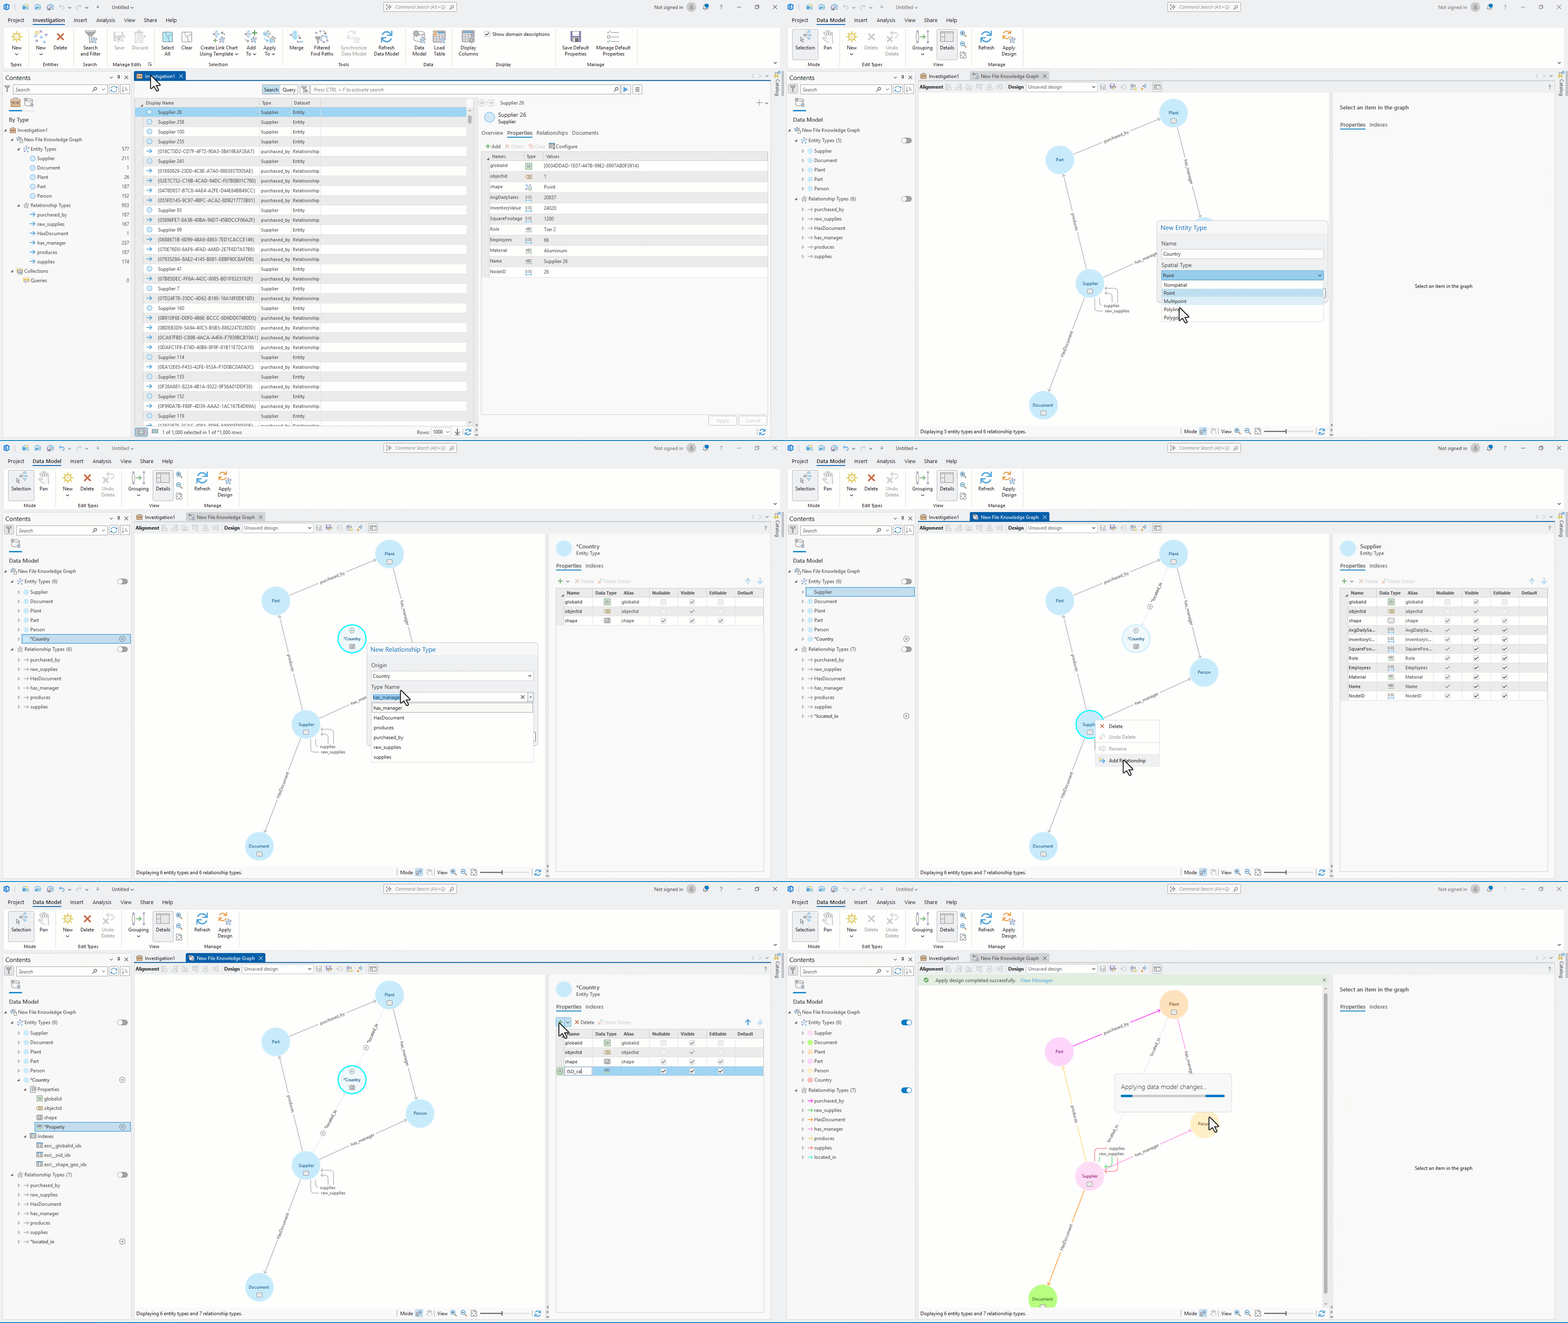
Visualize your graph data model
Every knowledge graph requires a data model. Before you can analyze connections or run queries in your investigation, you first need to define the types of entities and relationships that will represent your system.
At a high level, the data model contains entity types that represent the things you’re interested in tracking, and relationship types that define how those things are connected. For a supply chain, entity types might include Suppliers, Parts, Plants, and Distribution Centers. Relationship types describe how those entities interact, such as Supplies, Produces, or Ships To. Both entity types and relationship types can also contain properties that store additional information about each item.
Your file knowledge graph includes the data model designer feature, which provides a visual way to create and manage this structure. Rather than working from a text-based schema, you can build your data model as a diagram, making it easier to understand how entity types relate to one another and identify gaps or opportunities before loading data.
As your model grows, the data model becomes a valuable communication tool as well. A quick glance at the diagram can reveal the major components of a system and how information flows between them.
This visual approach is particularly helpful when you’re first learning knowledge graphs. Instead of focusing on graph terminology, you can focus on modeling real-world systems and their connections. Once the data model is in place, loading data and exploring relationships becomes much more intuitive.
Ask Better Questions with openCypher Queries
As your knowledge graph grows, there comes a point where manually expanding entities and relationships isn’t the fastest way to find answers. Sometimes you know exactly what you’re looking for, you just need a way to ask the graph.
That’s where openCypher comes in.
If SQL is the language of relational databases, openCypher is the language of graph databases. Instead of querying rows and tables, you’re querying entities and relationships. You describe a pattern you’re interested in, and the graph returns the entities and connections that match it.
For example, in a supply chain knowledge graph, you might want to find suppliers associated with a critical part, identify facilities connected to a manufacturer, or discover organizations a few relationships away from a distributor. Rather than manually following connections through the graph, you can describe the pattern you’re looking for and let the query engine do the work. In the example below we query all suppliers in the knowledge graph based on an average daily sales threshold that make aluminum parts.
At a high level, most queries follow three simple steps:
- MATCH the entities and relationships you’re interested in.
- WHERE narrows the results using property values.
- RETURN specifies what information should be displayed.
One of the advantages of graph queries is that relationships become part of the analysis. You’re not just asking for a list of entities, you can explore how those entities are connected and uncover patterns that may not be obvious through visual exploration alone.
But a query result is often just the starting point.
Put your knowledge graph on the map
Once your query has identified a relevant subset of the graph, ArcGIS Knowledge makes it easy to continue the investigation. Query results can be added directly to link charts to reveal network structure or added to maps to understand geographic context. A group of suppliers returned by a query might reveal shared dependencies in a link chart, while a map could show that those same suppliers are concentrated in a single region.
This ability to move seamlessly from querying to visualization is one of the strengths of ArcGIS Knowledge. Queries help you focus on the information that matters, while maps and link charts help turn those results into insight.
Like feature layers in ArcGIS Pro, knowledge graph layers can be symbolized, filtered, labeled, and explored through pop-ups. You can quickly visualize patterns, examine entity properties, and better understand how geography influences the relationships in your graph. The example below shows query results added to a new map, symbology applied to the knowledge graph layer, a pop-up for an entity in the knowledge graph, and the attribute table opened.
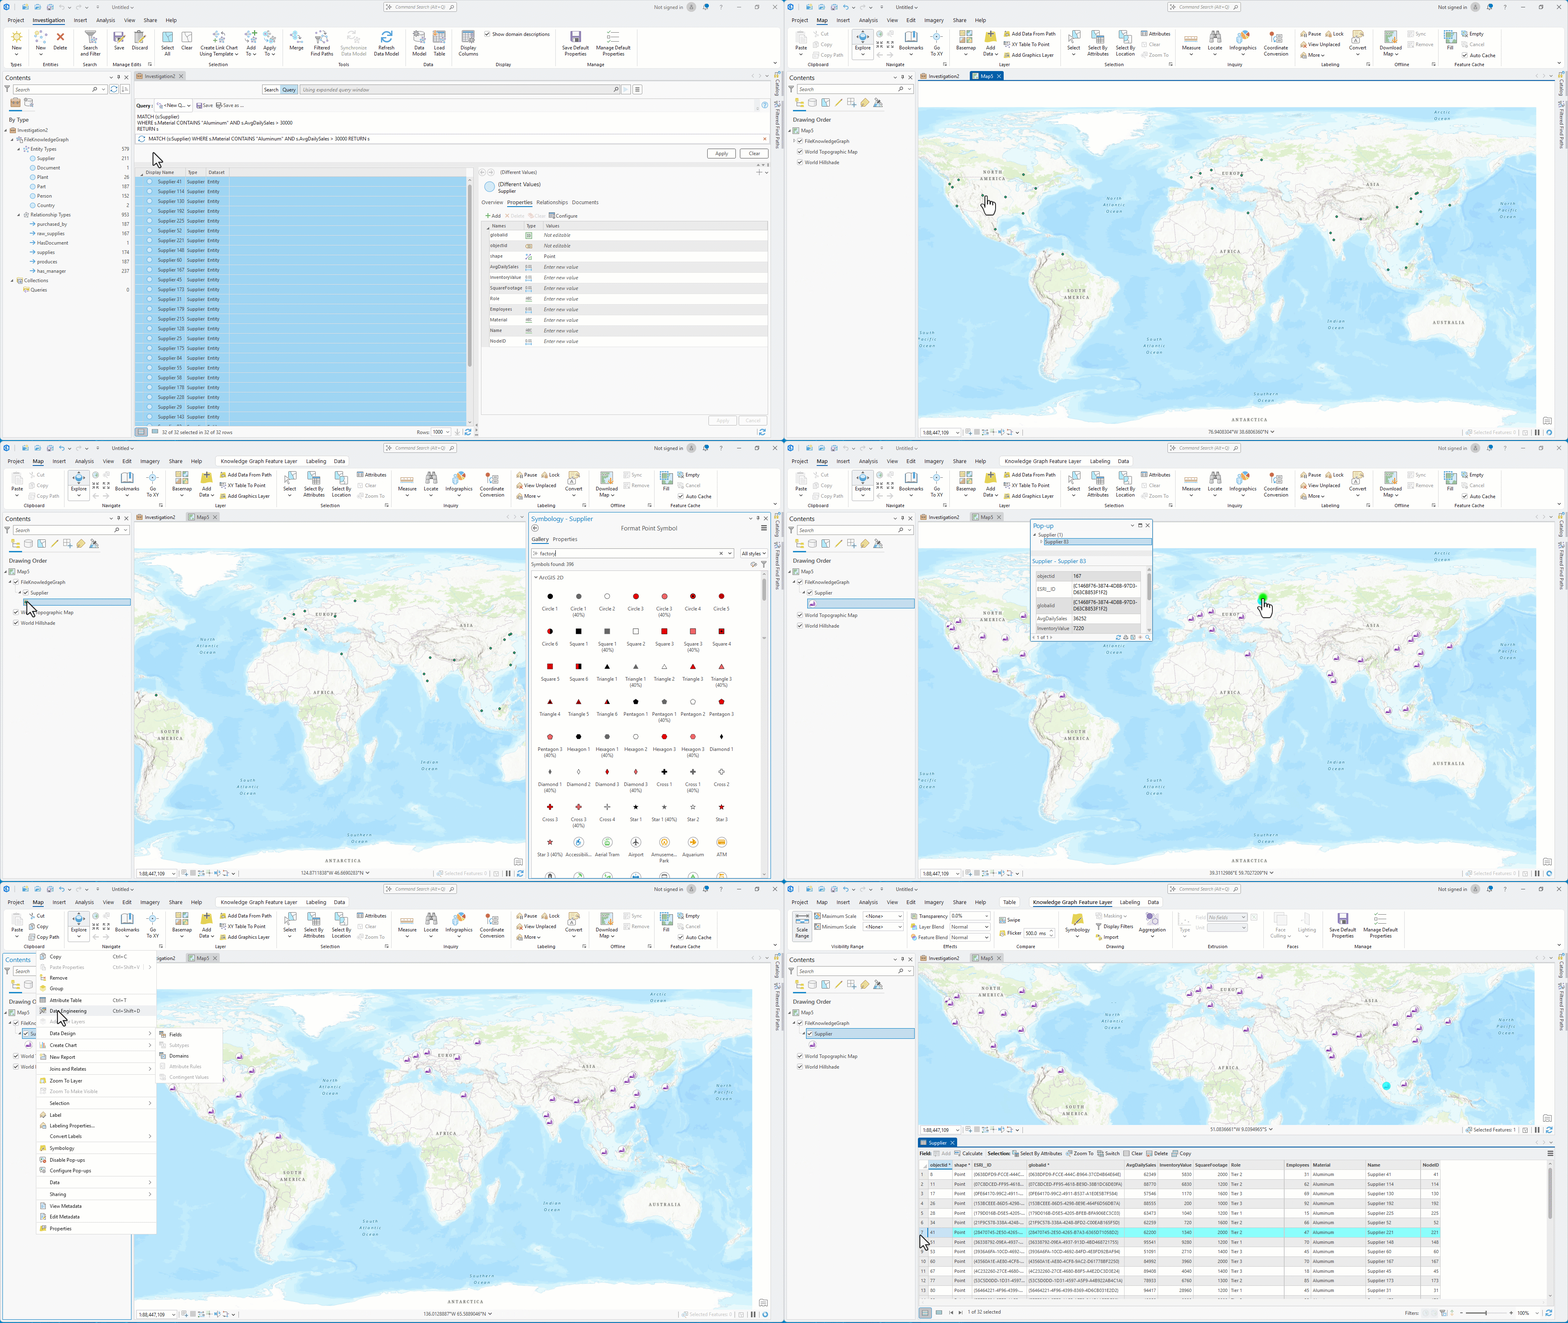
Knowledge graph content can also be used in spatial analysis workflows. Because knowledge graph feature layers and tables work with ArcGIS Pro geoprocessing tools, you can combine graph relationships with traditional GIS analysis. This allows you to move beyond understanding how entities are connected and begin exploring where those connections matter.
Explore connected data with link charts
While maps can help you understand where things are located, link charts can help you understand how things are connected. A link chart provides a visual representation of the entities and relationships in your knowledge graph, making it easier to explore complex networks that would be difficult to understand from tables or lists alone. Entities appear as nodes and relationships appear as connections, allowing you to quickly see how information flows through a system.
For a supply chain investigation, a link chart might show how suppliers, parts, manufacturers, and distribution centers are connected. As you explore the network, patterns begin to emerge. You may discover that multiple products depend on the same supplier, identify key organizations that connect different parts of the network, or uncover dependencies that weren’t immediately obvious.
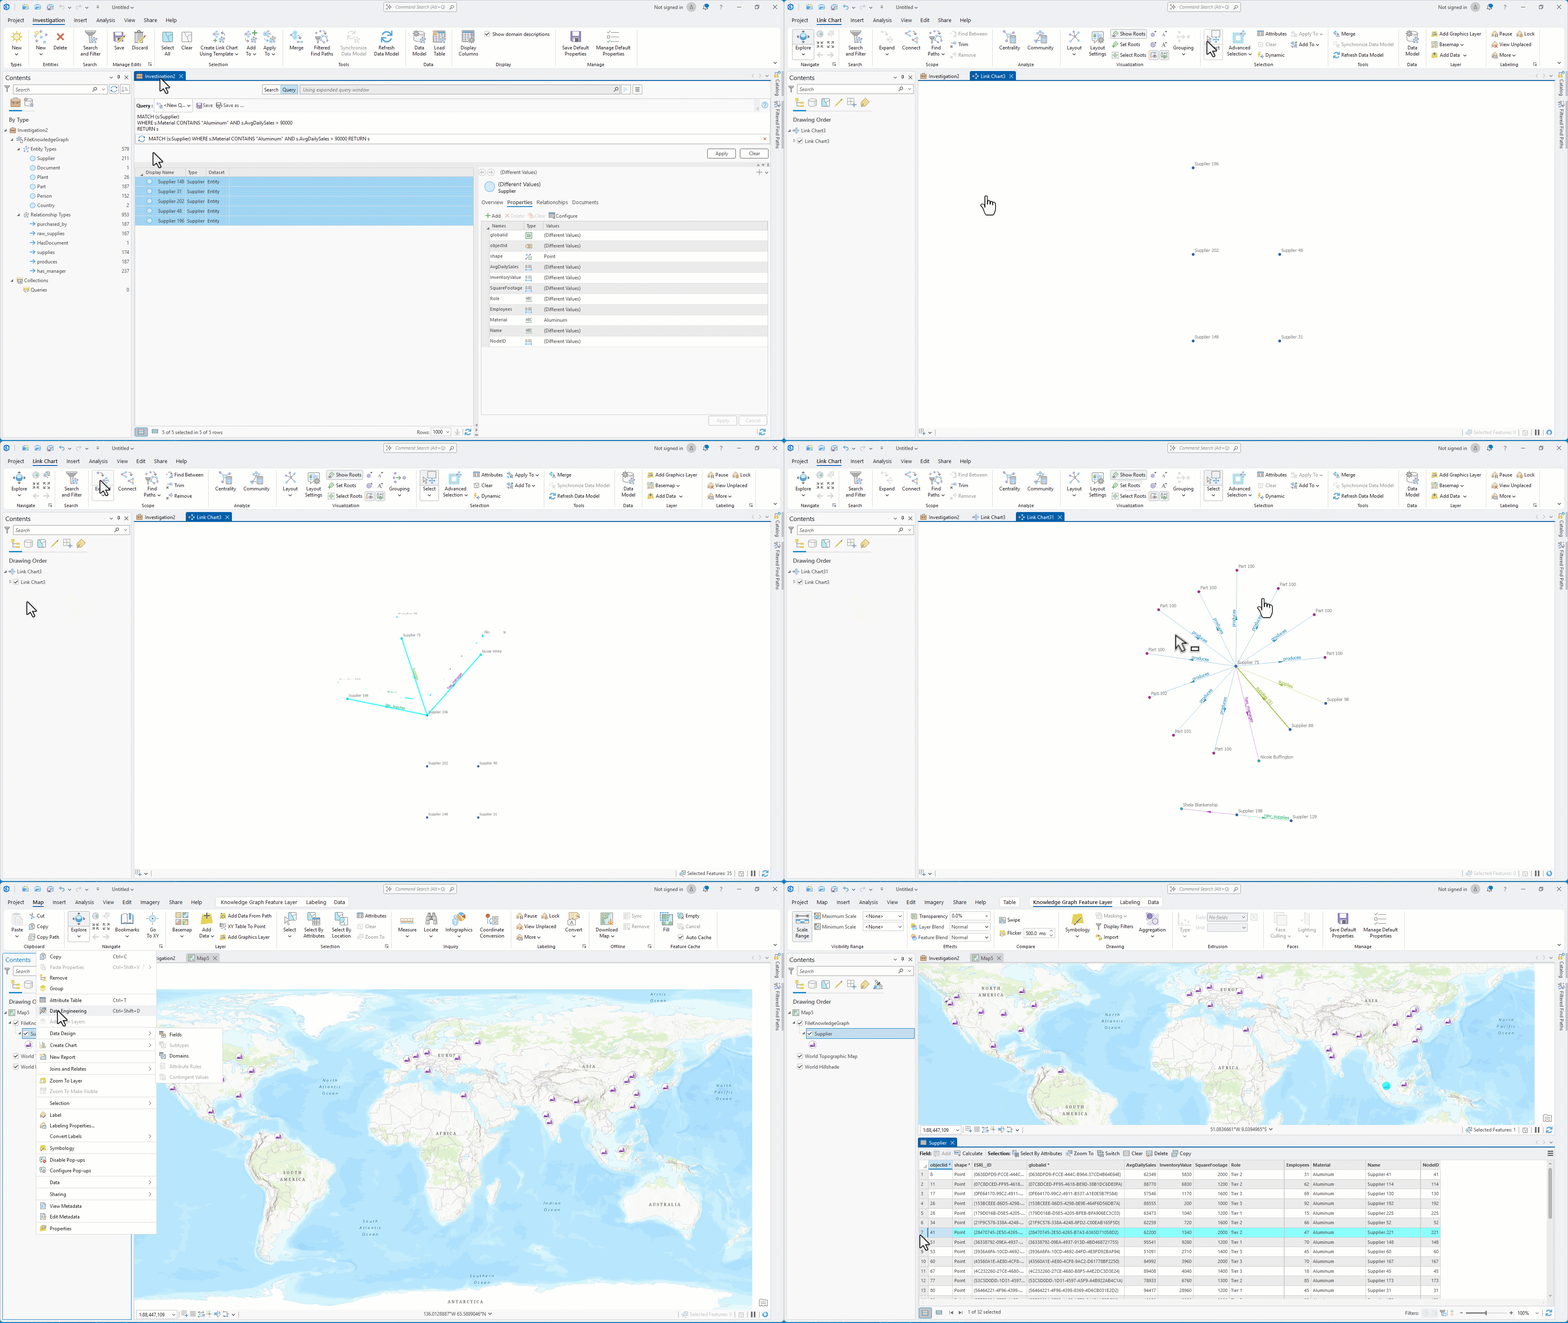
Link charts are a powerful visualization tool, you can expand relationships, search for connected entities, apply layouts, and focus on specific portions of the network as new questions arise. Rather than examining records one at a time, you’re exploring the broader system and the relationships that drive it. But they are more than just visualization. Link charts are an analytical workspace where you can trace paths through your connected data, determine importance of entities within your network, and find hidden connections that are not always obvious.
Find Hidden Connections with Filtered Find Paths
One of the strengths of a knowledge graph is its ability to uncover connections that aren’t immediately visible. However, it can be a struggle to write complex queries, or your link chart contains far too many connections to be helpful. That’s where Find Paths and Filtered Find Paths can be useful.
Imagine you’re investigating a supplier disruption and want to understand whether a manufacturing plant could be affected. The supplier and plant may already be in your link chart, but the dependencies between them aren’t obvious. Running Find Paths searches the graph for the shortest connection paths between the selected entities and automatically adds the missing entities and relationships to the link chart. What was once a disconnected set of entities becomes a visible dependency chain.
Of course, large networks often contain many possible paths. A supplier may connect to a plant through multiple manufacturers, distributors, or logistics providers. That’s where Filtered Find Paths becomes especially useful. Instead of looking for every possible connection, you can focus on the paths that matter to your investigation. For example, you can:
- Include or exclude specific entity and relationship types
- Require paths to pass through a specific entity
- Limit results using property values
- Control path length and direction
In our supply chain example, you might want to understand which suppliers a specific plant depends on for steel parts. By applying filters, you can narrow the analysis to just the relevant suppliers, parts, and relationships instead of examining the entire network.
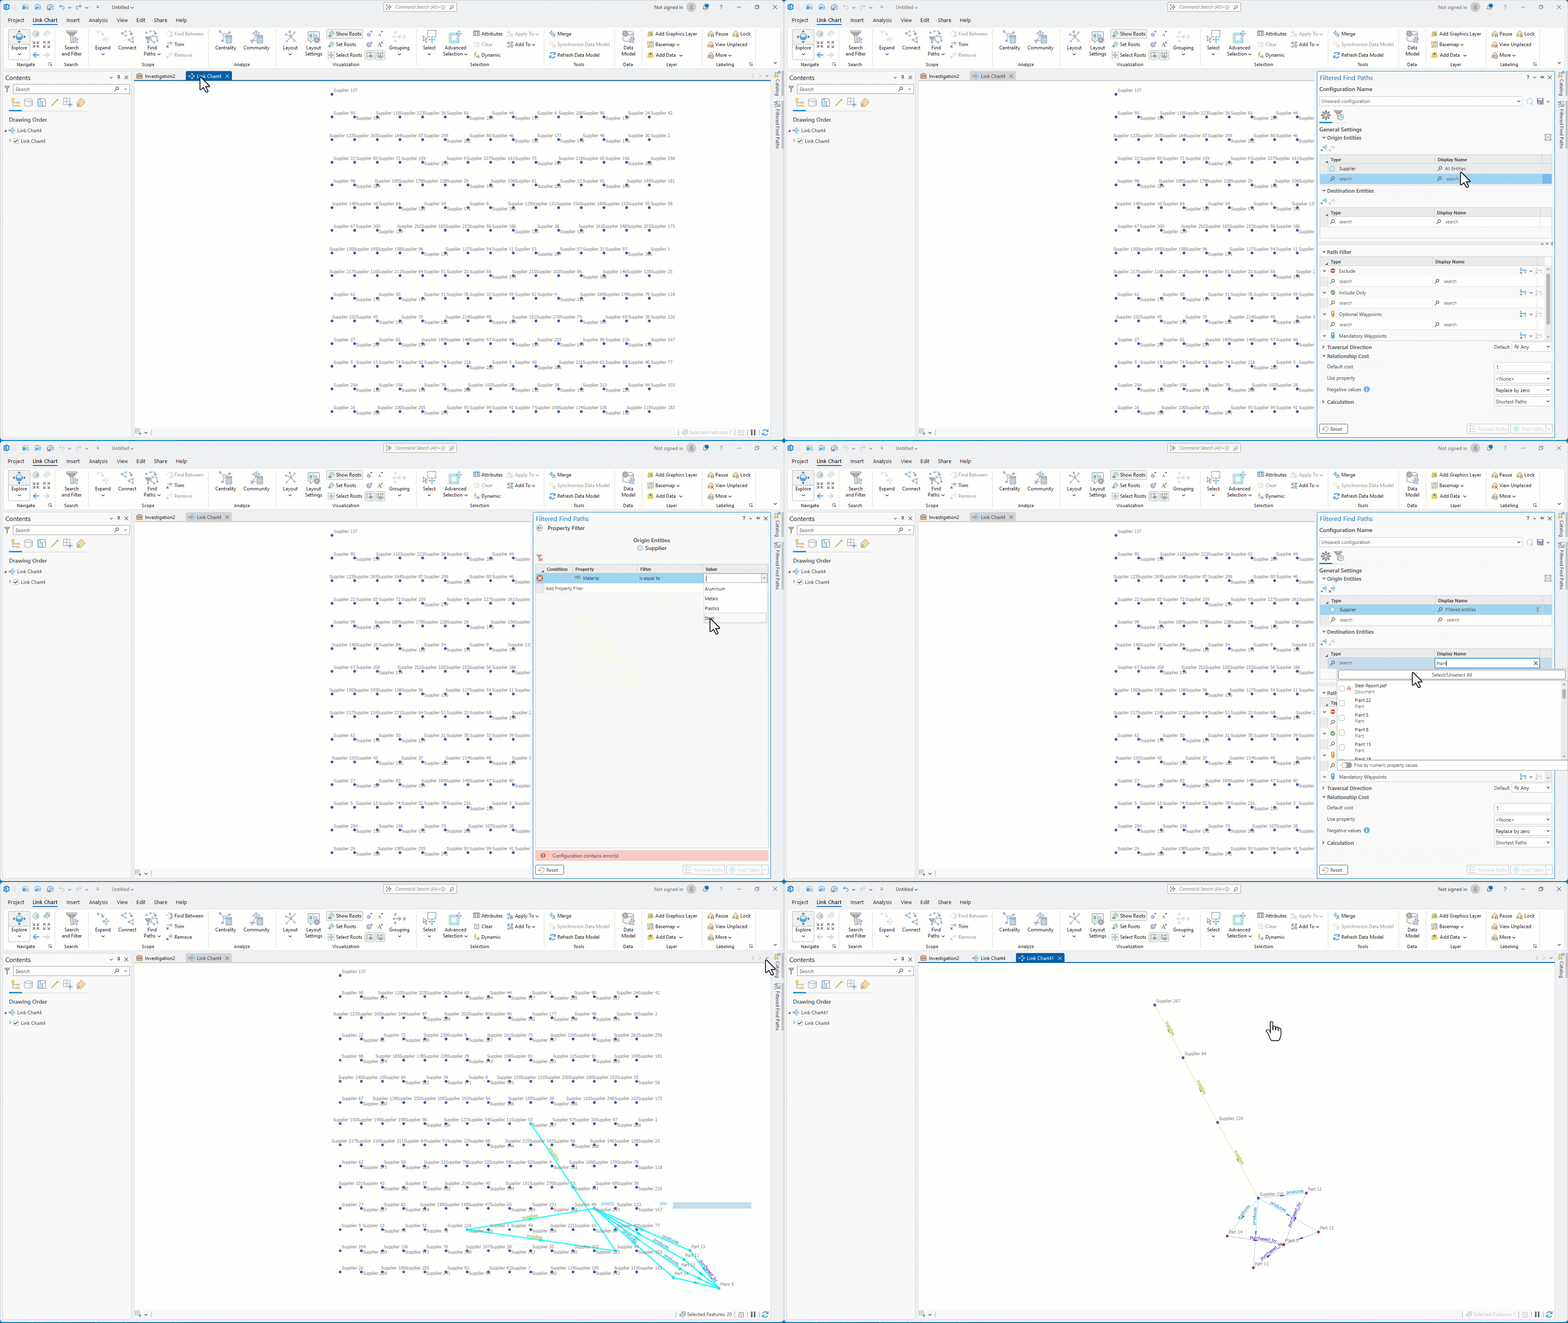
This is where link charts become more than a visualization tool. They become an analytical workspace where you can investigate connected data, test assumptions, and uncover hidden dependencies. Combined with maps, you can also examine the geographic side of those connections, helping you understand not only how entities are connected, but where those connections matter most.
Getting Started with File Knowledge Graphs
In this two-part series, we’ve explored how file knowledge graphs bring graph analytics into ArcGIS Pro. From building a data model to exploring networks in link charts, visualizing entities on maps, running openCypher queries, and uncovering hidden dependencies with Filtered Find Paths. Each provides a different way to understand connected systems.
One of the biggest advantages of ArcGIS Knowledge is that it combines graph analysis and GIS in a single environment. You can investigate relationships, identify patterns, and trace dependencies while also considering the geographic context behind those connections. The result is a richer understanding of both how entities are connected and where those connections matter.
File knowledge graphs make these capabilities especially approachable. Because they run entirely within ArcGIS Pro, you can build data models, explore connected data, and learn graph workflows without deploying additional infrastructure. If you haven’t tried them yet, now is a great time to explore file knowledge graphs in ArcGIS Pro. Create a simple data model, load some connected data, and start investigating. You may be surprised by the patterns and relationships that emerge when you view your data as a connected system rather than a collection of individual records.
Resources
Be sure to check out additional resources to get started with ArcGIS Knowledge and file knowledge graphs.
- Learn more about getting started with ArcGIS Knowledge.
- Gain first-hand experience in creating a knowledge graph in ArcGIS Pro: try the ArcGIS Knowledge tutorial.



Article Discussion: