The December 2024 Broadband Data Collection (BDC) is now available within ArcGIS Living Atlas. This ready-to-use layer shows fixed broadband availability for every Census Block and H3 Resolution-8 hexagonal area in the U.S. and outlying territories. The layer summarizes the June 2024 BDC data showing the number of served, underserved, and unserved Broadband Serviceable Locations (BSLs) in total and by transmission technology for a given geography. It is a composite of six sublayers – State, County, Tract, Block Group, Block, and H3 Resolution-8 hexagons – each with a related table listing all Internet Service Provider (ISP) offerings by technology and speed tier.
About the BDC in Living Atlas
The Broadband Data Collection (BDC) is a combination of two datasets. The Broadband Serviceable Location Fabric (“Fabric”) are the point locations “where fixed broadband internet is or could be installed.” And the Broadband Availability Data is the list of all available broadband services available at each Fabric location as reported by internet service providers (ISPs). The Federal Communications Commission (FCC) updates the BDC twice a year.
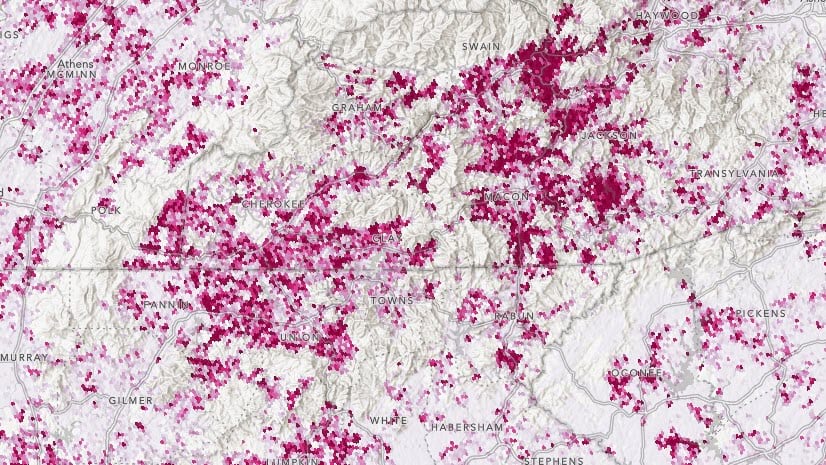
The BDC layers in Living Atlas are summary aggregations of these two datasets. They show the total number of Broadband Serviceable Locations (BSLs) for six geographies – H3 Resolution 8 Hexagon, Census Block, Block Group, Tract, County, and State – and their corresponding service tier.
The service tier is defined by speed and latency and each BSL is categorized into one of three buckets:
- Served – low-latency Fiber, Cable, Copper, or Licensed Terrestrial Fixed Wireless offering of speeds greater than or equal to 100/20 Mbps.
- Underserved – low-latency Fiber, Cable, Copper, or Terrestrial Licensed Fixed Wireless offering of speeds less than 100/20 Mbps, but greater than or equal to 25/3 Mbps.
- Unserved – all service that is not low-latency or less than 25/3 Mbps, and all Geostationary Satellite, Non-geostationary Satellite, Unlicensed Terrestrial Fixed Wireless, and Other.
Each layer includes a related table that captures information on every unique broadband service offering for all providers.
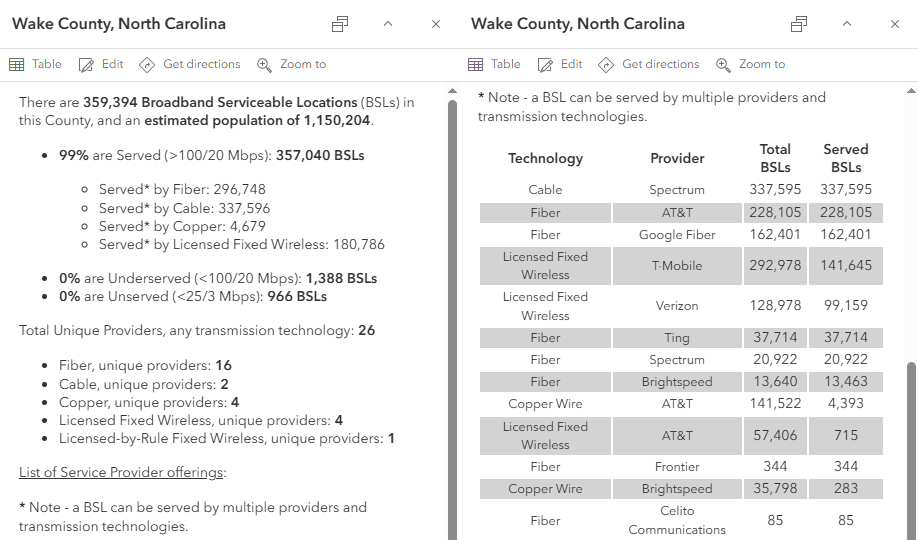
This distinction is best captured in the layer popup. In the image below, the popup section on the left shows the summary statistics for the feature. These are the attributes the layer can be visualized on. The default symbology for the layer is the combination of unserved and underserved locations. On the right, the popup shows a table entry for every unique provider and transmission technology combination, with the number of BSLs passed (with any speeds), and the number of BSLs passed with service of at least 100/20 mbps.
For more information about the Broadband Data Collection in ArcGIS Living Atlas of the World, please see this blog article.
What’s new with this update?
The biannual updates for the June and December Broadband Data Collection will happen in this new layer going forward. The previous vintage layer is being retired so it is encouraged to switch any existing maps, apps, or other projects to the updated version.
What is the yearly change in served and underserved/unserved BSLs?
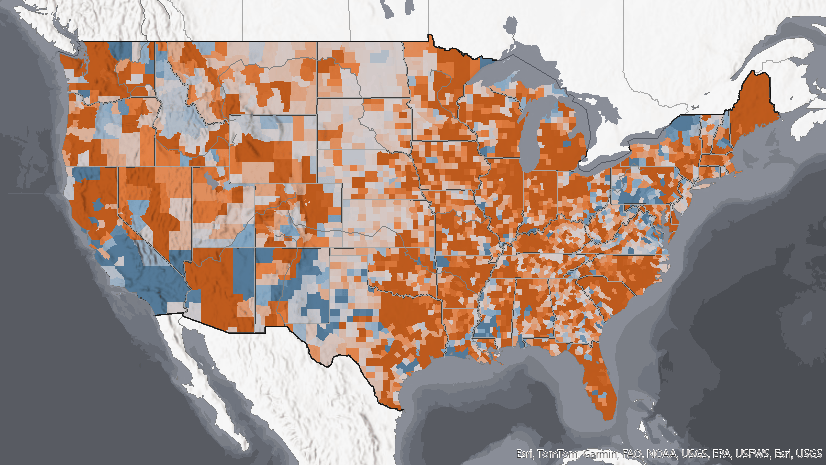
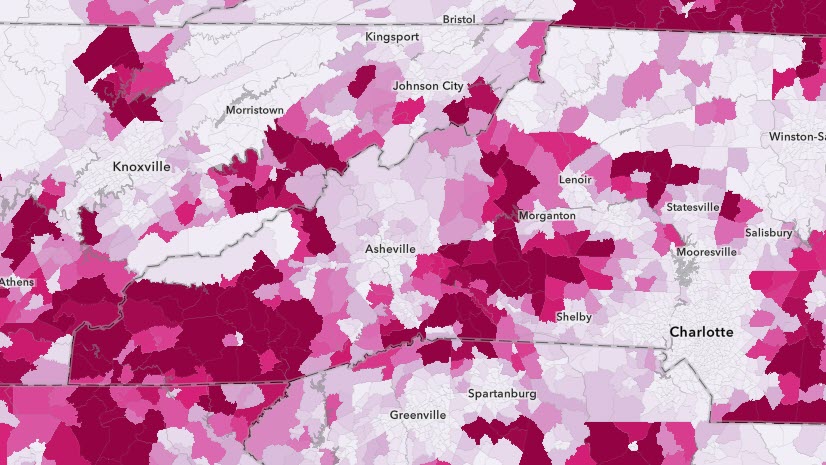
Click on the maps below to open the web maps in a new tab in your browser. These maps help better understand whether broadband accessibility in an area is getting more accessible (higher percent BSLs served), or less accessible (higher percent BEAD eligible BSLs).
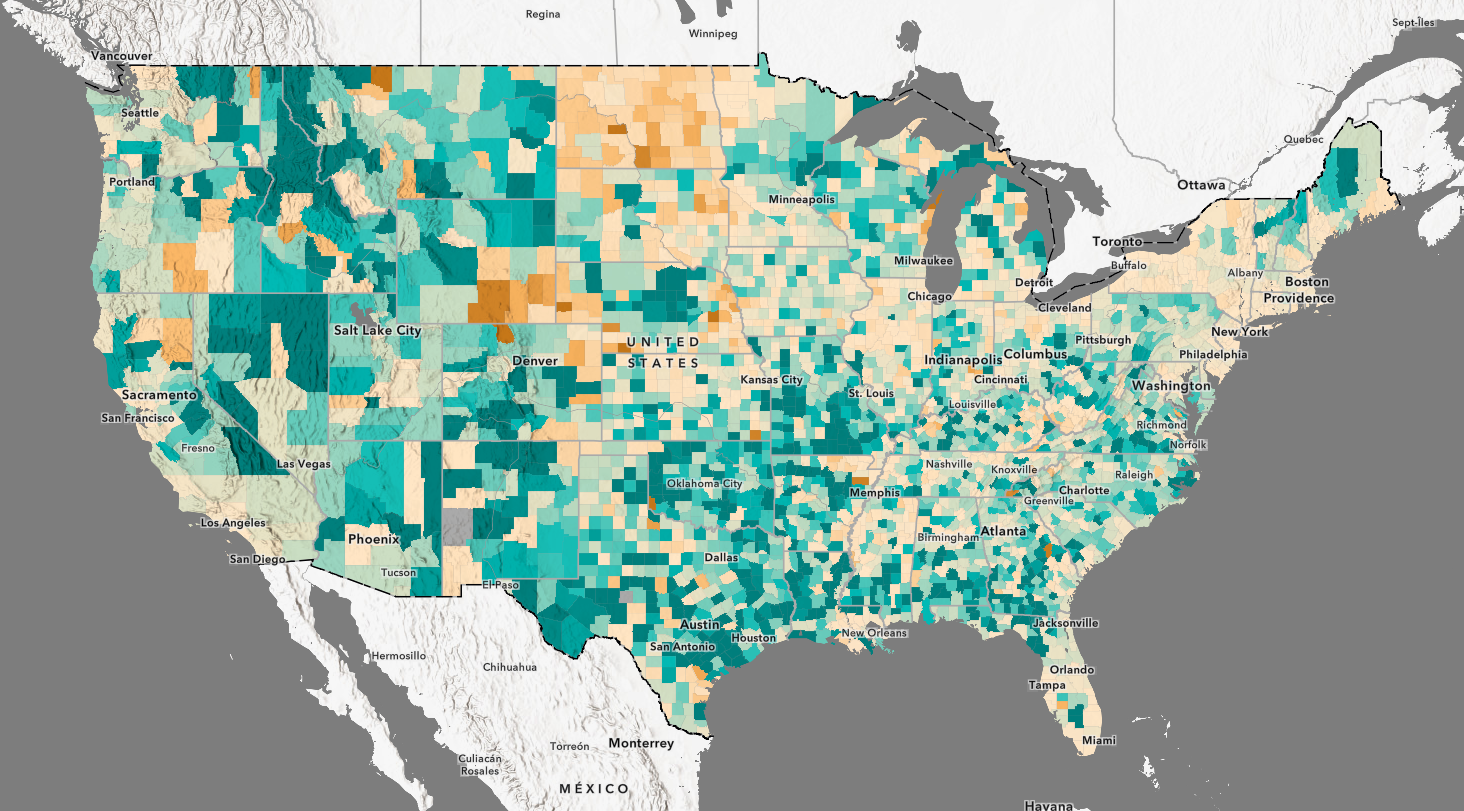
What is the yearly percentage change in served Broadband Serviceable Locations (BSLs)?
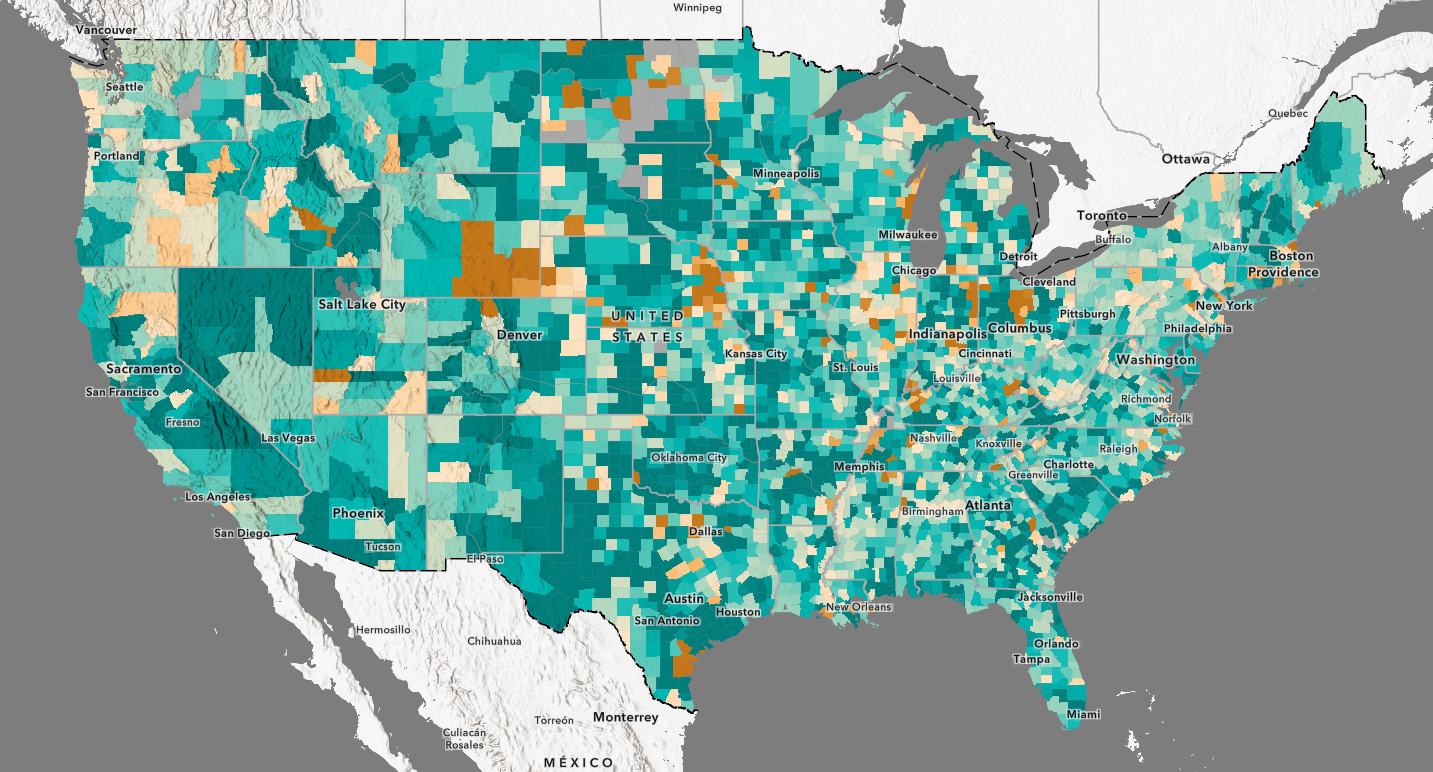
What is the yearly percentage change in BEAD Eligible Broadband Serviceable Locations (BSLs)?
Frequently Asked Questions about BSLs:
Some common user questions we get about this layer are:
- Q: What are/are not considered BSLs?
- A: A broadband serviceable location (BSL) is “a business or residential location in the United States at which mass-market fixed broadband Internet access service is, or can be, installed.” Residential BSLs include all residential structures, including structures that are (or contain) housing units or group quarters (as those terms are defined by the United States Census Bureau). Business BSLs include all non-residential (business, government, non-profit, etc.) structures that are on property without residential locations and that would be expected to demand mass-market, non-enterprise-grade Internet access service.
- For a detailed list of what is and is not a BSL, view this link from the FCC.
- Q: Are there populated areas that are not considered BSLs?
- A: Yes, community anchor institutions (CAIs) such as schools, libraries, and medical care facilities, are more likely to subscribe to customized, enterprise-grade internet service (as opposed to mass-market internet service), may be included in the Fabric, but are flagged as not BSLs. For example, universities with student housing will have population, but will not be flagged as a BSL.
- View this link to How to Identify a Community Anchor Institution as a Broadband Serviceable Location.
- Q: Can BSLs be undercounted?
- A: Yes, due to a few reasons. There can be data reporting gaps from providers, definition and identification Challenges such as new residential developments, apartment complexes, or multi-dwelling units might not be fully counted. Addresses can be outdated or have incomplete address information.
In closing
The importance of the Broadband Data Collection and the underlying serviceable location Fabric cannot be overstated. Literally hundreds of millions of dollars will be allocated based on this data. State and Local governments, internet service providers, and all communities of interest, have a financial incentive to ensure the FCC maps are accurate.
We are excited to make this data available for use in your broadband mapping efforts. As we have done in the past, this data will be updated as new BDC updates are released. You will need to change to this service if your maps pointed to the previous version, but going forward it will be reflected in this item and the item details page will reflect the data currency.
We look forward to seeing your great work and welcome any feedback on how this data can be improved to meet your needs.
Happy Broadband Mapping!


Article Discussion: