In November 2021 the U.S. Congress declared that “access to affordable, reliable, high-speed broadband is essential to full participation in modern life in the United States” (source). Indeed, broadband is critical to modern life. Broadband provides opportunity for exchange and commerce, it allows people more affordable and efficient access to basic amenities such as education, health care, public safety, and government services, and it is the foundation for Smart Cities and transportation networks.
At the start of the COVID-19 pandemic, as many things in our daily lives were going virtual, Esri published the Federal Communications Commission (FCC) Form 477 broadband availability data to ArcGIS Living Atlas of the World to help communities better understand the implications of work from home (WFH), remote learning, telehealth, and all the other aspects of our lives that suddenly went virtual. Over the three years since, we have continued to update the data and add additional curated broadband content.
Today, we are excited to announce the addition of the FCC Broadband Data Collection (BDC) in Living Atlas. This layer shows fixed broadband availability for every neighborhood in the U.S. and outlying areas. It summarizes the June 2022 BDC data showing the number of served, underserved, and unserved Broadband Serviceable Locations (BSLs) by transmission technology in a given geography. It is a composite of six sublayers – State, County, Tract, Block Group, Block, and H3 Resolution-8 hexagonal areas – with adjacent scale ranges, each with a related table listing all provider service offerings in a geography.
This blog will describe the significance of this data and how it can be used by used by communities to improve broadband connectivity.
The Broadband DATA Act
In March 2020 Congress passed the Broadband Deployment Accuracy and Technological Availability Act, or the Broadband DATA Act. The bill required the Federal Communications Commission (FCC) to fundamentally change the way broadband data was collected, verified, and reported.
Specifically, the bill required the FCC to collect and disseminate more granular broadband availability data. To do this, the FCC was required to establish the Broadband Serviceable Location Fabric as the vehicle for reporting broadband service availability data, also known as the Broadband Data Collection (BDC). The Fabric is a dataset of geocoded information for all broadband service locations (BSLs), atop which ISP reported broadband availability data, the BDC, is overlaid. The BDC requires fixed wireline and satellite providers to submit a list of locations or a polygon shapefile of their service territories by speeds, latency, and transmission technologies.
Additionally, the FCC was required to establish a challenge process to enable the submission of independent data challenging the accuracy of FCC broadband maps, and to conduct regular audits of information submitted by providers. Communities, individuals, and providers have the ability to challenge the BSL Fabric, as well as the reported service available at those locations. Validating and continually improving these broadband data is critical to closing the digital divide.
The Broadband Data Collection (BDC)
On November 17, 2022, the FCC released the updated National Broadband Map. While the Broadband Serviceable Location Fabric is a licensed dataset and not publicly available, the Broadband Data Collection is publicly available for download. The files contain records of the locations that providers reported making fixed broadband service available to as-of June 30, 2022. The files include, for each location, the service availability data reported by each provider, as well as the census block and H3 resolution-8 hexagon within which the location falls.
Esri has summarized this data to show the number of BSLs in a given geography by their corresponding speed tier. The speed tier is defined by speed and latency and is bucketed into three categories.
- A BSL is considered served if it has a low-latency Fiber, Cable, Copper, or Licensed Terrestrial Fixed Wireless offering of speeds greater than or equal to 100/20 Mbps.
- A BSL is considered underserved if it has a low-latency Fiber, Cable, Copper, or Terrestrial Licensed Fixed Wireless offering of speeds less than 100/20 Mbps, but greater than or equal to 25/3 Mbps.
- In all other cases, for all other transmission technologies (Geostationary Satellite, Non-geostationary Satellite, Unlicensed Terrestrial Fixed Wireless, and Other), and all service that is not low-latency, a BSL is considered unserved.
In addition to overall BSL speed tier counts, each geography contains served, underserved, and unserved attributes pertaining specifically to low-latency Fiber, Cable, Copper, and Licensed Terrestrial Fixed Wireless (including when the transmission technology is unavailable at that BSL).
Each geography also has a related table containing records summarizing available service, including provider name, transmission technology, and the number of BSLs where it’s offered. There are also served, underserved, and unserved BSL counts, but they are purely speed-based.
About the data
The BDC data in Living Atlas is richly attributed and ready for your broadband mapping needs. By default, the data is symbolized by the number of “BEAD Eligible BSLs”. BEAD refers to the $42.5 billion Broadband Equity, Access, and Deployment Program that was passed as part of the 2021 Infrastructure Investment and Jobs Act (IIJA). A Broadband Serviceable Location (BSL) is eligible for funding if it is either unserved (< 25/3 mbps) or underserved (< 100/20 mbps). This will help identify areas eligible for funding under the BEAD program. It can also be used to identify areas where broadband availability is overstated, and where challenge evidence is required to make them available for funding.
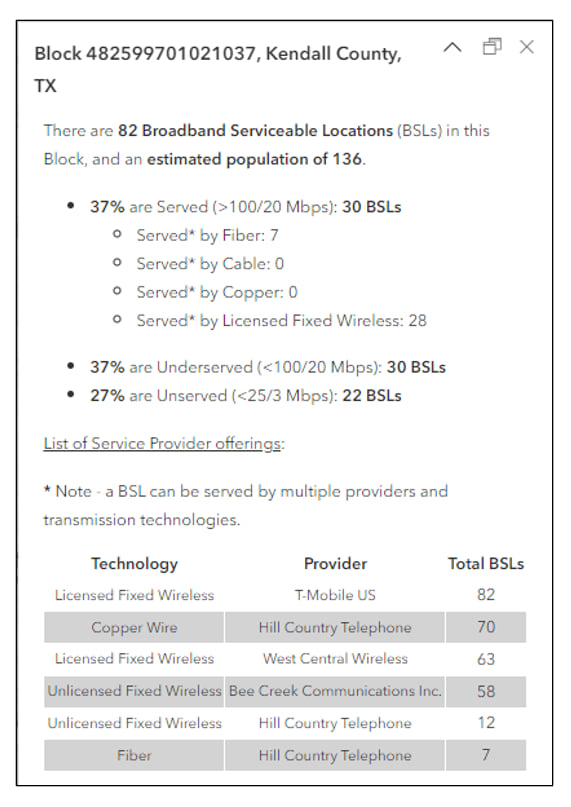
The pop-ups are configured to show the breakdown of Broadband Serviceable Locations by speed tier. They give the total number of BSLs, the FCC 2021 population estimate, and the percent and number of BSLs that are Served, Underserved, and Unserved. Additionally, the popup pulls the individual provider information from the related table to list the total number of BSLs served (at any speed tier) in that geography. By default, the list is filtered to exclude Geostationary Satellite and Non-geostationary Satellite, but those numbers are available if desired. While not included in the default pop-up, the related records do contain the BSL speed tier breakdown.
Understanding what this data says about broadband availability in your community is an important first step towards providing adequate and affordable broadband for all. It highlights areas that are unserved or underserved, and therefore eligible for funding. It also provides focus for the collection of challenge data where it is needed to contest where BDC overstates availability and therefore help an area become eligible. To be certain, this data can serve as a foundation for your community’s broadband map, and assist with both availability and location challenges.
In closing
The importance of the Broadband Data Collection and the underlying serviceable location Fabric cannot be overstated. Literally hundreds of millions of dollars will be allocated based on this data. State and Local governments, internet service providers, and all communities of interest, have a financial incentive to ensure the FCC maps are accurate.
We are excited to make this data available for use in your broadband mapping efforts. As we have done in the past, this data will be updated as new BDC updates are released. You will not need to change the service your maps point to, it will be reflected in this item and the item details page will reflect the data currency.
We look forward to seeing your great work and welcome any feedback on how this data can be improved to meet your needs.
Happy Broadband Mapping!

Article Discussion: