Millions of Americans do not have reliable or affordable high-speed internet. Depending on the source, the estimated number of households without access is anywhere between 24 million and 42 million households. Considering that households can have multiple residents in need of the internet, Microsoft estimates that over 160 million people do not use the internet at broadband speeds. This disparity is commonly referred to as the Digital Divide, and has interested policymakers, telecommunication companies, not for profits focused on equity, and many others. To overcome these staggering numbers, various policy initiatives have been put in place or proposed over the years to expand broadband availability.
Most recently, the American Rescue Plan of 2021 includes $360 billion dollars for state and local governments which can be used to expand broadband access and adoption. The Act allows the U.S. Department of Treasury to distribute funds directly to state, county, and local governments to be used to invest in infrastructure for addressing the digital divide.
Similarly, the Consolidated Appropriations Act of 2021 offers a rare opportunity to use Federal funding to subsidize device and broadband availability for lower-income communities and digital navigation programs. For example, the Emergency Broadband Benefit Program was put in place to administer $3.2 billion dollars to help low-income households and veterans access the internet during the COVID-19 pandemic.
There are many other successful broadband initiatives and emerging policies that exist such as NTIA’s BroadandUSA program and USDA’s ReConnect Loan and Grant Program. The FCC’s Rural Digital Opportunity Fund has allocated $9.2 billion to bring broadband to rural areas, and additional phases of funding are planned to further these efforts. Throughout the nation, there are billions of dollars available in funding for federal, state, local, and tribal governments, industry, and nonprofits that aim to enhance broadband connectivity and promote digital inclusion.
But where will policy-allocated funding make the greatest impact?
These are just a few examples of broadband-related policies, but many agencies and policymakers are asking this same question. As any GIS professional will tell you, the most effective way to distribute resources is to use the power of location. Recognizing where there is need by mapping the important aspects can often be the first step to success. In order to find the areas of need first requires spatial data to be accessible.
This blog will cover a few ways to approach broadband and policy from a GIS perspective:
- Find content in Living Atlas
- Emphasize areas of need
- Explore and share content with Esri Maps for Public Policy
- Nominate your content
Find content in Living Atlas
As described in this blog and this story map by my colleague Patrick Ryan, there are many different spatial layers available in ArcGIS Living Atlas of the World which can be used to map broadband availability. These cover a wide range of topics related to broadband, equity, accessibility, infrastructure, and more. Let’s explore some of the crucial layers which can be used to assess broadband need throughout the US.
FCC layers
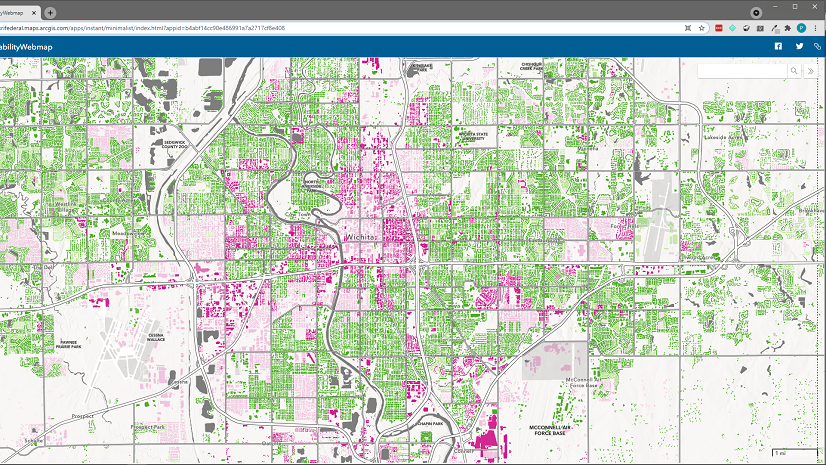
For example, the FCC layers provide a “broadband score” based on the availability of broadband offerings and their speeds. The data offered by the FCC helps us determine if an area is served or unserved according to the minimum standard of 25 megabits per second (Mbps) download and 3 Mbps upload. This is offered as a layer in Living Atlas at multiple geography levels: states, counties, tracts, block groups, and blocks.
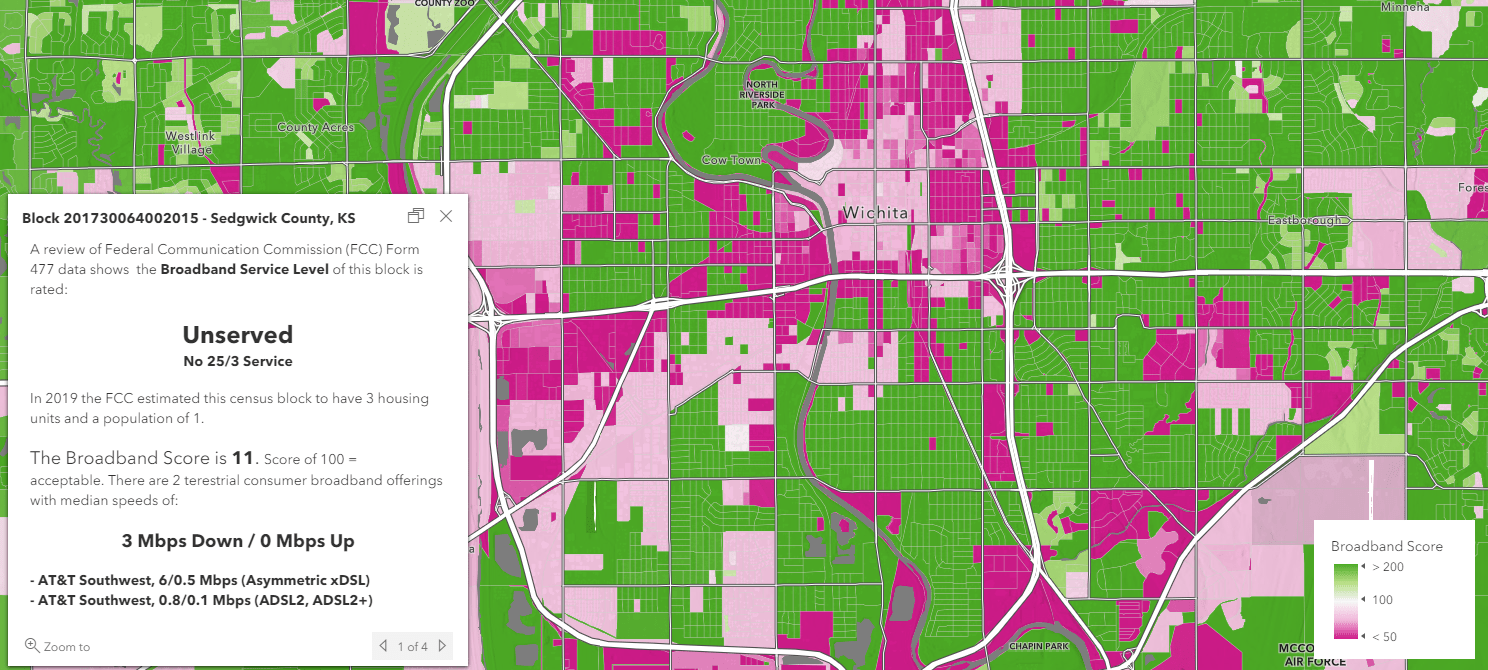
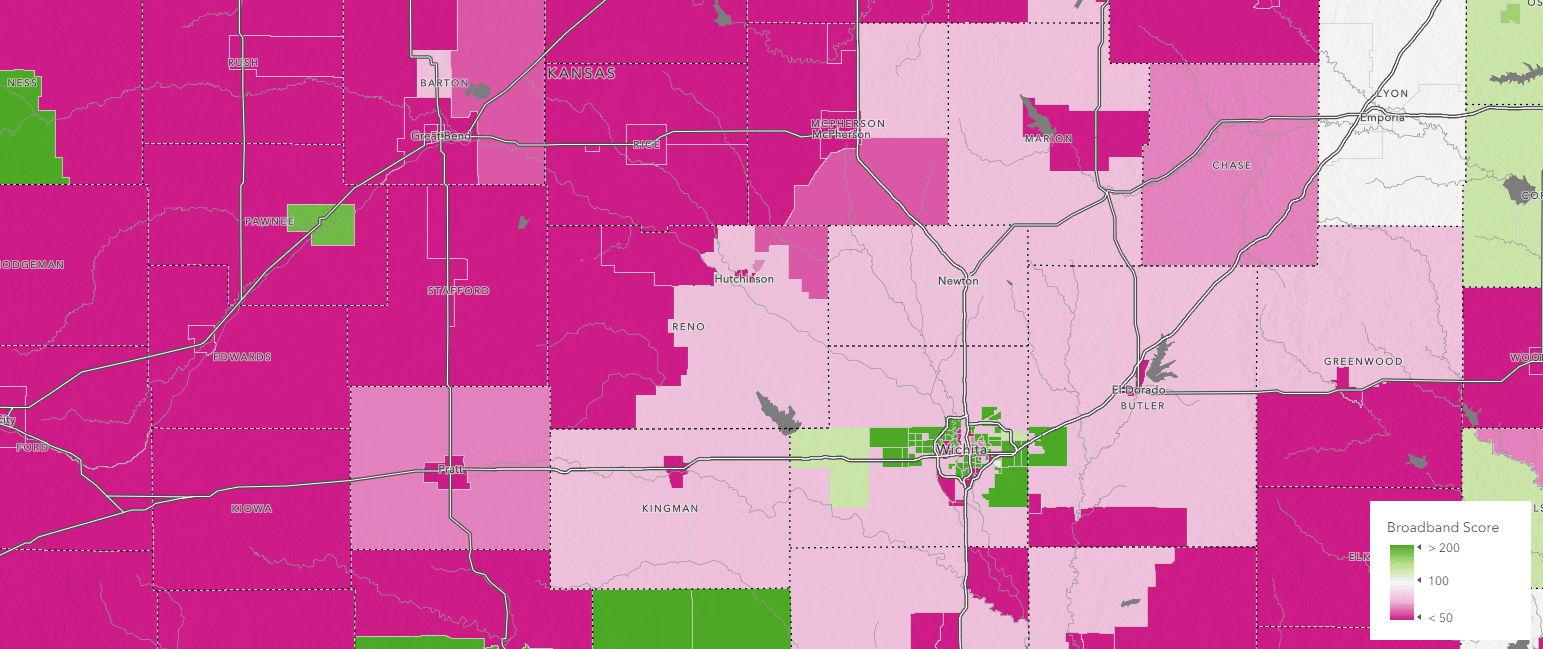
Detailed block level data helps us differentiate neighborhood-by-neighborhood where there is need for improvement within cities. Looking at the tract level helps us identify the digital divide by highlighting how broadband availability quickly falls off when you move outside of a city into more rural areas. This layer helps us quickly identify areas of need, which can help us direct resources toward the areas that need broadband the most. The ability to see the rural/urban divide can help determine eligibility for policies such as the A-CAM program or the Rural Digital Opportunity Fund.
While this data helps us quickly identify areas of need, there are additional datasets and tools to help validate the accuracy of this data at local levels, especially in low density areas. To learn more about this, refer to this blog.
Ookla Speedtest
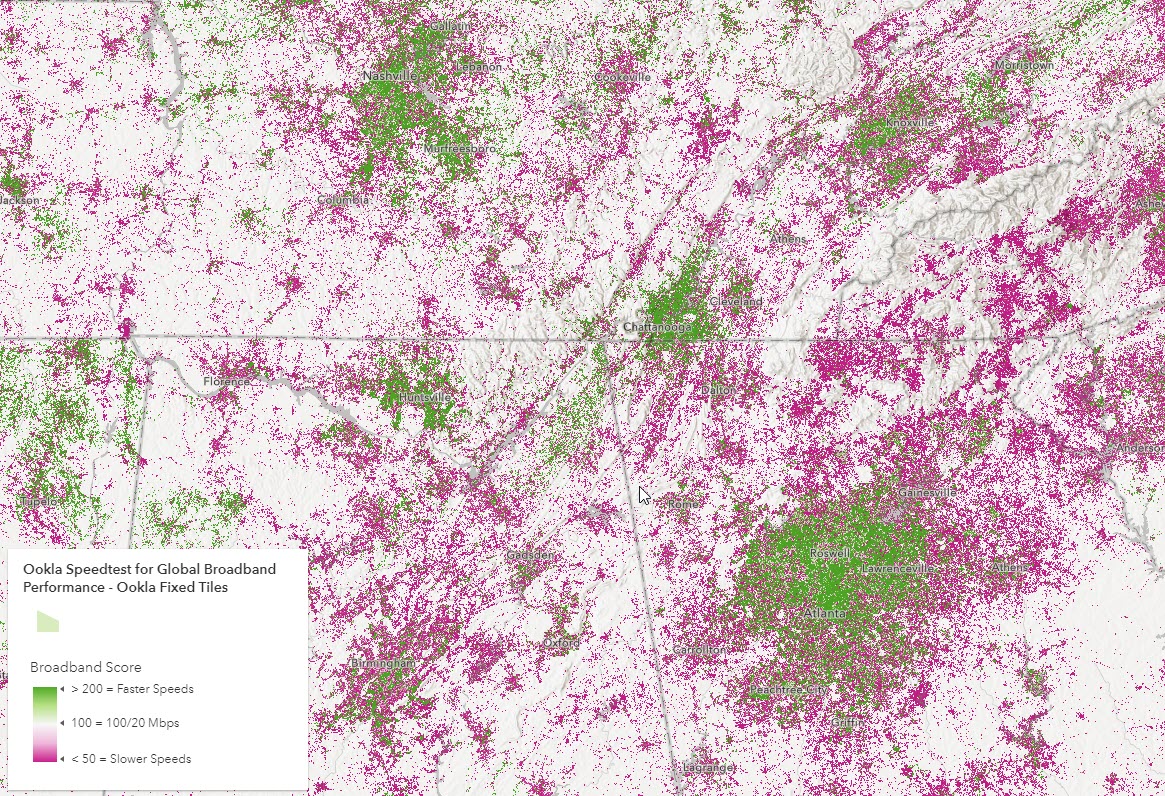
Speedtest data is used today by commercial fixed and mobile network operators around the world to inform network buildout, improve global Internet quality, and increase Internet accessibility. Government regulators such as the United States Federal Communications Commission and the Malaysian Communications and Multimedia Commission use Speedtest data to hold telecommunications entities accountable and direct funds for rural and urban connectivity development. Ookla licenses data to NGOs and educational institutions to fulfill its mission: to help make the internet better, faster and more accessible for everyone. Ookla hopes to further this mission by distributing the data to make it easier for individuals and organizations to use it for the purposes of bridging the social and economic gaps between those with and without modern internet access.
Hundreds of millions of Speedtests are taken on the Ookla platform each month. In order to create a manageable dataset, the raw data is aggregated into tiles. These tiles use a similar broadband score as shown above in the FCC layers, offered by Mobile and Fixed speedtests.
Click here to access this layer and learn more about it.
American Community Survey (ACS) layers
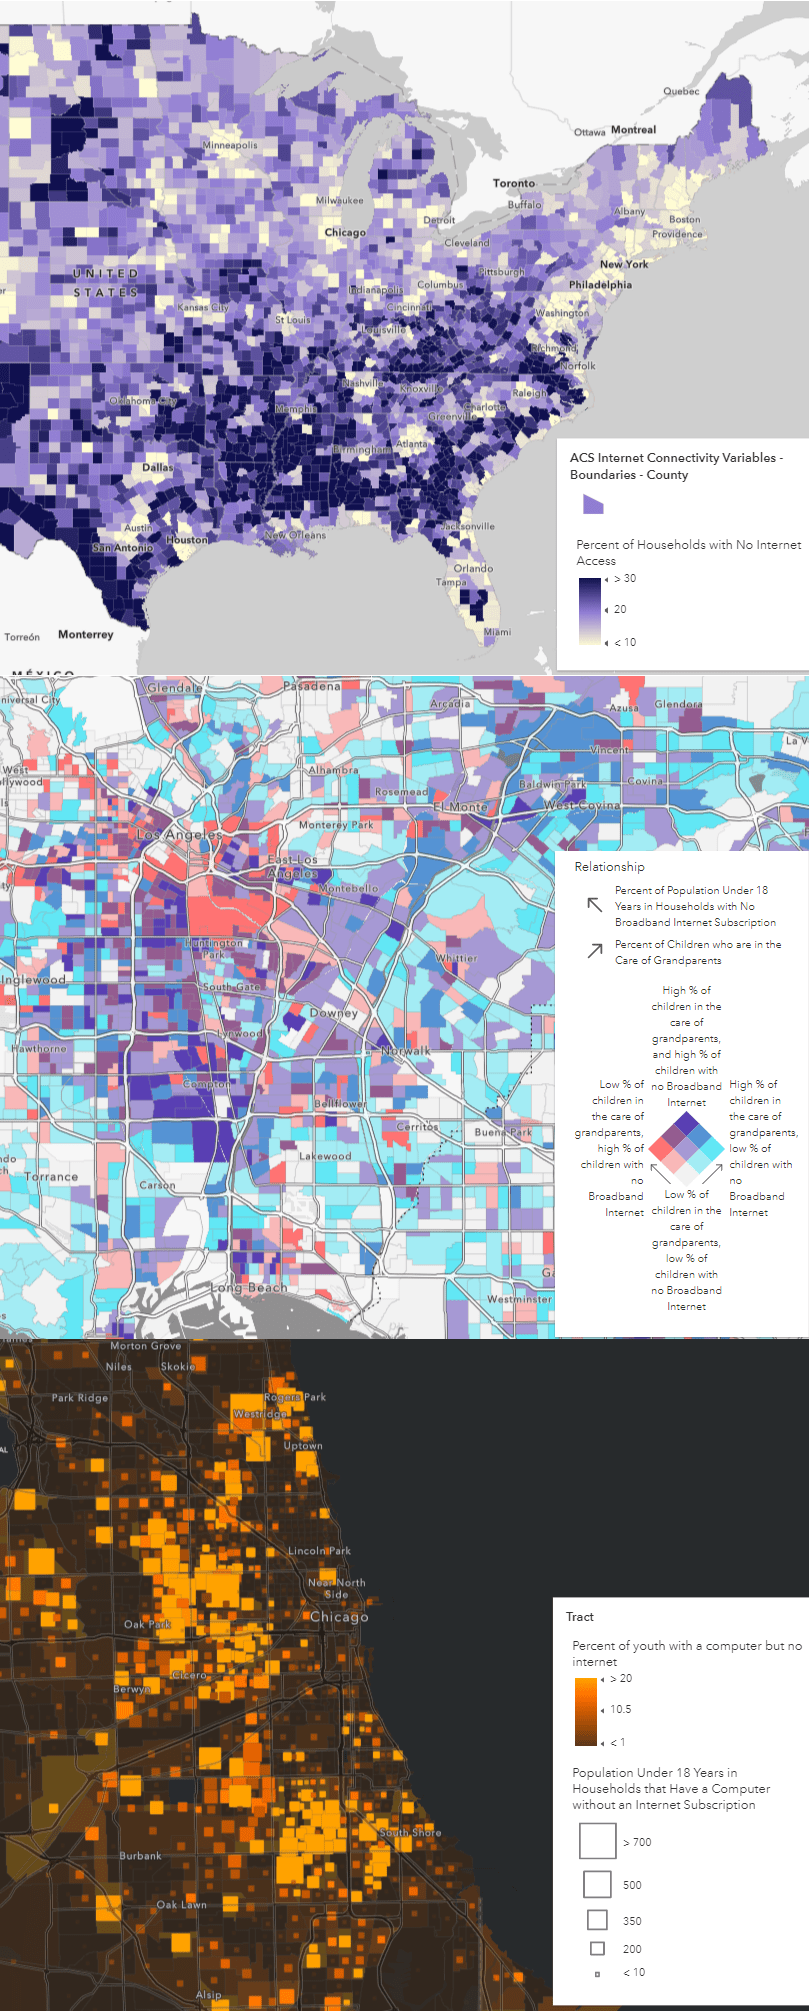
The U.S. Census Bureau provides a wealth of information about the US population, housing, and more. Freely available, ready-to-use Census ACS layers can be found in Living Atlas which go down to the Census Tract level. These layers can help identify areas of need by locating various types of population types/household types.
Internet access layers and maps:
See which households lack internet access by age, race, education, income, and more. Find all ACS layers about internet, computers, and broadband here.
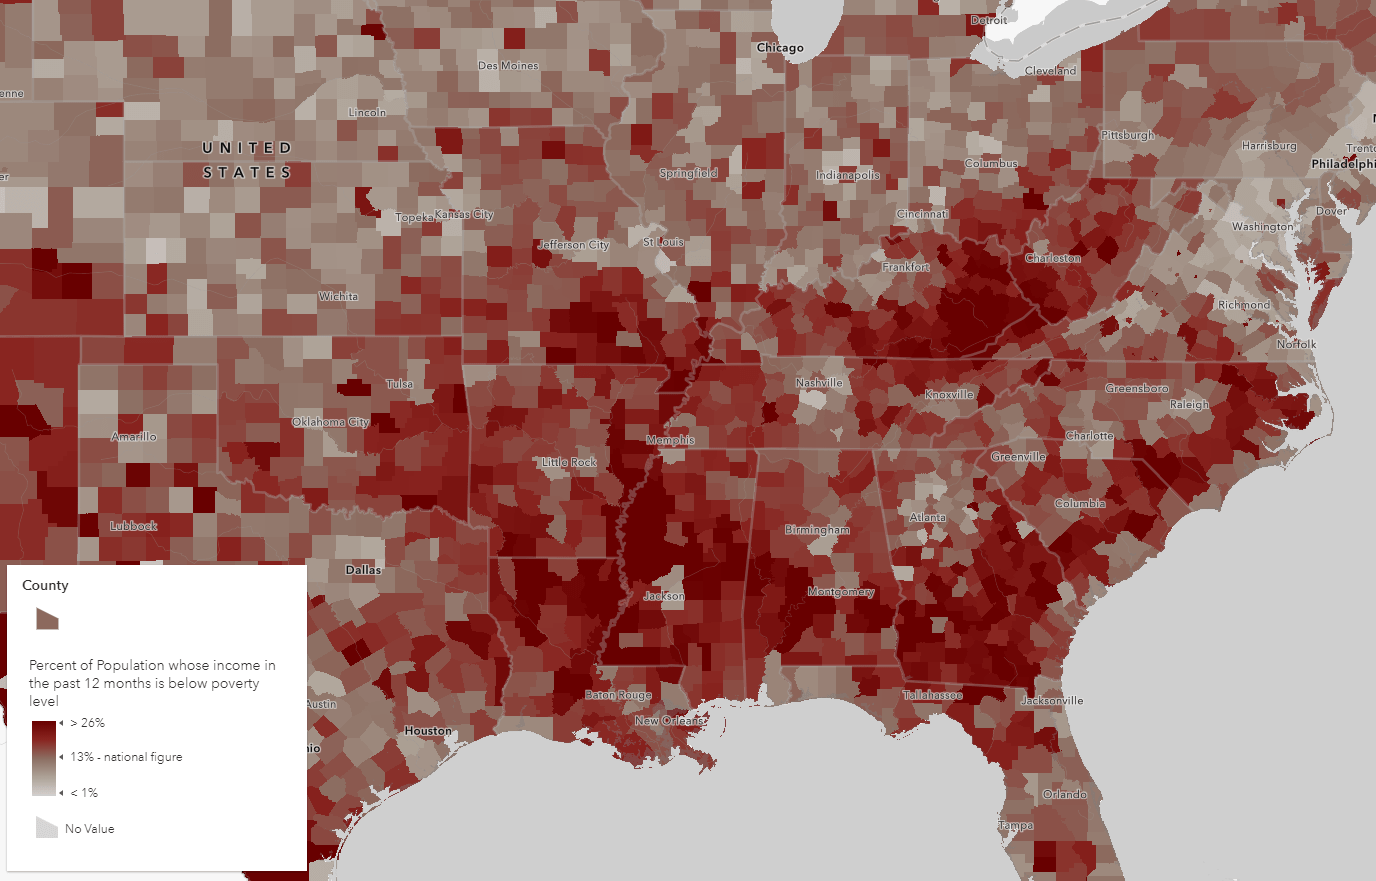
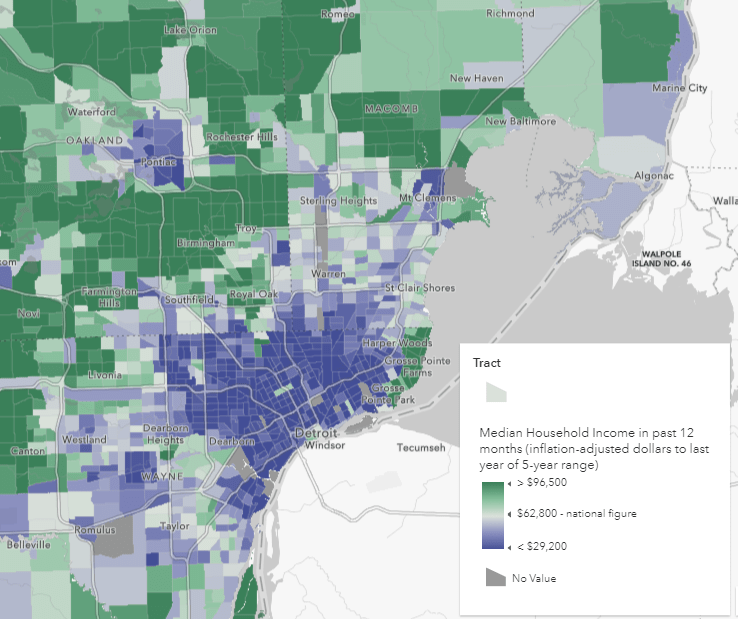
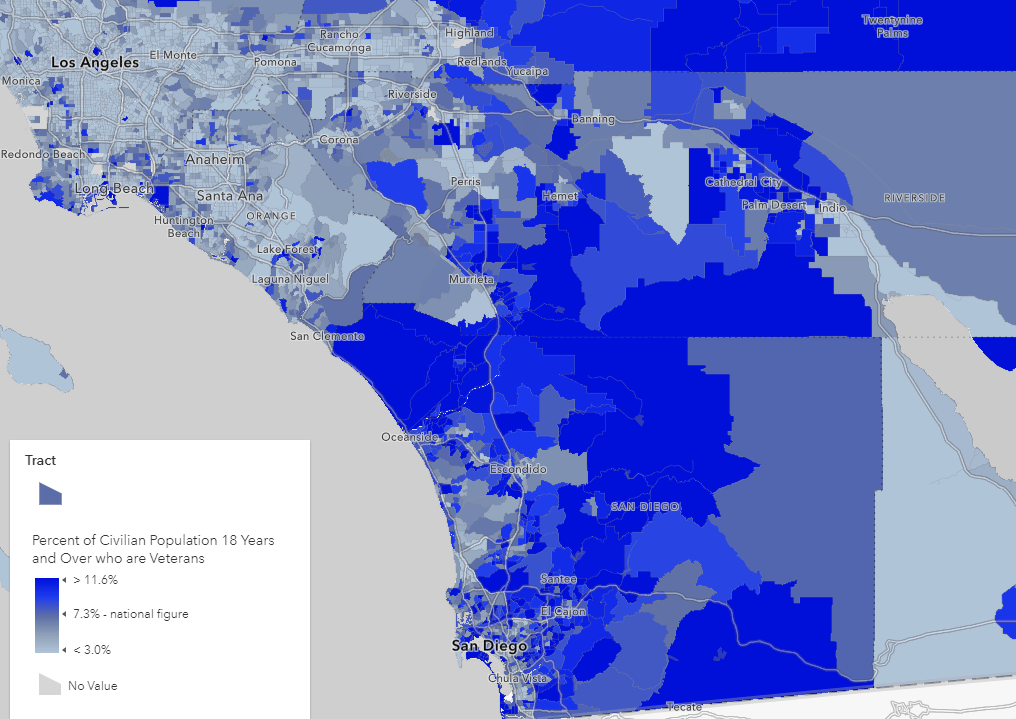
Low-income households and veterans:
Some policies such as the Emergency Broadband Benefit Program aim to provide affordable internet to low-income households and veterans. There are many ACS maps that highlight median household income, population living below the Federal poverty line, and veteran population.
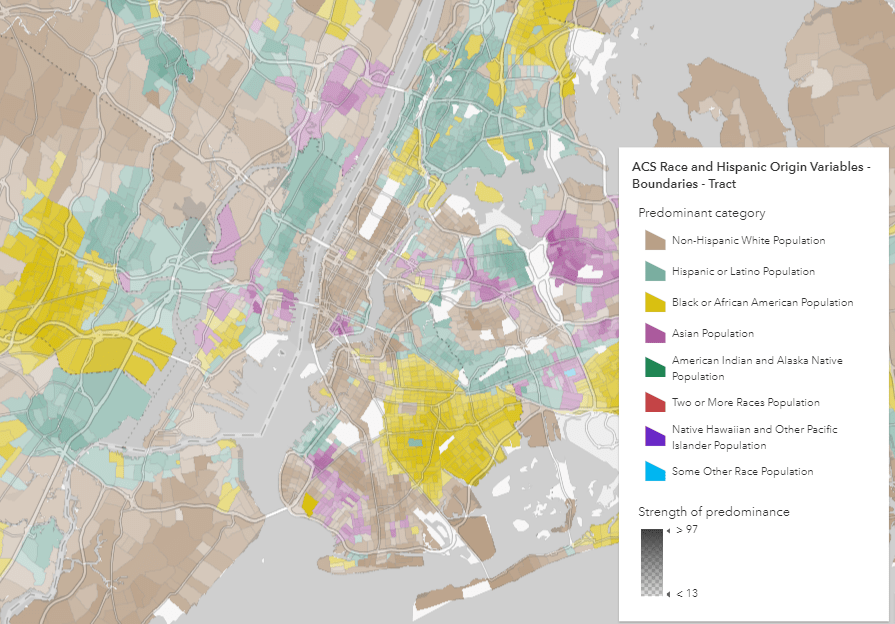
Racial equity:
To address how broadband access is impacted by racial inequities, there are many layers and maps which contain information about population counts by race. Comparing patterns of broadband access and race can help address inequity throughout the US.
Detailed Demographics
Need the data at a more granular level? Esri Demographics cover a wide range of behavioral and socioeconomic factors down to the block group level. Learn more about topics related to:
- Income, households, spending
- Businesses and population
- Behaviors related to computer/tv/internet usage
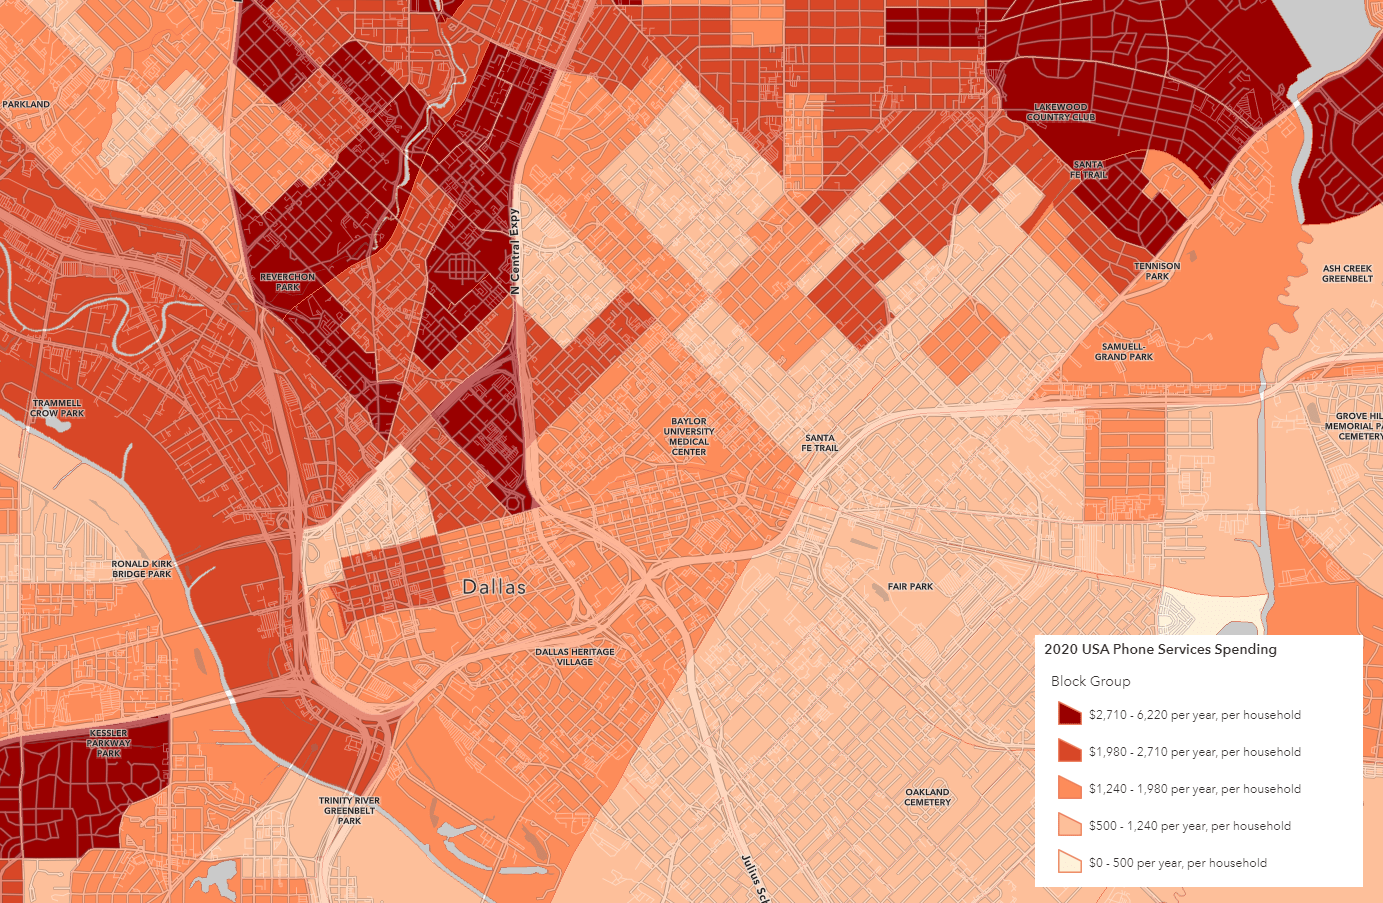
To access this US Esri Demographics data, there are ready-to-use layers in Living Atlas, you can perform an enrichment in ArcGIS Online or ArcGIS Pro, and many other methods depending on your specific GIS workflows.
Infrastructure + rural population layers
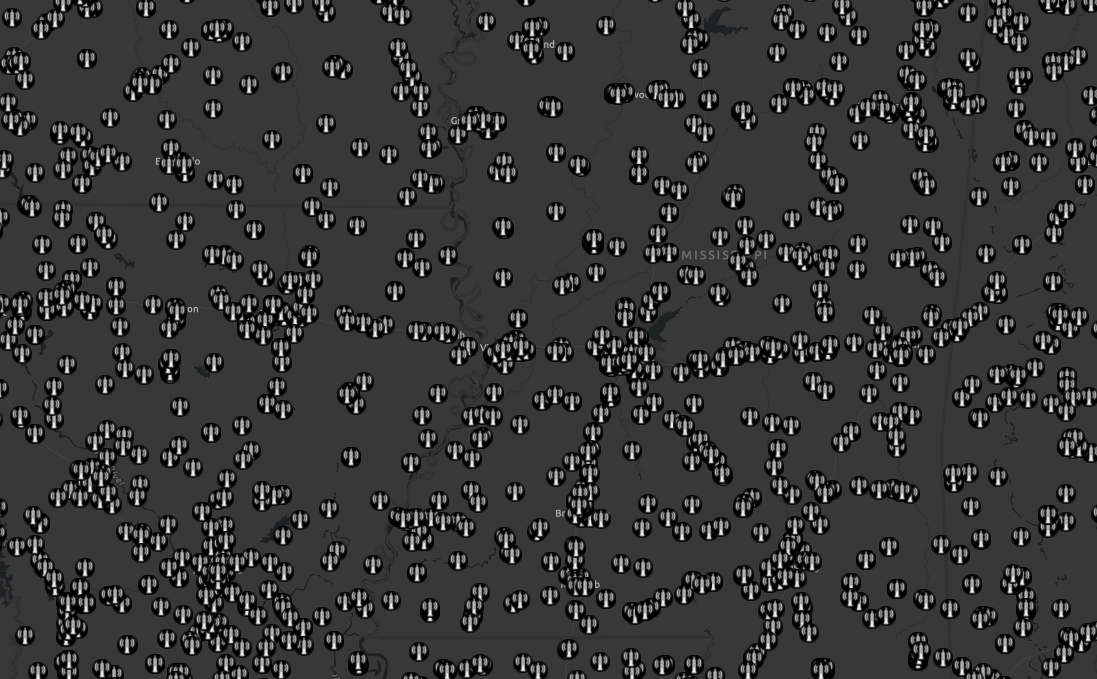
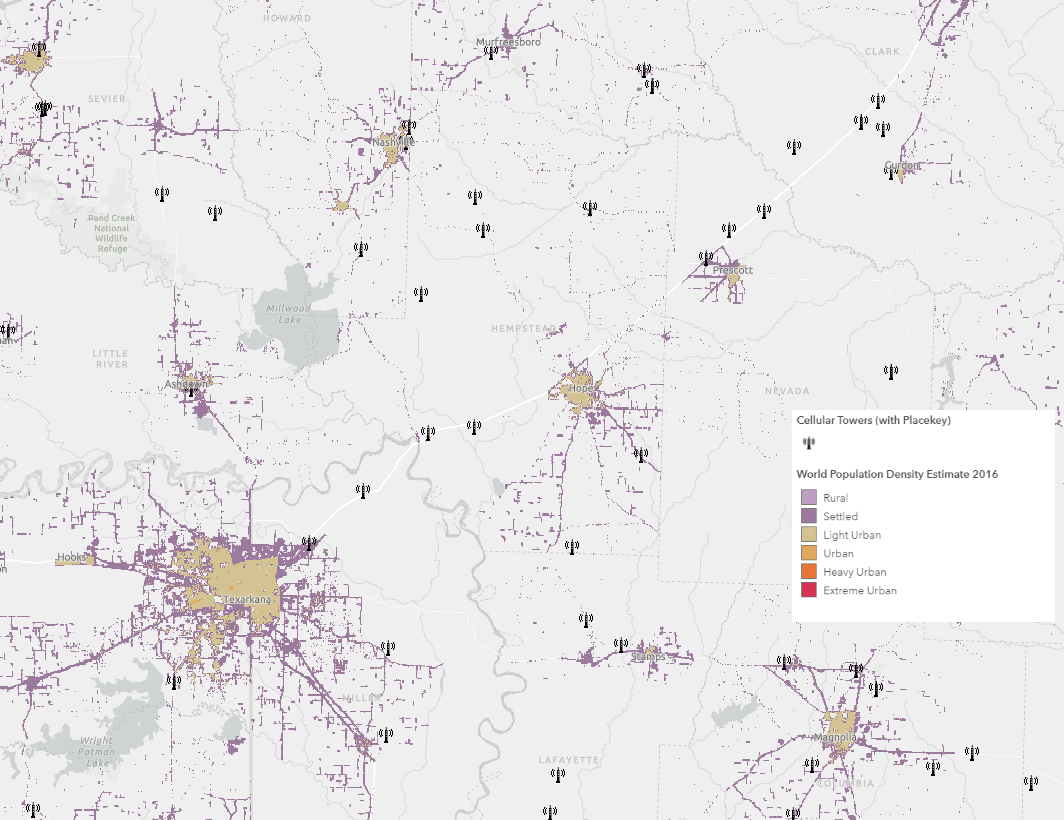
Initiatives such as the U.S. Department of Agriculture (USDA) Reconnect Program invest in high-speed infrastructure to improve connectivity in rural areas. Knowing the proximity of population to a transmission tower is a critical part of assessing the access to broadband, especially in rural areas. Knowing where these towers exist is half of the equation. The Infrastructure category of Living Atlas contains many layers representing cell towers and FCC tower locations as extracted from their Licensing Database.
To investigate where infrastructure and rural populations coincide, the World Population Density Estimate layer helps locate small settlements and rural areas. The layer specifies urban, settled, and rural populations to pinpoint where there might be underserved populations.
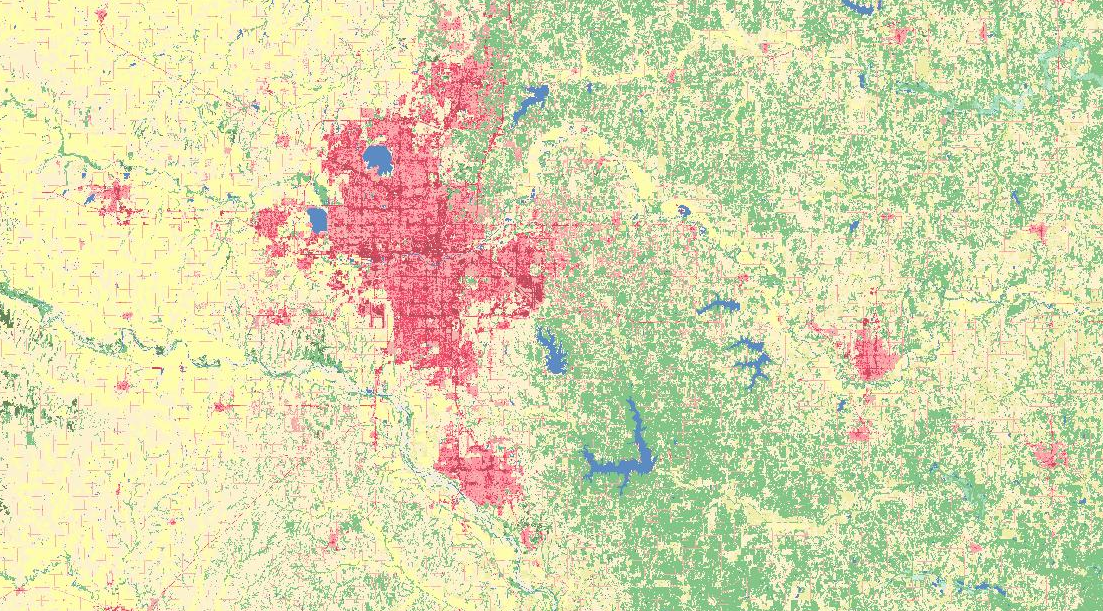
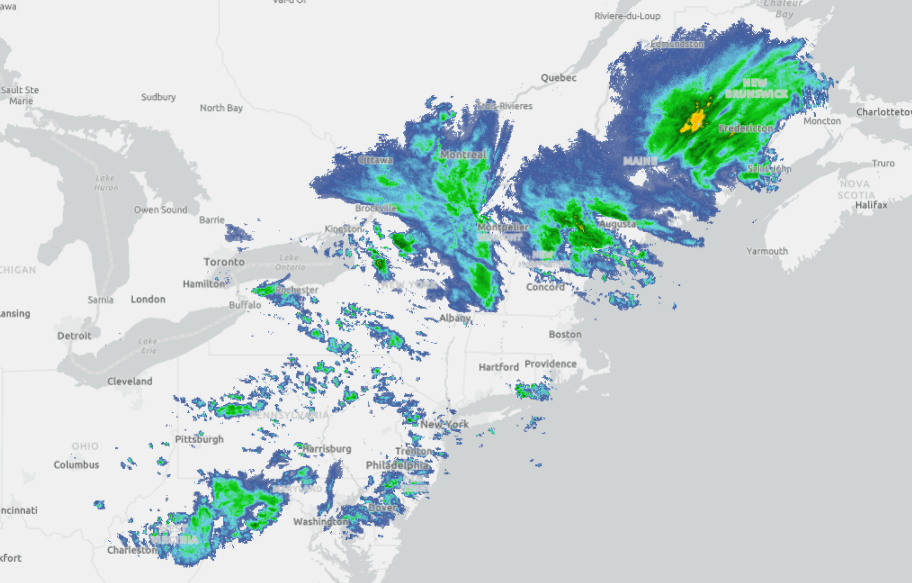
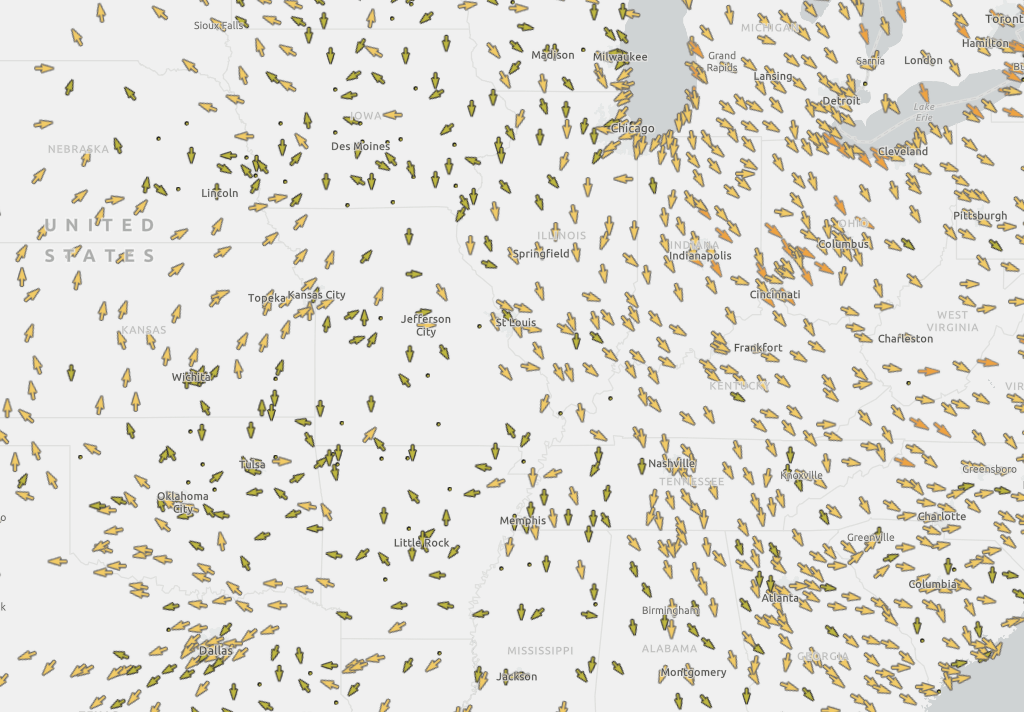
Landscape and Environment
When considering the placement of new towers, understanding the landscape and environment are critical. Aspects such as land cover, Federal lands, weather, and critical habitats can greatly impact the location in which towers can be placed.
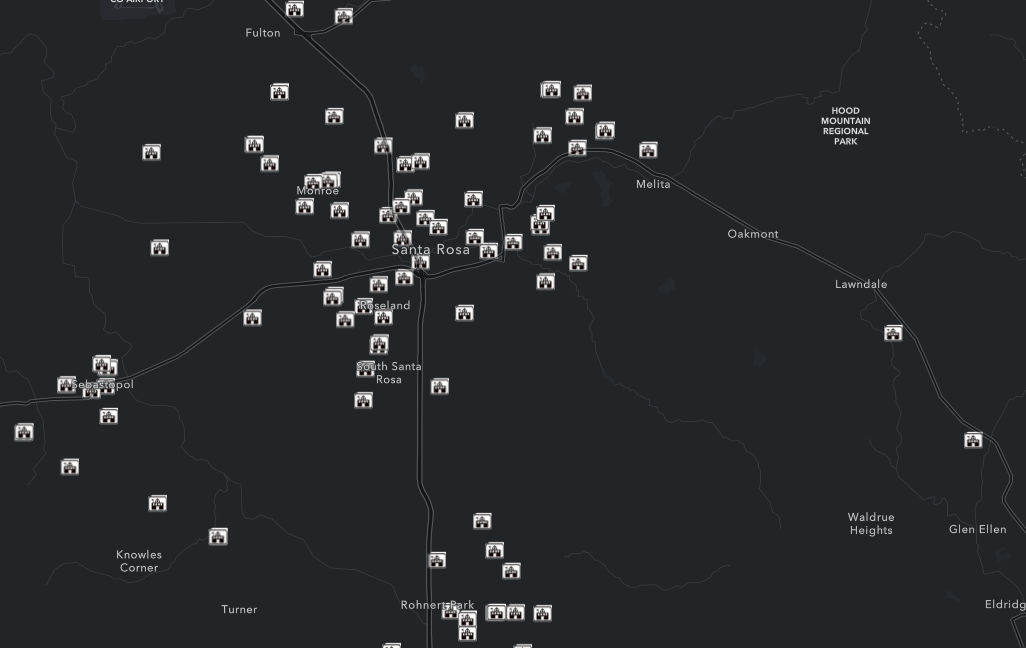
Contextual layers
As mentioned earlier, proximity is a key component for determining accessibility. Living Atlas contains contextual layers such as schools, libraries, and others to help assess where broadband is impacting children and other at-risk population groups.
Emphasize Areas of Need
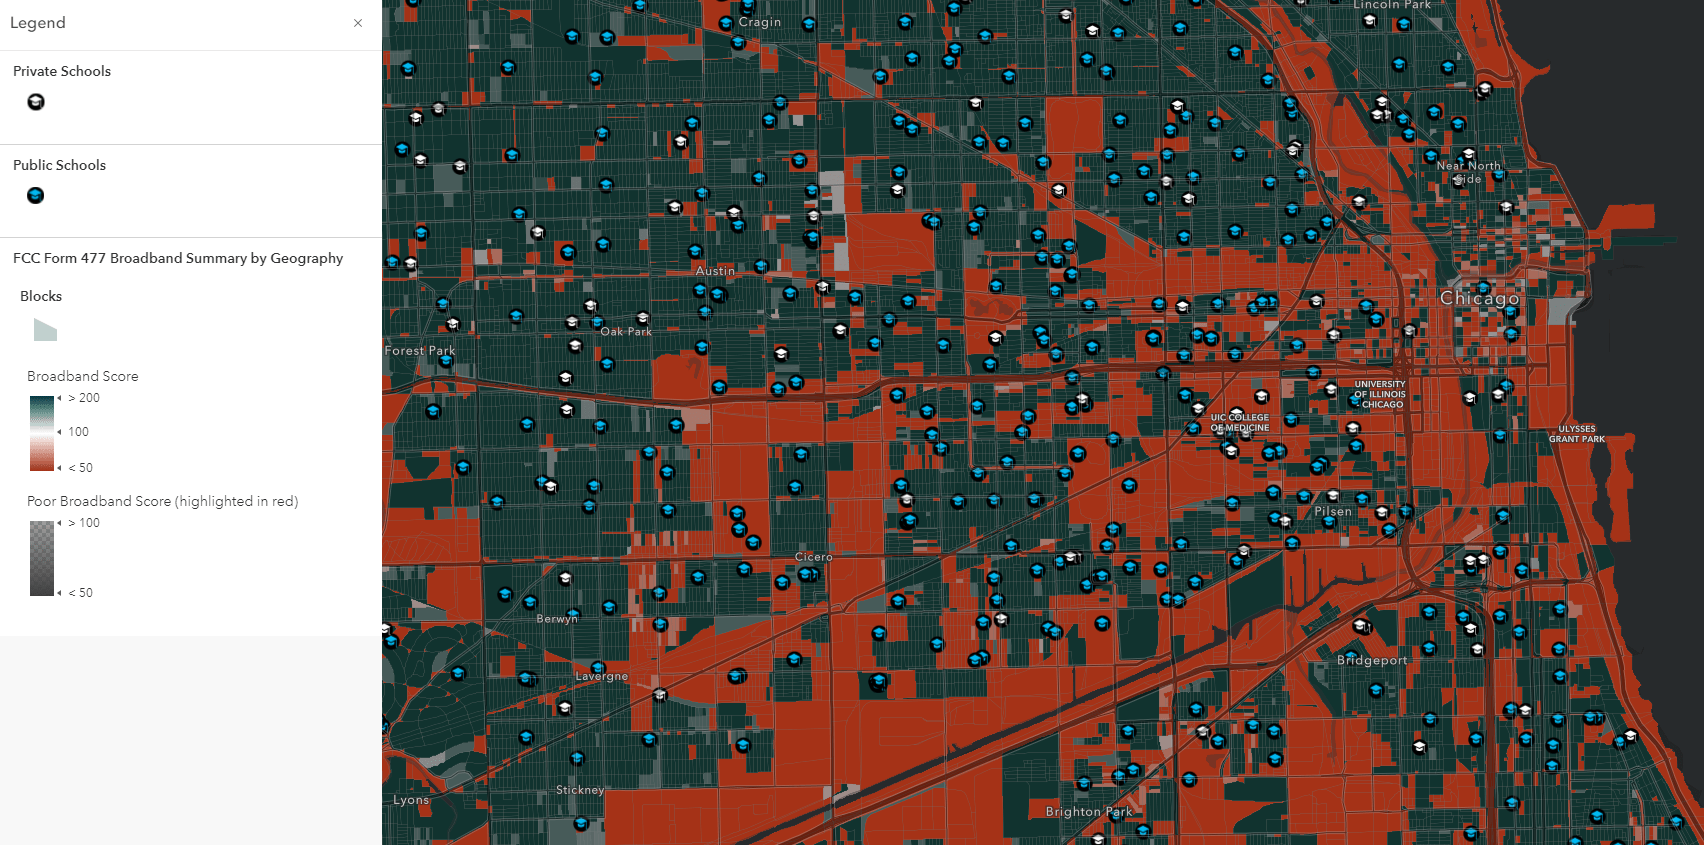
On their own, the layers and web maps from Living Atlas help us identify spatial patterns. This is a great place to start. But when these are customized, combined visually, or analyzed, it becomes more clear where policy and resources should be focused. Even small changes to your map can help emphasize where there are opportunities to intervene.
For example, the map below combines the FCC broadband score and schools layers listed above. With some changes to the map symbology, this simple overlay emphasizes which schools fall in areas of poor broadband. This overlay technique can be replicated with hospitals, libraries, etc.
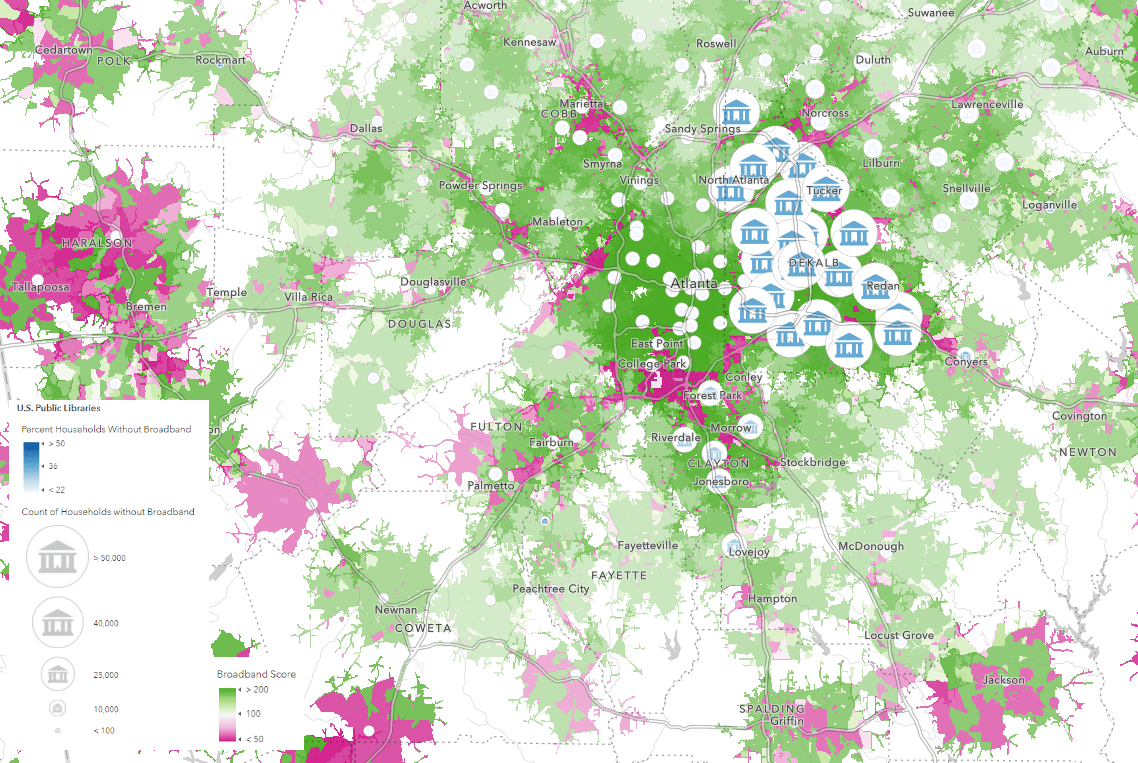
Another example uses both overlay and analysis. A 10-minute drive time was calculated from each library to show accessibility by car, and blending modes in the new Map Viewer visually compare these drive times with the FCC broadband availability. Within each drive time, the percent of households without broadband was summarized in order to emphasize which libraries had households nearby in need of internet.
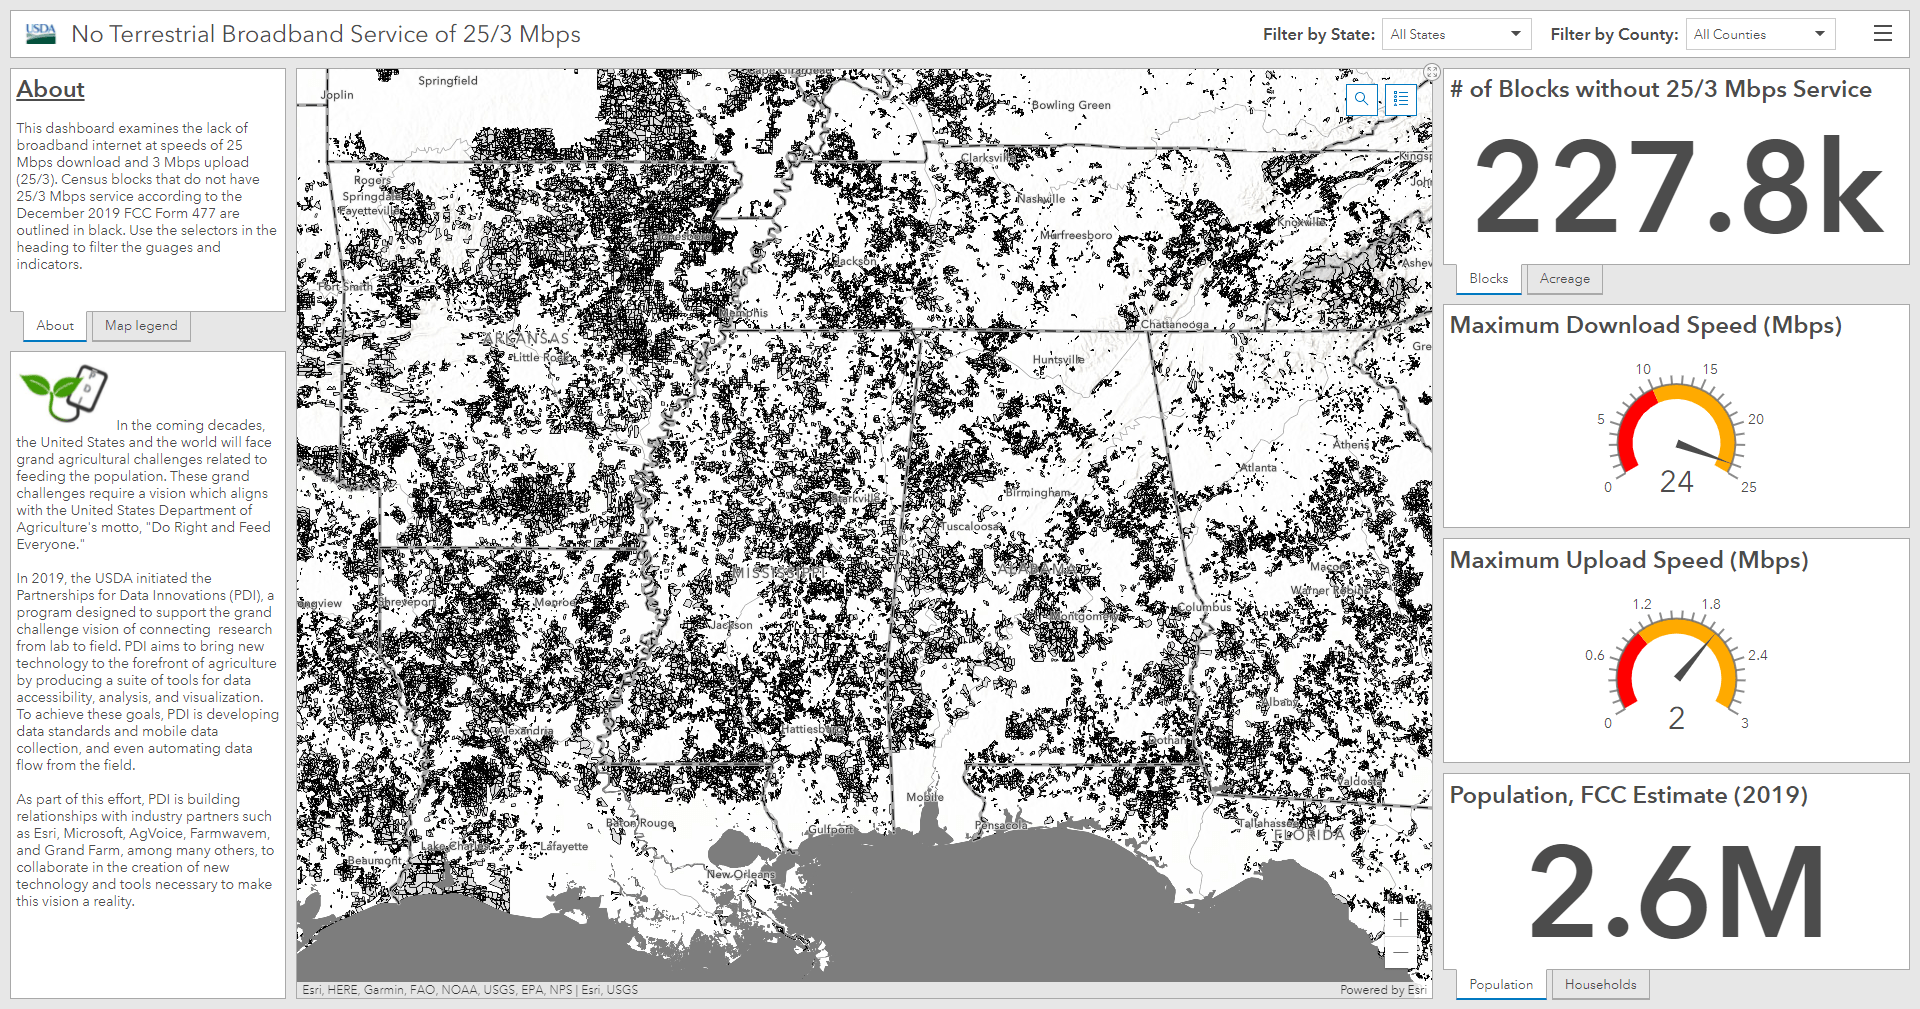
Another example uses the FCC layer shown earlier and places it into this dashboard. This view of the data provides an immediate assessment of areas without broadband service, and offers statistics and population figures to show overall impact.
These are just a few examples of how layers can be combined with analysis and cartographic techniques in order to highlight where the need is greatest. ArcGIS provides tools, layers, apps, and many other capabilities which can help communicate areas of opportunity with those controlling policy funds.
Explore and share content with Esri Maps for Public Policy
Not everyone needs a custom-made map or application to communicate critical information to policy-makers. There are hundreds of ready-to-use maps related to broadband readily available in the Esri Maps for Public Policy site. Explore the site for content about socioeconomic factors or broadband availability and collect maps focused on your area. Share the collection of maps via email, URL, or social media, and it will stay focused on your area with the map you chose.
For example, here is a collection of maps related to internet access in Santa Fe, New Mexico:
This is an easy way to find and share maps with policymakers and non-GIS audiences who need to know where policies are working or need further adjustments. To learn how to quickly collect and share maps through the policy site, watch this short 3-minute video. To learn more about creating your own policy-focused maps, check out the many resources available on the site.
Nominate Your Content
Share your maps with the GIS community by nominating your content to Living Atlas. If your organization is an authoritative data source for data related to broadband, the Living Atlas team will help you nominate your hosted layers, Pro Packages, web maps, apps, story maps, and more. By sharing your content, GIS professionals can easily find and use your work in order to continue expanding broadband.
For more information on how to do this, visit this short tutorial for more information.
Additional Resources
Atlas of Internet Connectivity
Blog: Broadband Availability and Adoption
Story map: Broadband Availability and Adoption (detailed)
ArcGIS Living Atlas of the World US Layers
Broadband content within ArcGIS Living Atlas
Esri Maps for Public Policy – Issues
Living Atlas content for Telecommunications
H.R.1319 – American Rescue Plan Act of 2021
H.R.133 – Consolidated Appropriations Act, 2021

Article Discussion: