Change detection has traditionally been performed in ArcGIS Pro. Now, however, you can detect changes with a custom raster function template directly in the ArcGIS Online Map Viewer — all within a web browser. This is possible thanks to two recent key improvements: the optimization of imagery data for analysis, such as Sentinel-2 Level-2A and Landsat Level-2 (Learn more here), in ArcGIS Living Atlas of the World, and the availability of handy tools provided in Map Viewer.
Change Detection Multispectral ArcGIS Online
Change Detection Multispectral ArcGIS Online is a custom raster function template. The workflow of detecting changes from two multispectral imagery involves multiple raster functions. We have consolidated these functions into this template and made it available to everyone. It takes analysis-ready multispectral images, either from Sentinel-2 Level-2A or Landsat Level-2 from ArcGIS Living Atlas as input. You don’t need to prepare your own data to perform change analysis.
Detailed information about Change Detection Multispectral ArcGIS Online is here.

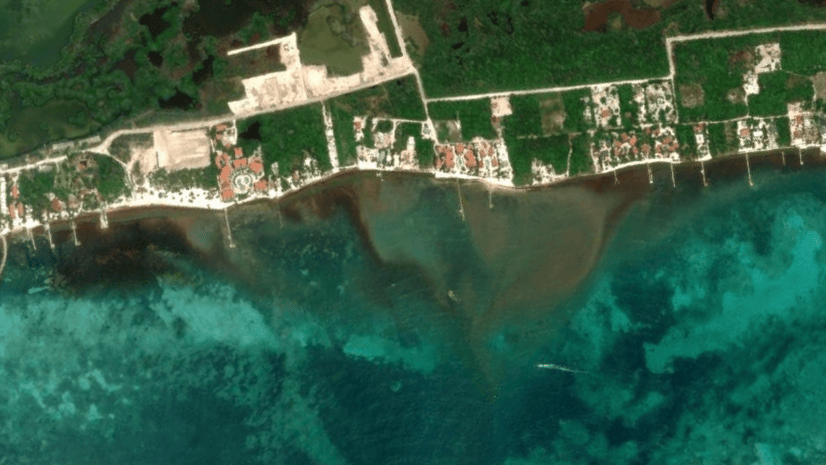
In this blog, we use this template to detect changes caused by floods in Asheville, North Carolina. Hurricane Helene hit this area on September 27, 2024. To achieve this goal, we need two image layers, before and after Helene, to retrieve the changes. We call them “before image” and “after image”. They are selected from Sentinel-2 Level-2A in ArcGIS Living Atlas. The analysis is done in Map Viewer. The workflow is suitable for detecting other types of changes as well with proper spectral index and band indexes set in Band Arithmetic.
Key steps
- Select an image before Hurricane Helene from Sentinel-2 Level-2A in ArcGIS Living Atlas.
- Select an image after Hurricane Helene from Sentinel-2 Level-2A in ArcGIS Living Atlas.
- Open the raster function template Change Detection Multispectral ArcGIS Online and provide the two images as its input.
- Set processing extent to Display extent.
- Run the template and obtain the result.
Note: Cloud removal is not included in this blog. We are able to find the best scenes for the before and after images . If clear scenes are not available for your area of interest (AOI) for certain dates, you can adjust the dates to try. If you still cannot obtain clear images, you will need to remove clouds first before performing change detection.
Tools needed
To detect changes in ArcGIS Online, we need the tools below. They are in the right side tool pane in Map Viewer.
- Image collection explorer: Used to select before and after images.
- Processing templates: Used to remove the template applied on Sentinel 2 Level-2A for analysis, and apply the natural color template on the two images for visualization after analysis.
- Analysis: Runs the change detection raster function template.
- Properties: Displays properties of the current layer.
Detailed steps
Step 1: Open Map Viewer
Map Viewer is an integrated app within ArcGIS Online. You can use it to display web maps and create new ones by adding all kinds of layers. The truly cool aspect is that it also provides powerful tools that allow you to perform various analyses. The change detection here is completed entirely within Map Viewer. To do analysis, your user type in ArcGIS Online must be Professional or Professional Plus.
- Sign into ArcGIS Online via arcgis.com.
- In the upper right corner, click the 9-dot icon, and click Map Viewer. It opens up a new web map with a default basemap.
Step 2: Decide area of interest (AOI)
We are detecting floods in Asheville, North Carolina. So, our AOI is the Asheville area.
-
- In the lower right area on the map, click the Search tool on the vertical tool bar.
- Type Asheville, NC, USA, and press Enter. The map zooms into the Asheville area. You can zoom in further to see more details of the region.
- Close the popup window.
Step 3: Add the Sentinel-2 Level-2A layer to map
Follow the steps below to add data source Sentinel-2 Level-2A to the map. If you need to know more about adding data from ArcGIS Living Atlas, read this tutorial.
- In the Layers pane on the left of the map, click Add.
- Select Living Atlas from the My content drop-down list.
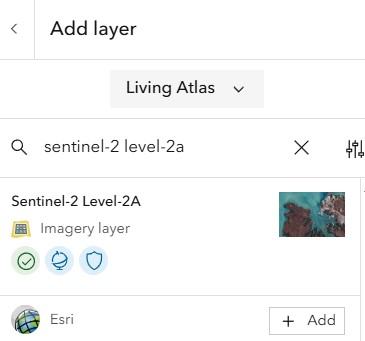
- Type sentinel-2 in the Search bar and press Enter.
- Click the Sentinel-2 level-2A card. Read the description if you want. Click +Add.
Add the Sentinel-2 Level-2A layer to the map - Click Back in the upper left corner in the Add layer pane to close the window.
- Now save your work. In the left content bar, click Save and open, click Save as, provide a name for Title, fill out in other parts if you want, and click Save.
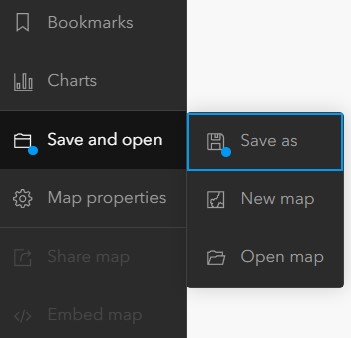
Save the web map
Step 4: Use Filter to select a subset of the Sentinel-2 Level-2A layer
The Sentinel layer has thousands of scenes. We need to create a subset from it based on the AOI and filter the scenes based on the dates near the hurricane so that we can easily select the best scenes for before image and after image in step 5 and step 6.
- Zoom to the Asheville area if you have panned out the AOI.
- On the right side tool bar, click Image collection explorer. It lists 675 scenes (the number might be slightly different on your computer) for the current display extent.
- To reduce the subset size further, click Filters on the ribbon, select AquisitionDate for Attribute, then drag the sliders to set a rough range that includes September 27, 2024, saying 2024-08-25 and 2024-10-28.
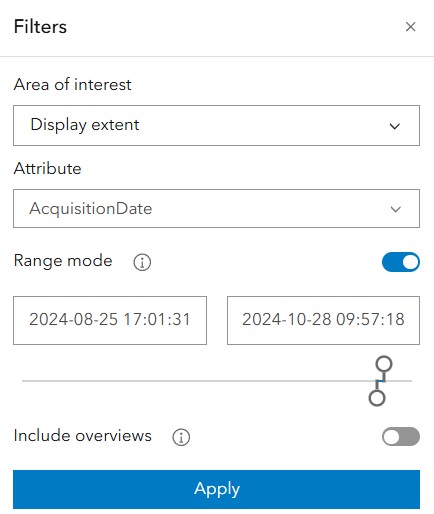
Select scenes by acquisition date - Click Apply. The list size in Image collection explorer is reduced to 11. Luckily, the AOI doesn’t fall into multiple scenes, which means we just need one scene for each input image.
- Close the Filters window.
Step 5: Select a scene from the subset as before image
We first inspect the candidate scenes in September, then select the best one from them.
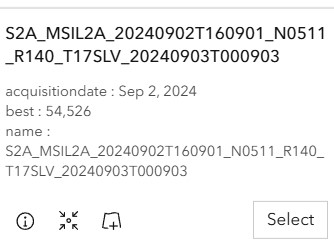
- Scroll down the tile list of the subset in Image collection explorer to locate the tile of Sep 2, 2024.
- Click Add image to map to add it on the map.
Add the tile to the map - The Sep 2, 2024 tile automatically becomes the current layer in Image collection explorer. On the top of the Image collection explorer pane, select Sentinel-2 Level-2A from the drop-down list to make it the current layer so we can add more layers.
- Repeat step 1 through step 3 to select and add Sep 7, 22, and 27 to the map one by one.
- To visually inspect the quality of each layer, turn on the layer by clicking the visibility option (eye icon) near it.
- It’s easy to notice that Sep 22 is clear with only small clouds scattering outside of the Asheville area while other candidate layers include a lot of clouds.
- Rename Sep 22 as Before image by selecting Rename from the drop-down list of the 3-dot icon near it.
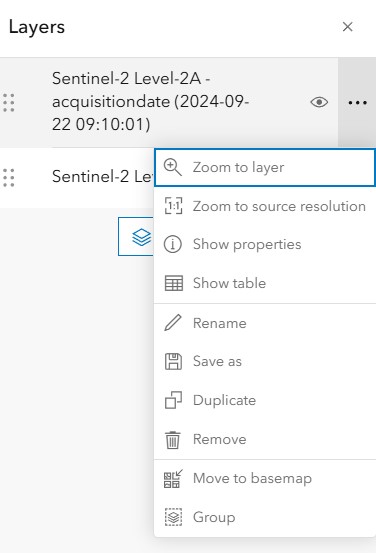
Rename the layer - Remove unwanted scenes one by one by selecting Remove from the drop-down list of the 3-dot icon near it
- Turn off the Sentinel-2 Level-2A layer.
These selected scenes can be saved within the web map or you can save them to your organization to use them in other web maps. Select the image in the Layers pane, click the More Properties button, and select Save As to save it in your organization. This saved imagery layer is a version of the Sentinel 2A layer saved to your organization. This process is useful if you want to maintain access to that scene in the future.
Step 6: Select a scene from the subset as after image
Now, we add Oct 2, 7, 12, 17, 22, and 27 to the map and select the best one from them using the same methods from step 5.
- Scroll down the tile list in Image collection explorer to locate the tile of Oct 2, 2024.
- Click Add image to map to add it on the map. The current layer changes to this tile.
- On the top of Image collection explorer pane, select Sentinel-2 Level-2A from the drop-down list to make it current layer so we can add more layers.
- Repeat step 1 to step 3 to select and add Oct 7, 12, 22, 27 to the map one by one.
- Inspect and find that Oct 12, 17 and 22 are very clear.
- The tile on Oct 12 is the best because it’s the closest one to the hurricane day. So, rename it as After image.
- Remove unwanted October tiles and save your work.
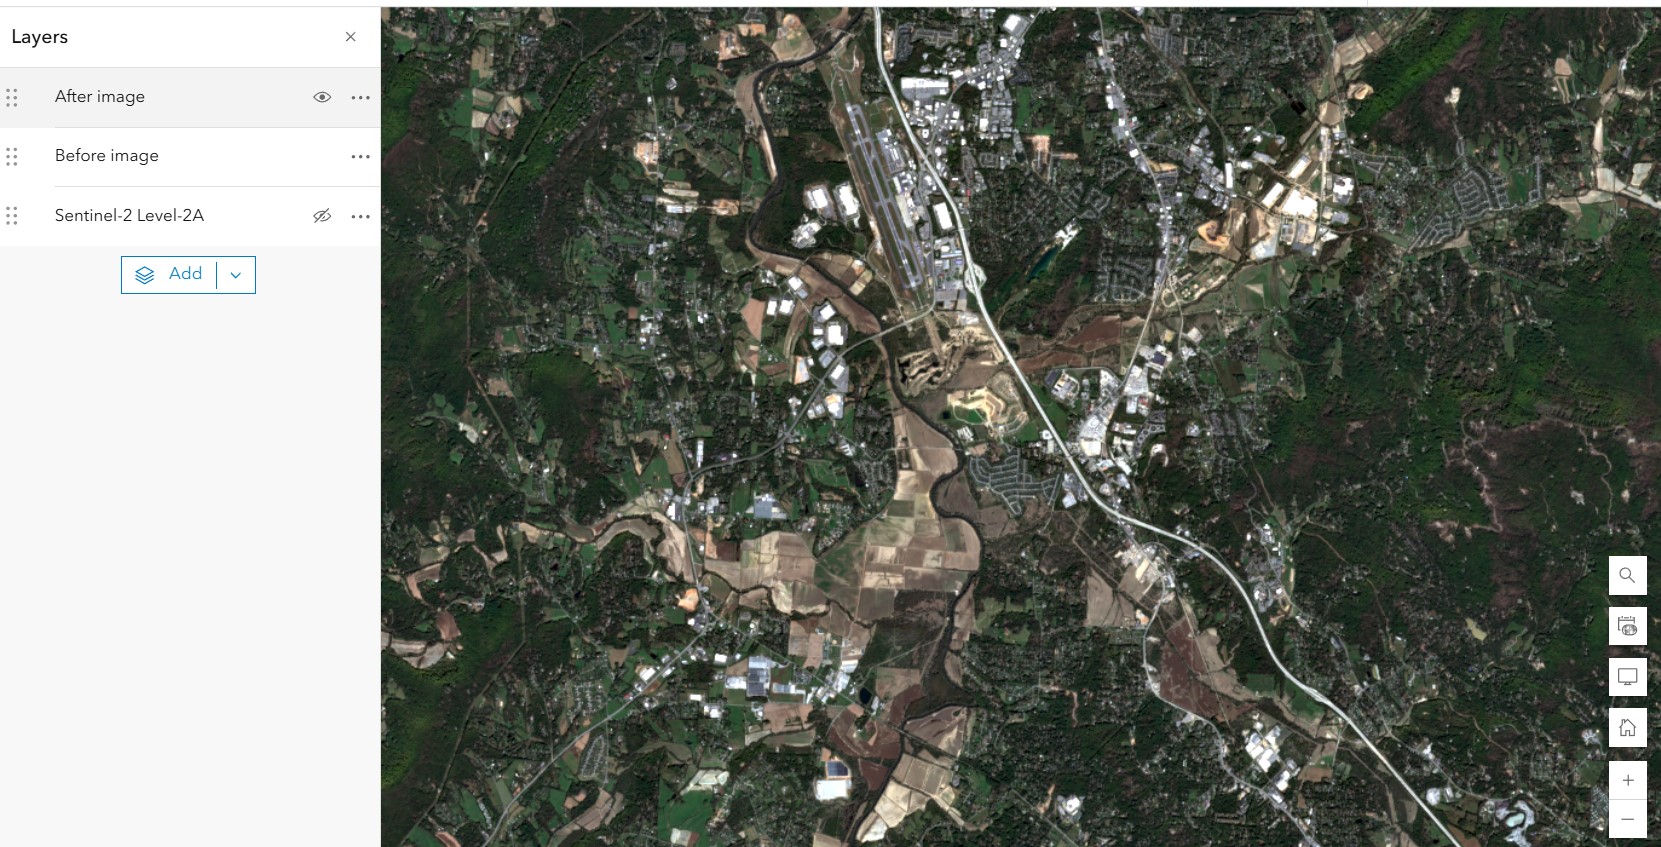
Zoom into the Asheville Regional Airport area in the south of Asheville, and switch between Before image and After image. The flooding areas on After image are striking. Now we have layers like this below. We will use this area as the processing extent.
Step 7: Remove Natural Color template from Before image and After image
To do raster analysis, we need raw data without any template applied. Processing templates apply other raster functions on the input images to alter the display. Depending on the raster analysis you want to perform, the input raster bands may not be available for analysis. For example, the Natural Color processing template uses only 3 of the available 11 raster bands (Red, Green, and Blue). Since you will be using a raster band calculation that includes the short wave infrared and near infrared bands, you will need to remove the processing template so that those bands are available for analysis. To remove the applied template, follow these steps:
- Click Processing templates on the right side tool bar.
- Select After image from the drop-down list on the top of the Processing templates pane.
- Scroll down the template list to the bottom, and check None.
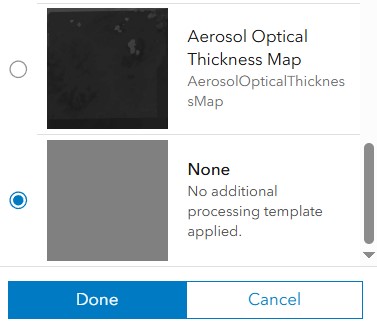
Remove the template from the layer. - Repeat step 2 and step 3 for Before image.
- Click Done to close the Processing templates pane. Now both Before image and After image are gray, which means we have successfully switched to raw data.
- In the Layers pane, turn off the two layers so we know where the display extent is.
Step 8: Add the change detection template to the map
Add Change Detection Multispectral ArcGIS Online to the map by following these steps. For how to create a raster function template in ArcGIS Pro, reference this document. To create a raster function template in ArcGIS Online, reference this document. To download the raster function, find it here.
- On the right side tool bar, click Analysis.
- Click Raster Function Templates on the ribbon in the Analysis window, and click Browse raster function templates to open the search window.
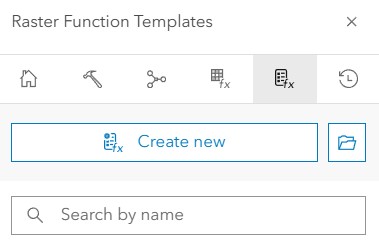
Browse raster function templates - In the search window, select ArcGIS Online from the drop-down list, type Change Detection on ArcGIS Online rft, and press Enter.
- Click on the Change Detection Multispectral ArcGIS Online card, and click Confirm. The layout detail of the template is displayed as below. The look of Change Detection Multispectral ArcGIS Online is slightly different from the one in the beginning of the blog because it’s displayed in Map Viewer here. But they are the same template.

Click one Band Arithmetic, and select Properties.
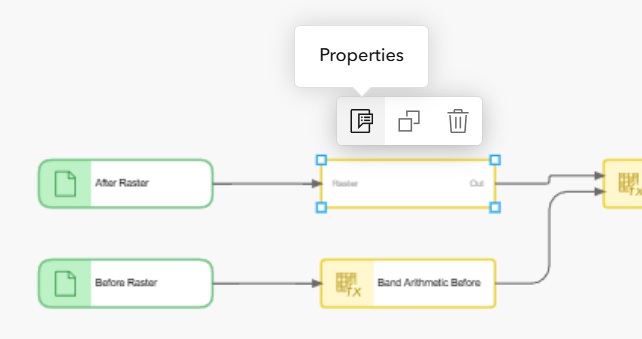
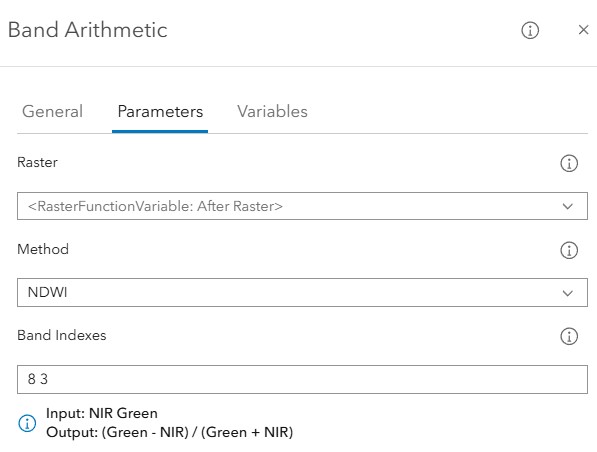
As you’ll see, the spectral index NDWI is pre-selected for Method because the template will detect floods. It uses band 8 (NIR) and band 3 (Green) from Sentinel imagery for Band indexes. We don’t need to change anything for this demo. Close the Properties window.
Step 9: Detect flooded areas by running the template
Now, we provide parameters for the template, then run it.
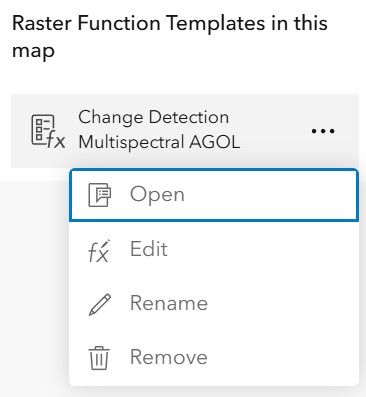
- If the template layout window is still open, close it. Click the 3-dot button near the template, and click Open.
Open Change Detection Multispectral AGOL - Choose Before image for Before Raster, and After image for After Raster.
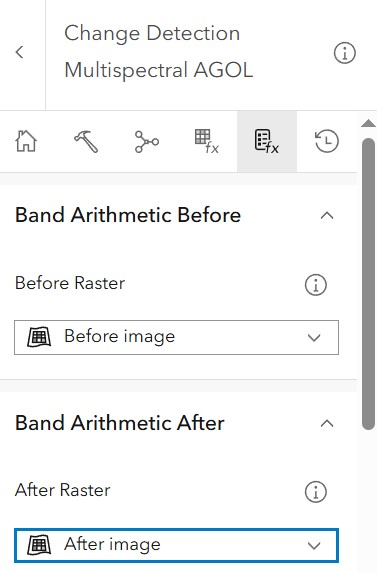
Provide input images for the template - Enter a name for Output name.
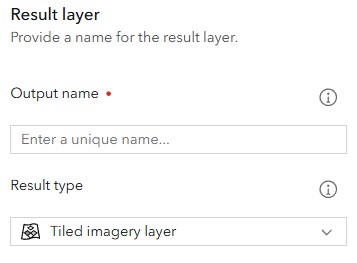
Provide a name for Output name - Scroll down and click Environment setting, then choose Display extent for Processing extent. The bigger the processing extent is, the longer the analysis takes.
- Click Run. We get a result layer moment later.
Step 10: Resume the display of the two input layers
Before image and After image are currently gray. We need to display them in natural colors so we can see the result layer nicely overlapped on them, which helps to better interpret and evaluate the result layer.
- Turn on After image, and click Processing templates on the right side tool bar.
- Check Natural Color for Visualization in Processing templates. The layer changes from gray to natural colors.
- Turn on Before image. Select it from the drop-down list on the top of the Processing templates pane.
- Check Natural Color for Visualization. Now, the map looks like this below.
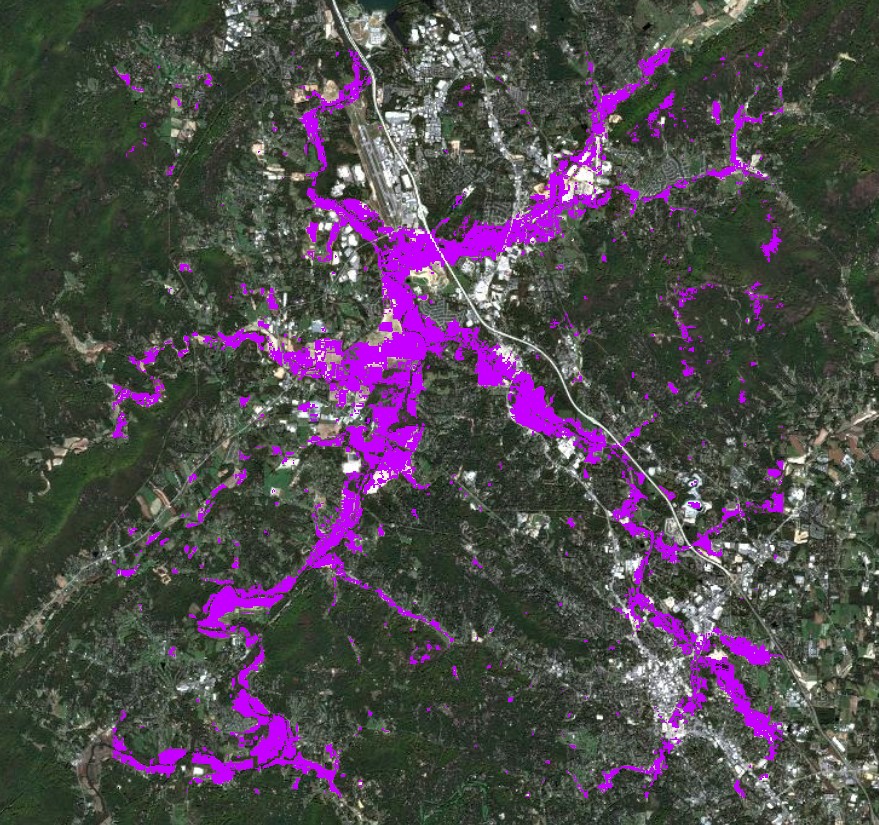
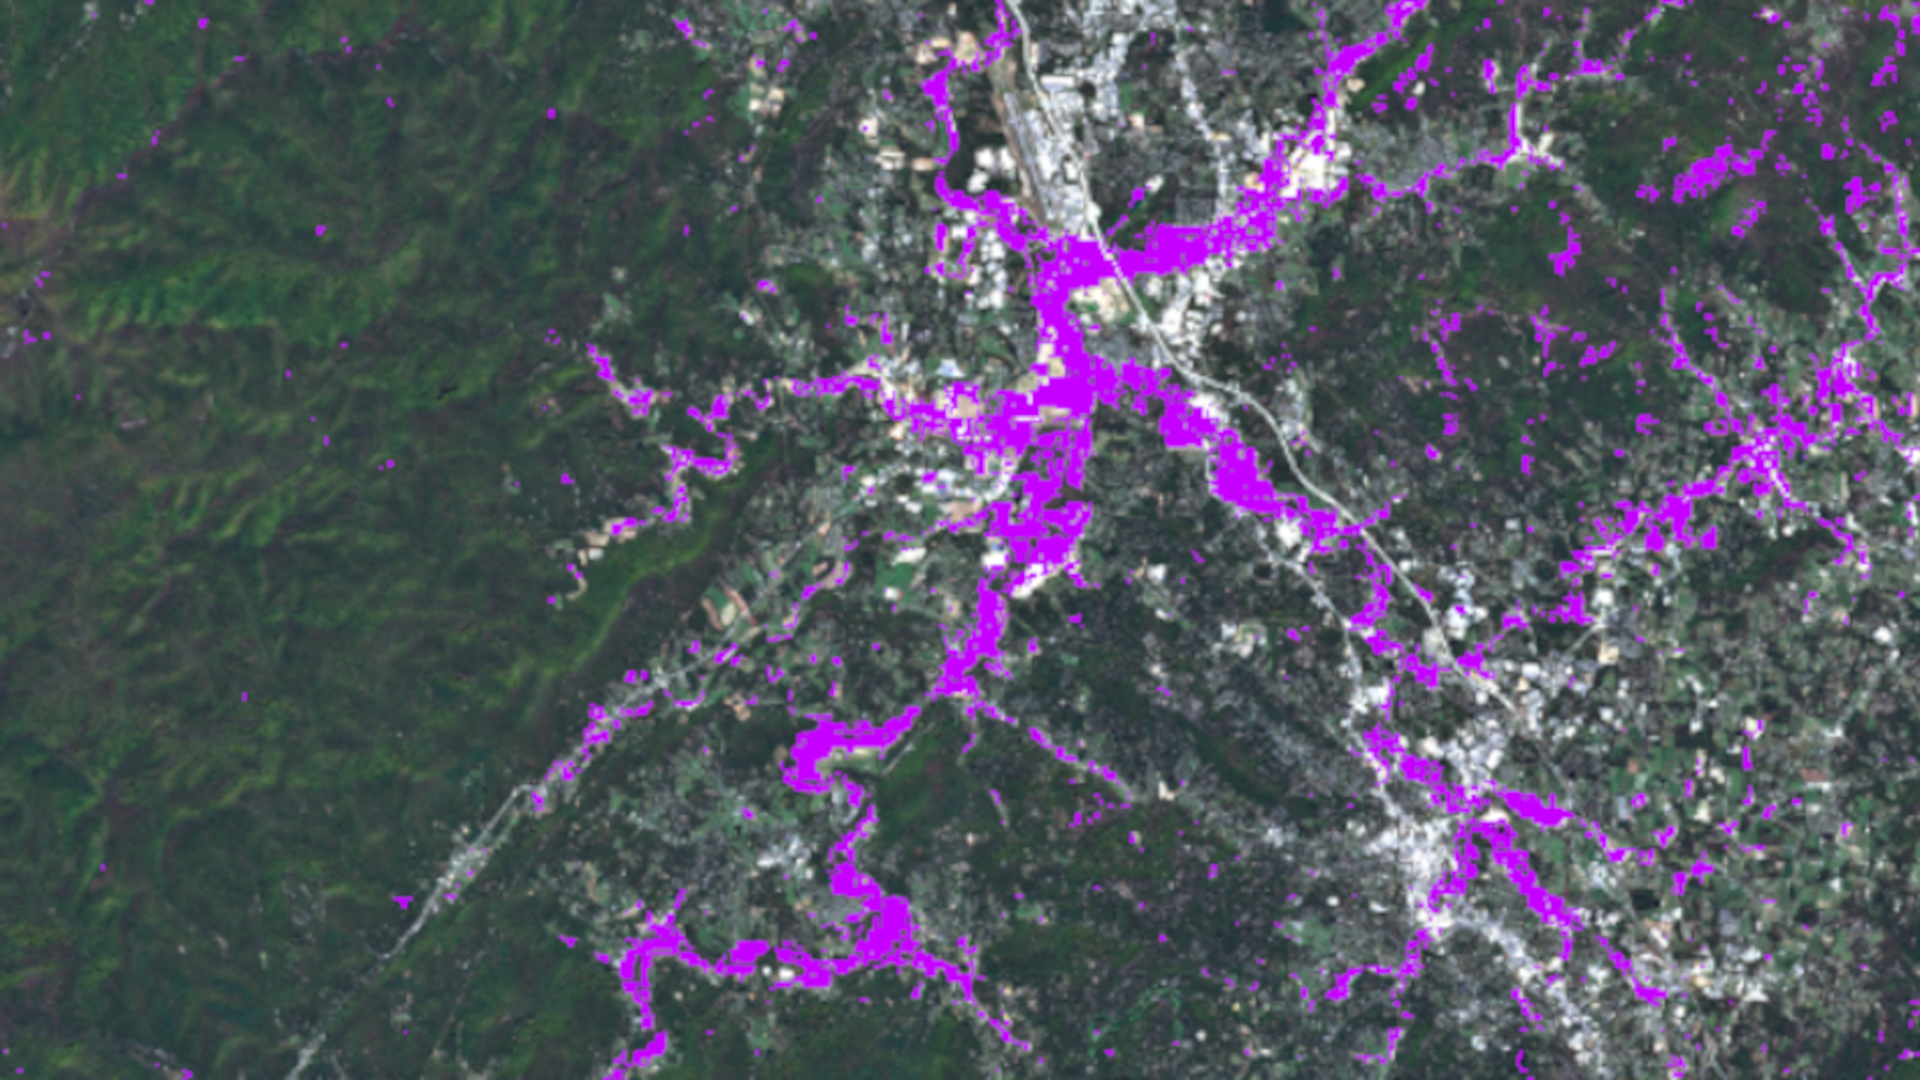
The result – flooded areas - Switch between these layers. You will find the result layer is quite accurate, matching the visible flooded areas on After image very well.
- Save your work.
Summary
We have demonstrated how to detect flooded areas by using Change Detection Multispectral ArcGIS Online with imagery layers from Sentinel-2 Level-2A in ArcGIS Living Atlas as input in Map Viewer of ArcGIS Online.
You can use the same template to detect floods in other areas in the world. You just need to select two new images according to the AOI and the date when the flood happens, then execute the template.
With this raster function template, you can also detect other changes that use spectral indexes for example, burn scars. In the Properties of Band Arithmetic, you just need to choose NBR for Method, and specify 12(SWIR) and 8 (NIR) for Band indexes. (Reference the document for Sentinel-2 band description, the document for spectral indexes). Save the changes. If you use Landsat Level-2 from ArcGIS Living Atlas as the data source, band indexes will be different. For NDWI, band 5 and 3 will be used, and for NBR, band 6 or 7 and 5 will be used. (Reference the description of Landsat Level-2 at here). You also can try different values for mask criteria, instead of 0.09.
In summary, by using ArcGIS Living Atlas and the power of raster function templates, you can do many kinds of change detection analysis in Map Viewer of ArcGIS Online.


This is a good article, but I got stuck on step 2: “Click Raster Function Templates on the ribbon in the Analysis window.” I only see Home, Tools, and History on my AGOL map ribbon.