Discover the Ready-to-Use Imagery Collection in ArcGIS
ArcGIS Living Atlas of the World is an Esri-curated collection of content produced by the GIS community. It is the largest collection of authoritative geospatial content in the world and contains thousands of apps, maps, layers, and tools that support users’ work. It seamlessly integrates with other ArcGIS tools and applications, enabling users to utilize the data in their own projects and analyses.
One variety of geospatial content the collection provides is high-resolution satellite and aerial imagery of environmental and urban features that is both current and from the past. Users can access recent high-resolution imagery for most of the world, lower-resolution global imagery that’s updated regularly, and near real-time imagery for areas affected by major events like natural disasters. Imagery in the Living Atlas includes intelligent layers, which lets users automatically restyle data to highlight characteristics, like healthy vegetation, for a quick and effective way to explore patterns. Users can also use imagery of the same place and compare past and present-day images to detect changes, which helps them understand shifts like how and where a city has grown.
This imagery collection provides ready-to-use global and national-scale imagery that is hosted in the cloud in ArcGIS Online. You can access and visualize this imagery without downloading and processing it, saving available storage space and time. Additionally, you can utilize most Living Atlas layers to perform analysis. However, until now, the spatial extent to which you can perform analysis was often limited to smaller, more local areas.
Optimized for Raster Analysis
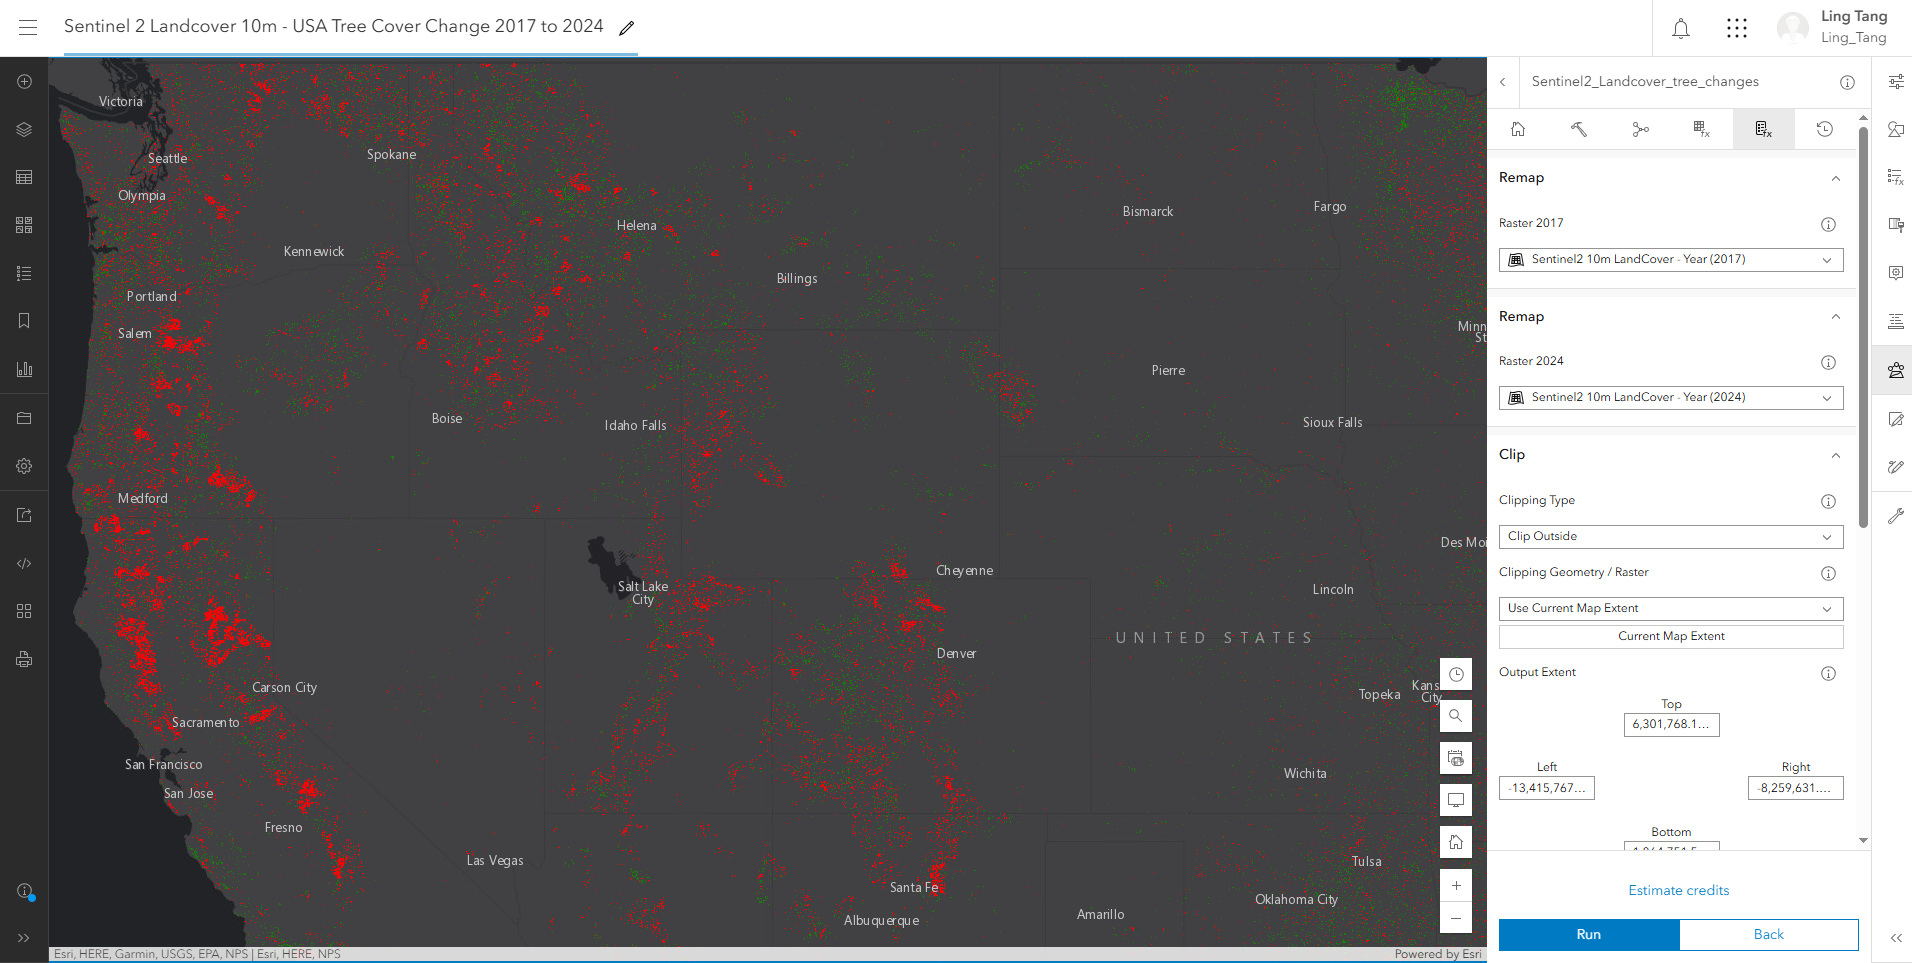
We’re excited to announce that the latest update of ArcGIS Online in June 2025 further optimizes raster analysis with imagery in ArcGIS Living Atlas of the World. We’ve updated a selection of imagery layers to support raster analysis in the cloud at a state-wide, country-wide, or even global scale. This is a significant improvement because it allows you to analyze much larger areas without restrictions. With these updates, you can leverage ArcGIS Online and the ArcGIS API for Python to perform a variety of advanced analyses, such as change detection, land classification, and pixel classification, and even use processing templates on imagery layers from Living Atlas to streamline your work.
Some examples of imagery you can use for this analysis include:
- Landsat provides medium-resolution (30 meters) images with 11 different bands. It’s commonly used for long-term environmental monitoring because it has data going back to the 1970s. It’s best for tasks like identifying land cover, tracking urban growth, and monitoring deforestation, where consistency over time is important.
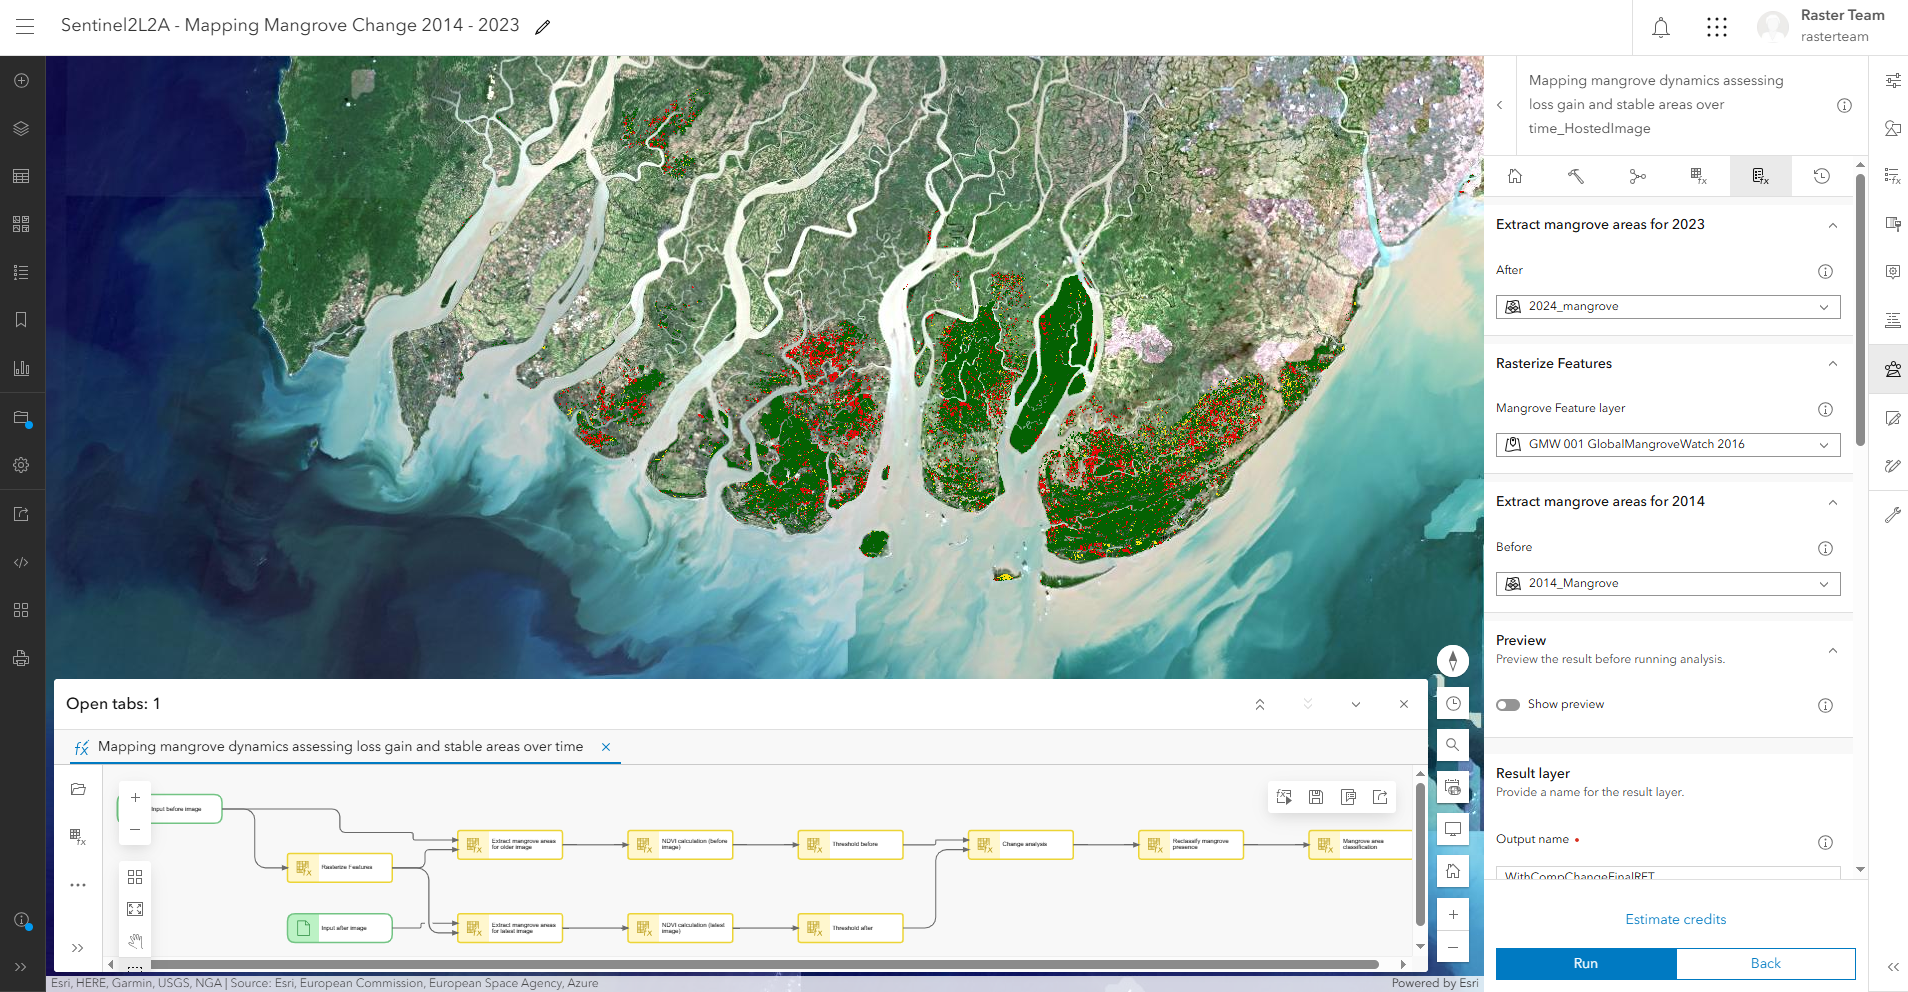
- Sentinel-2 offers medium-resolution (10–60 meters) images with 13 different bands, including special bands for vegetation. This makes it well suited for checking plant health, agriculture, and disaster response. It updates every 5 days and provides detailed information, making it ideal for mapping land use and vegetation.
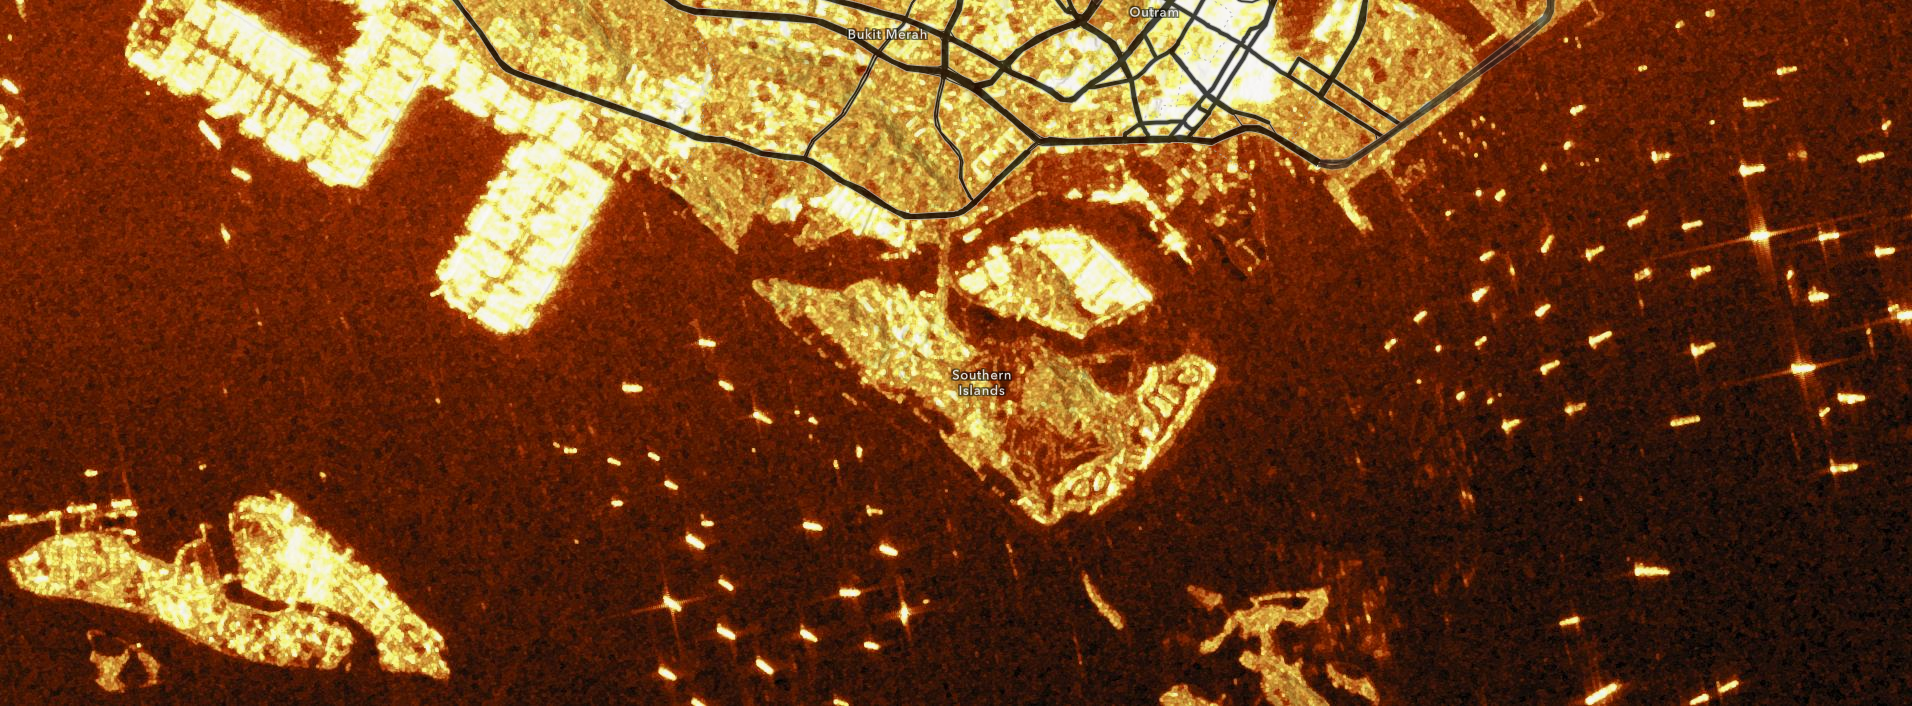
- Sentinel-1 uses radar technology, which works in all weather conditions and at any time of day. It’s commonly used for detecting floods, ground movement, and monitoring areas that are often cloudy, where regular cameras don’t work well.
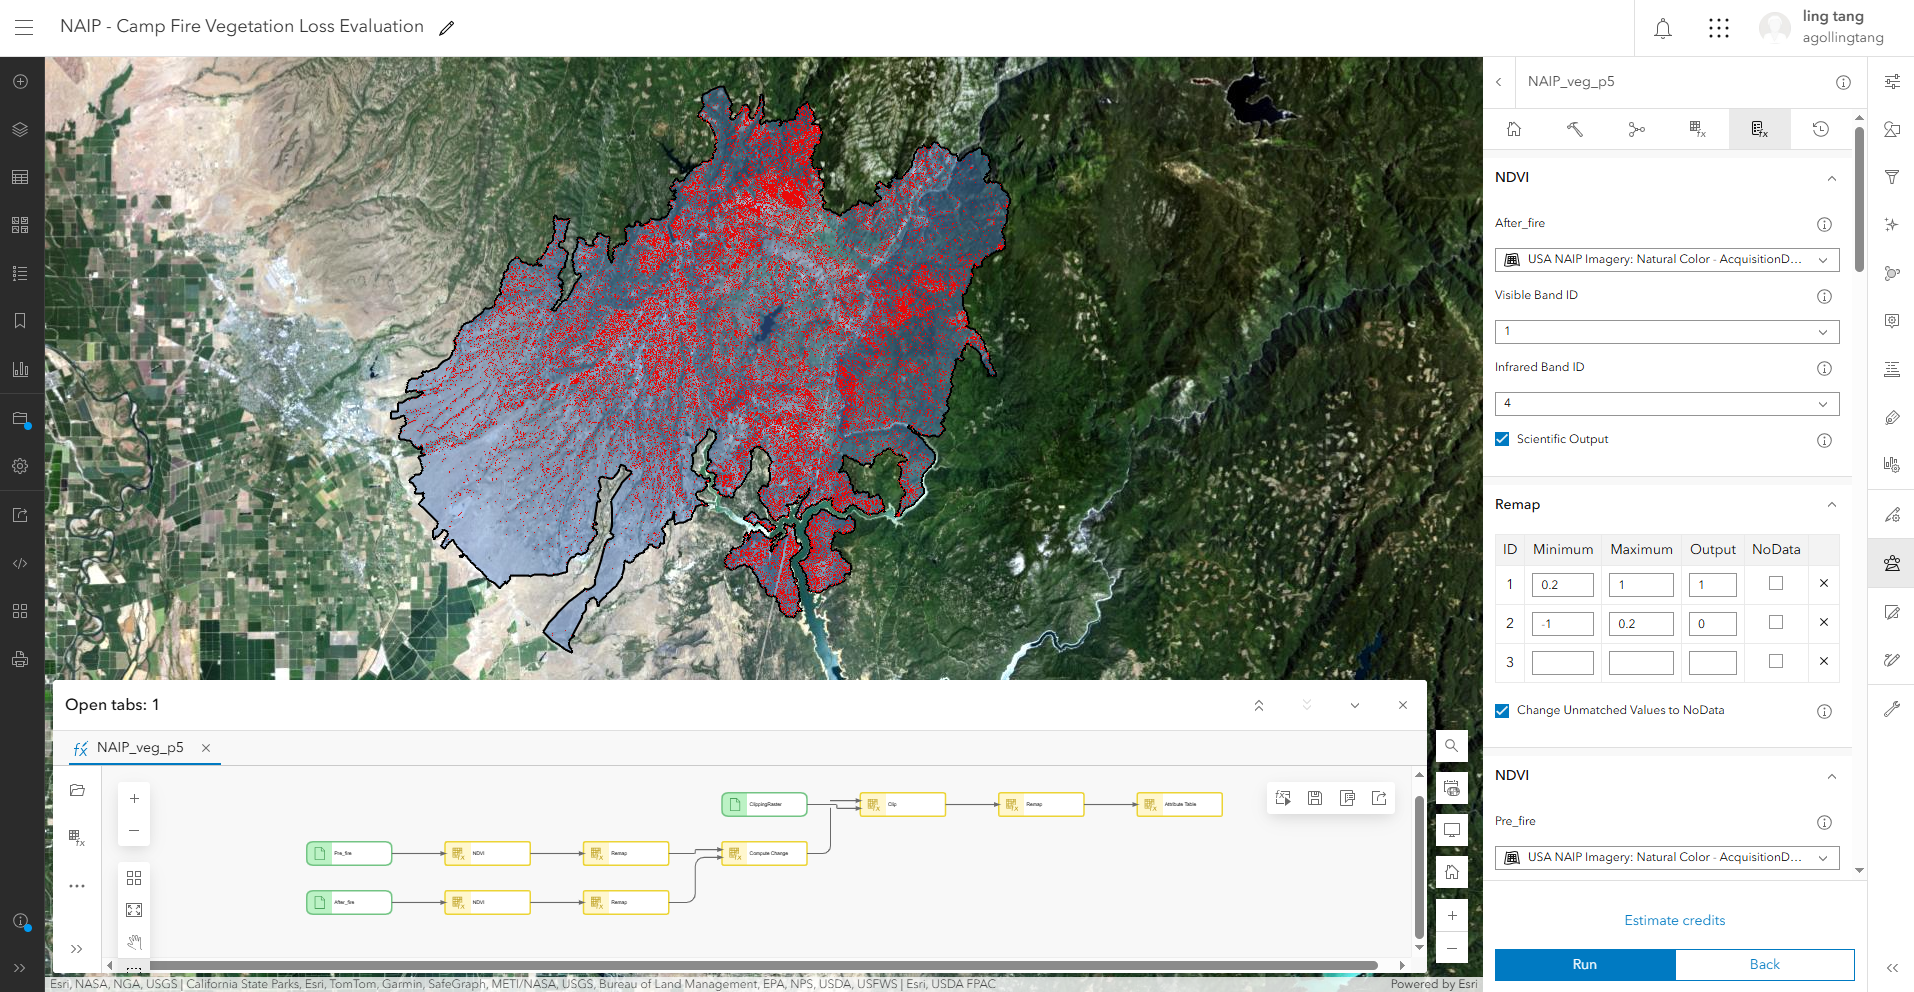
- NAIP provides high-resolution (1 meter) aerial images with 4 bands (red, green, blue, and near-infrared). It’s suited for local mapping, urban planning, and agricultural assessments. Its detailed images make it a strong base for analyzing small areas, though it’s not as good for detailed spectral analysis.
Unlock the Benefits of Ready-To-Use Imagery
Performing raster analysis directly on global and national-scale imagery, such as Landsat, Sentinel 2, Sentinel 1, and NAIP, provides a range of benefits. Here is how it can enhance your work:
- Stream Imagery and Bypass Downloading
Leverage ArcGIS Online to stream Landsat, Sentinel, and NAIP imagery continuously in the cloud. Now, you can stream this imagery for advanced analysis, unlocking deeper environmental and situational insights without the need to download it.
- Save on Credits for Storage
By streaming imagery directly from the cloud, you avoid the need to download and store massive data sets on your hardware or self-hosted infrastructure. This means you don’t have to purchase additional storage credits in ArcGIS Online, providing significant economic efficiency.
- Access Entire Data Sets Without Limitation
Your analysis can span large areas, even up to a global scale, without any restrictions.
- Save Time on Processing with Analysis-Ready Data
This optimization ensures your data is ready for advanced analysis, such as change detection or applying raster functions, right out of the box. No need to convert or preprocess the data, saving you valuable time.
Additionally, the seamless integration with ArcGIS, enables users to leverage preconfigured image analysis tools such as raster function templates and deep learning models to make extracting insights from this data easier. Read on to see an example of how you can use these tools and perform analysis on Landsat data in ArcGIS Online.
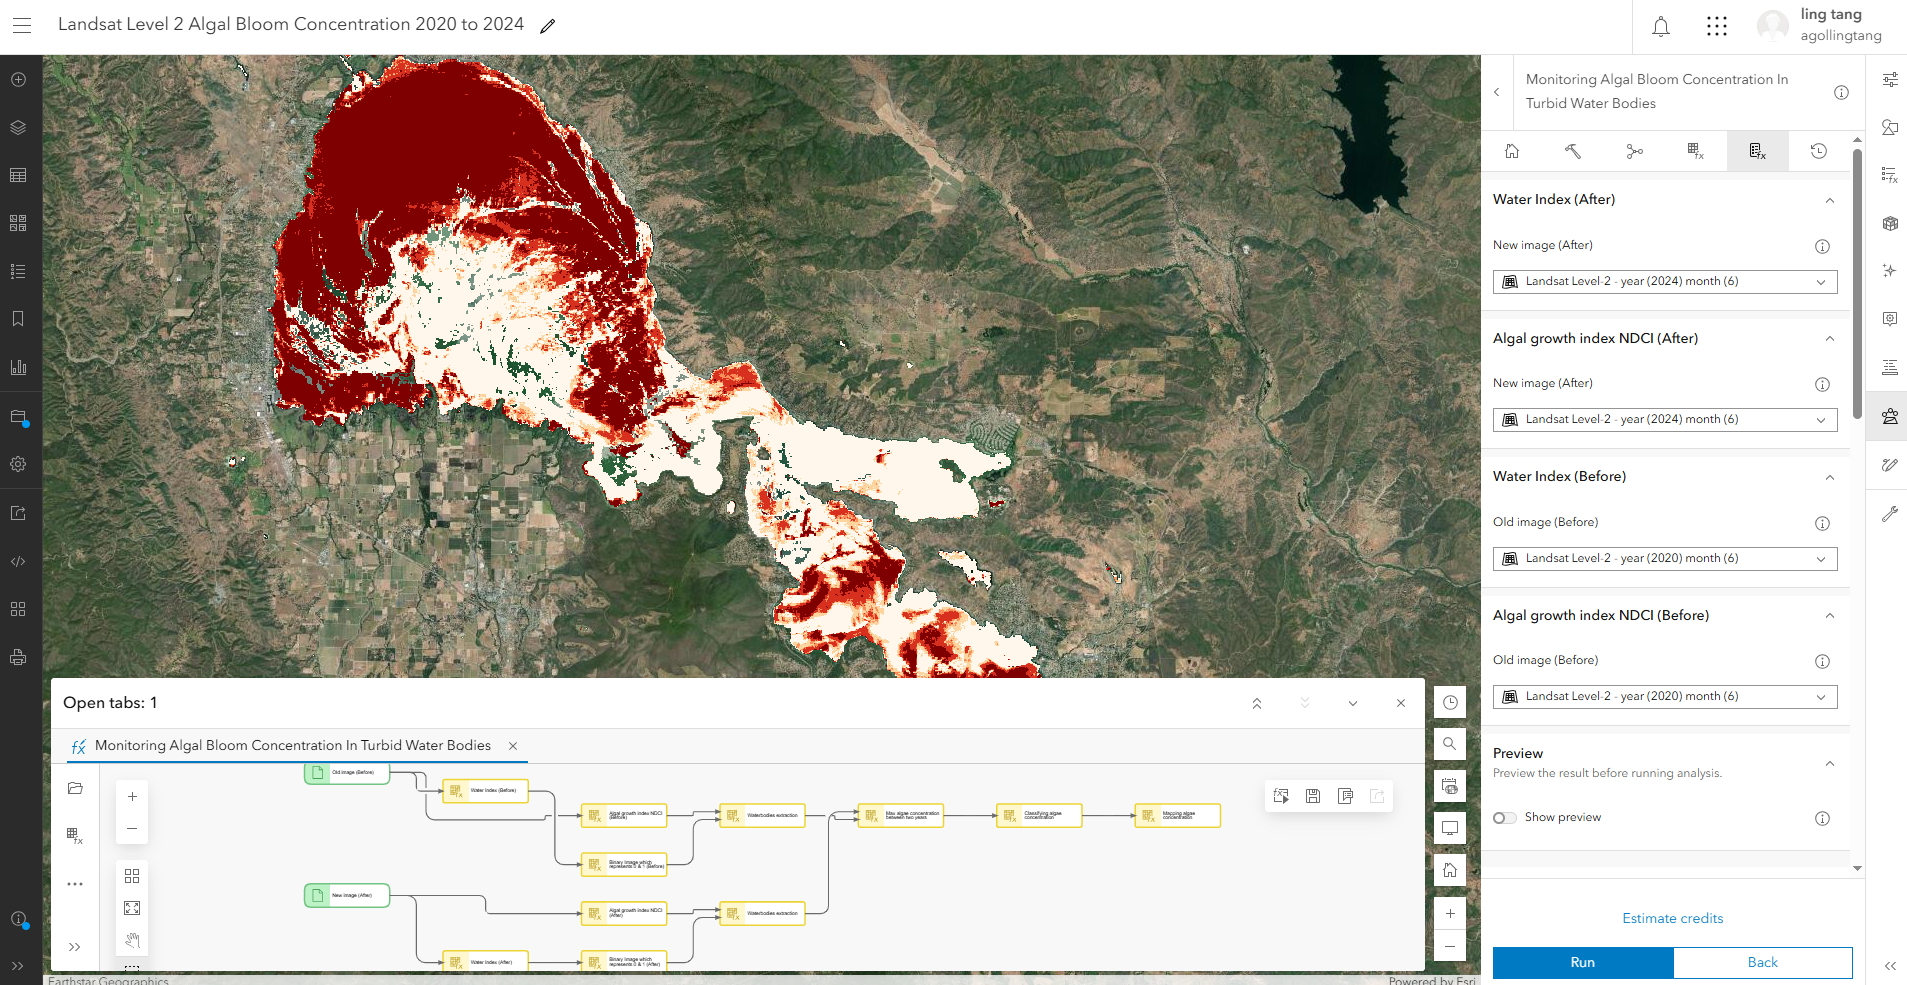
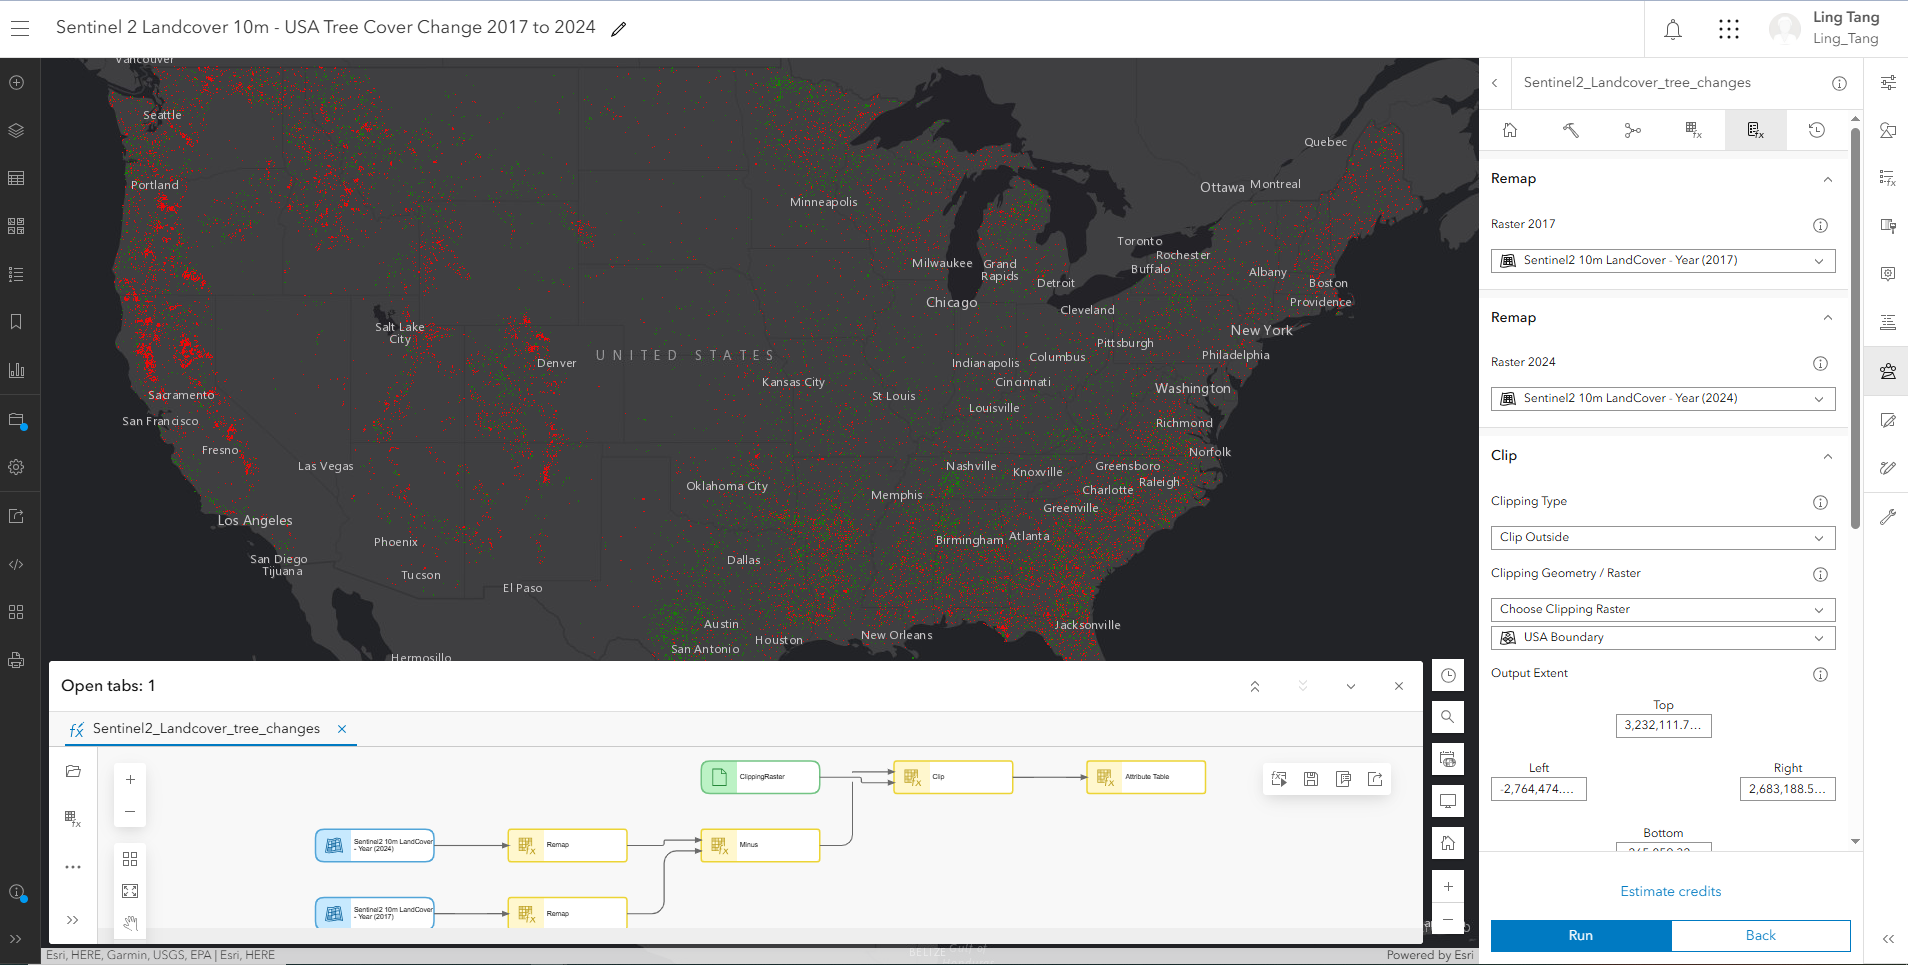
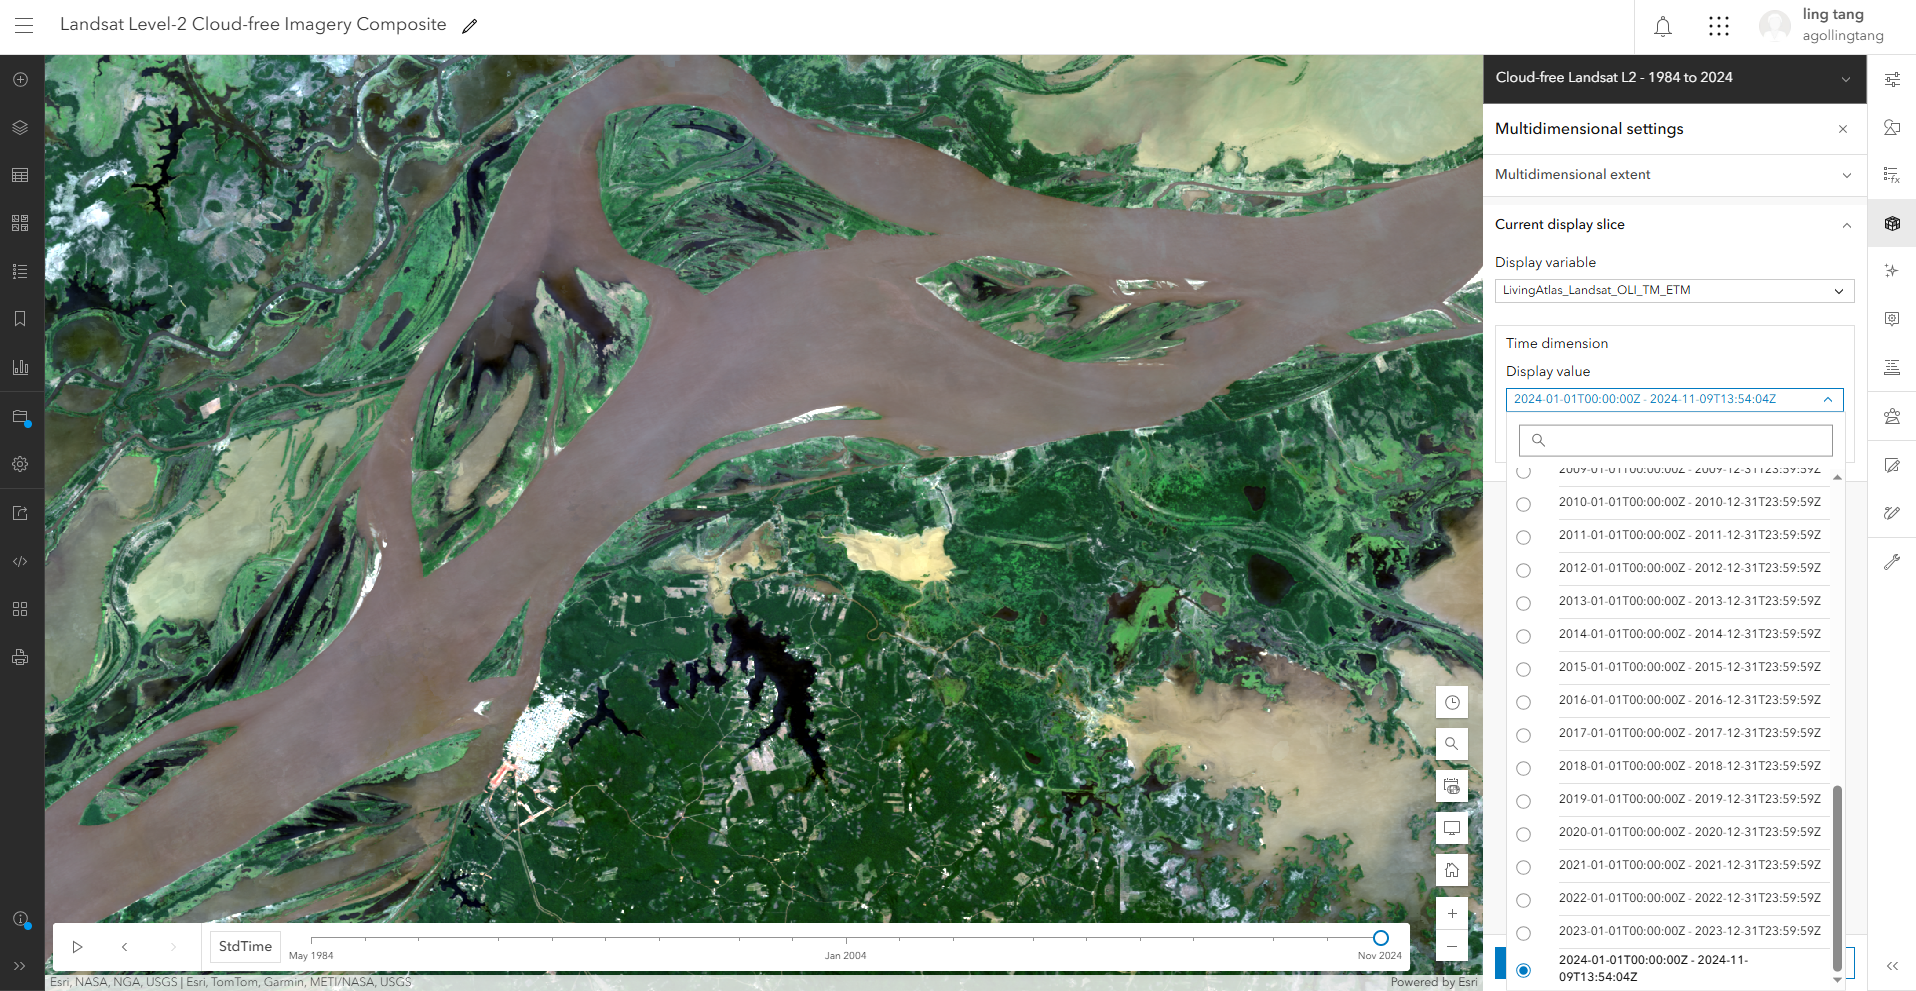
See it in Action – All Within ArcGIS Online
The demo above shows how to perform a change analysis workflow in ArcGIS Online using multispectral Landsat imagery to identify environmental changes in Amazon River floodplains over 40 years. It leverages Landsat Level 2 imagery from the ArcGIS Living Atlas and applies raster functions to create a change map. In this example, the optimized living atlas layers offered easier access to analysis ready data in ArcGIS Online. The entire analysis workflow was done without leaving ArcGIS Online. We ran change detection over any area of interest within any given time-period, without the need to download or publish data. We were empowered to leverage raster functions to perform advanced analysis with more efficiency.
How to Get Started
These improvements are now in general availability. To get started, an administrator will need to enable the “Raster analysis with Living Atlas data” option within your ArcGIS Online organization’s security settings. The raster analysis performed on Living Atlas layers is subject to the same credit rate as other input data types, which is calculated based on the amount of data processed and type of analysis. For more information on Image analysis credit use, read this documentation. For more detail on how to leverage ArcGIS Living Atlas ready-to-use imagery layers for analysis, read this blog post.


Article Discussion: