🔎The Science of Seeing More
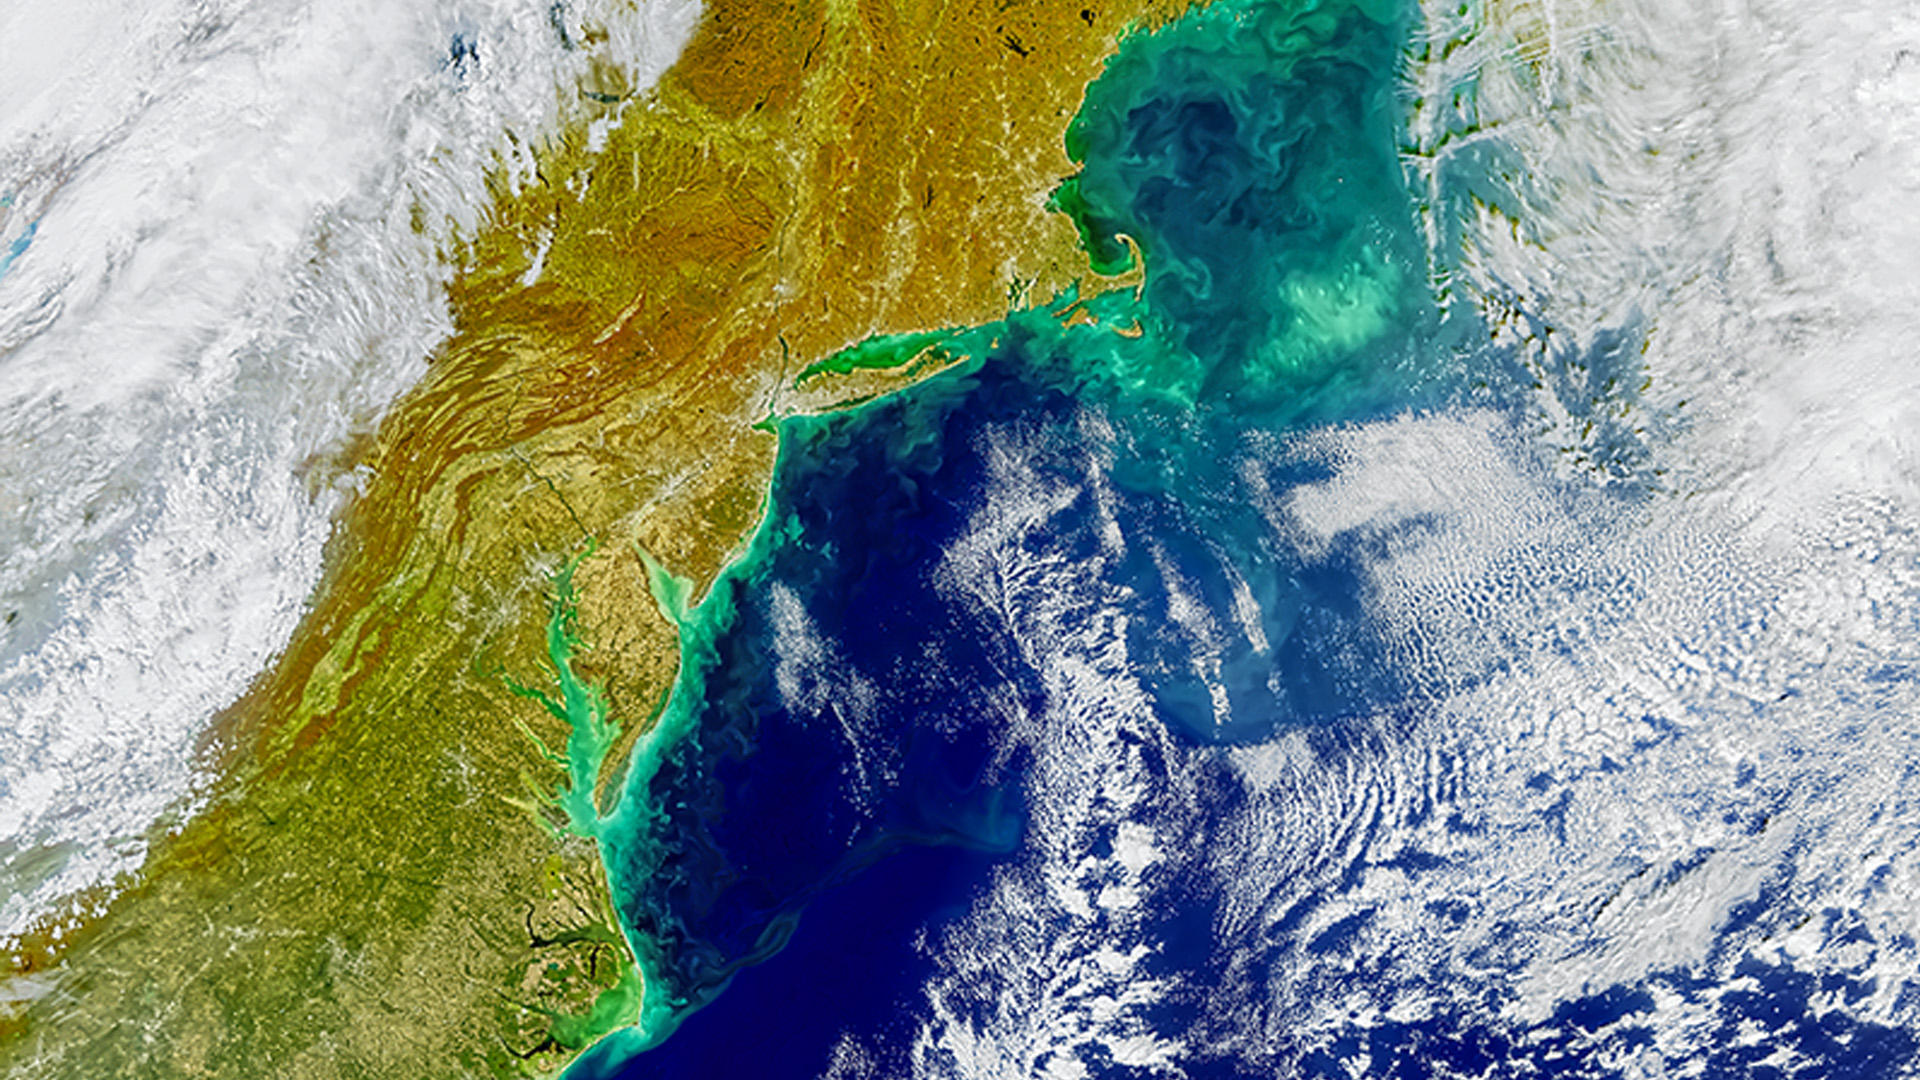
Remote sensing fans, get ready for NASA’s Plankton, Aerosol, Cloud, ocean Ecosystem (PACE) mission. PACE provides the world’s first global, daily, publicly available hyperspectral satellite data covering 350–890 nm wavelengths (that’s the ultraviolet, visible, and near-infrared range) with 1.2 km2 spatial resolution! This graduates us to a higher spectral resolution; in traditional imagery like Landsat and Sentinel, we are used to working with less than 15 visible and near infrared wavelengths. With PACE we now can use hundreds of wavelengths on the electromagnetic spectrum, a spectral upgrade that lets us see aerosols, ocean particles and phytoplankton, land vegetation, and clouds in a whole new light! Seeing the ocean from space has always been a challenge as seawater reflects little light, but PACE’s advanced optics capture both bright and dark targets, revealing hyperspectral details across land, ocean, and atmosphere. This mission is reshaping how we study our planet’s interconnected systems.
PACE Derived Products🌊🌿🌫️: 10 Ready to Use Image Services in ArcGIS Living Atlas
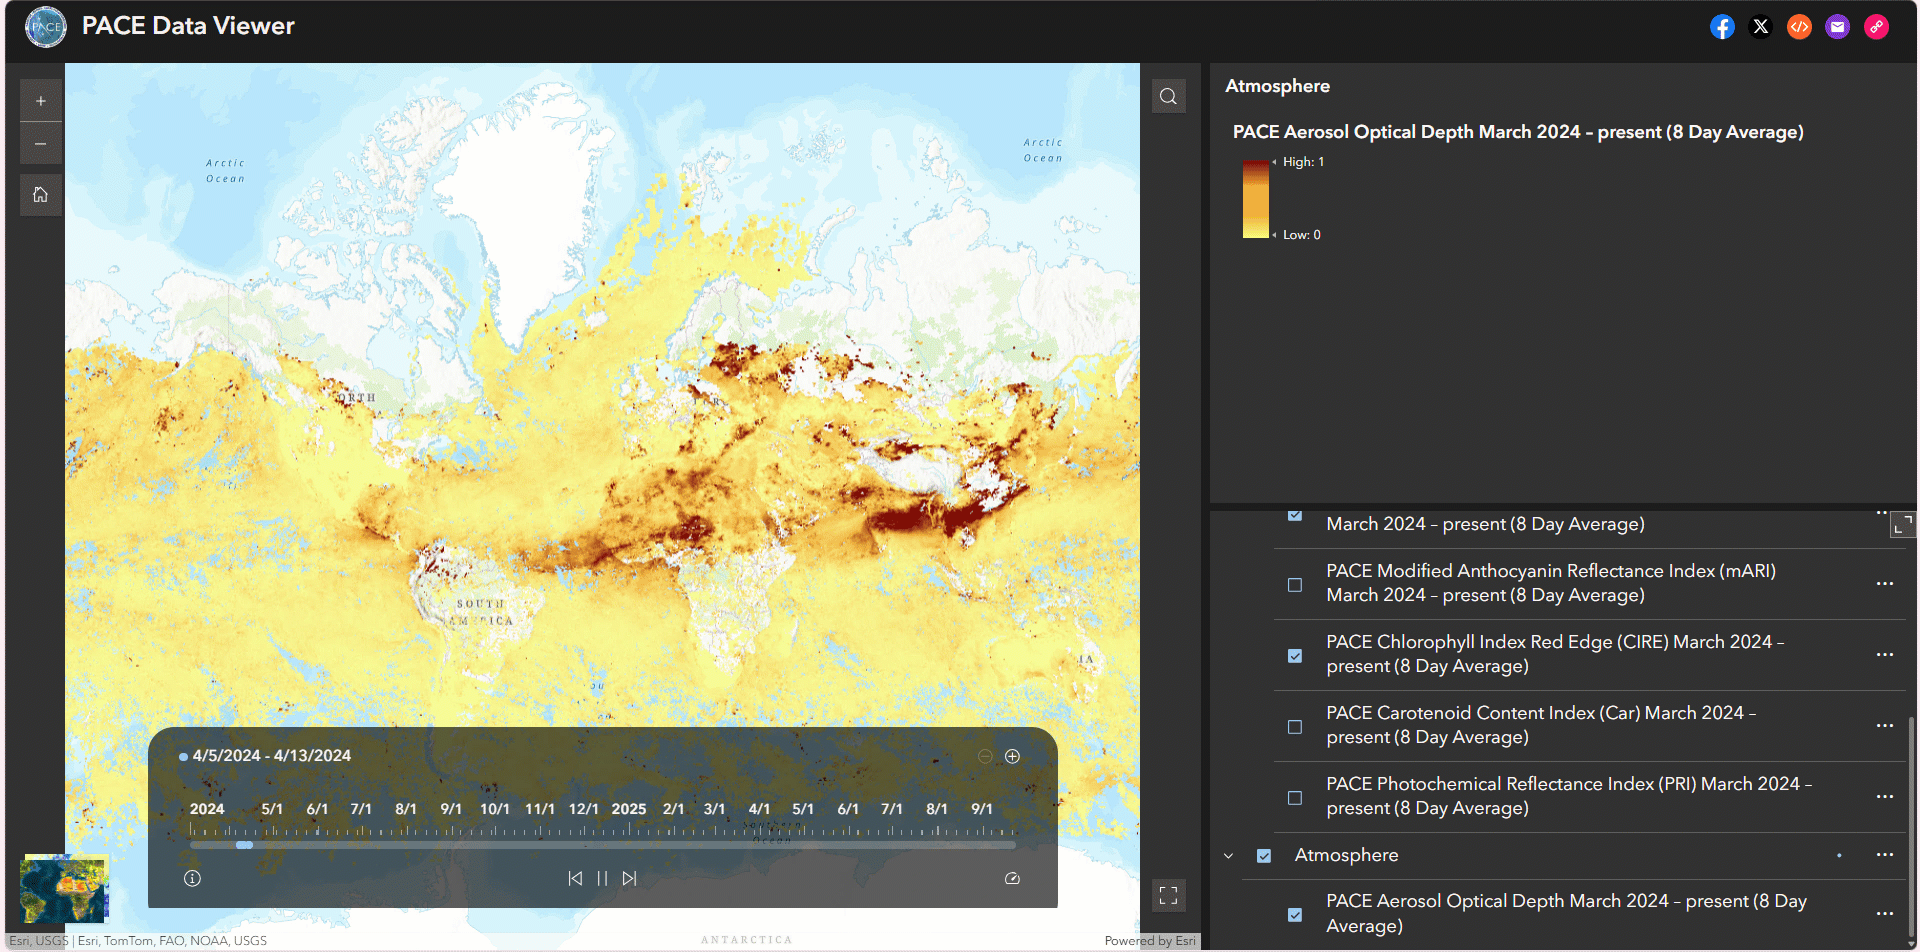
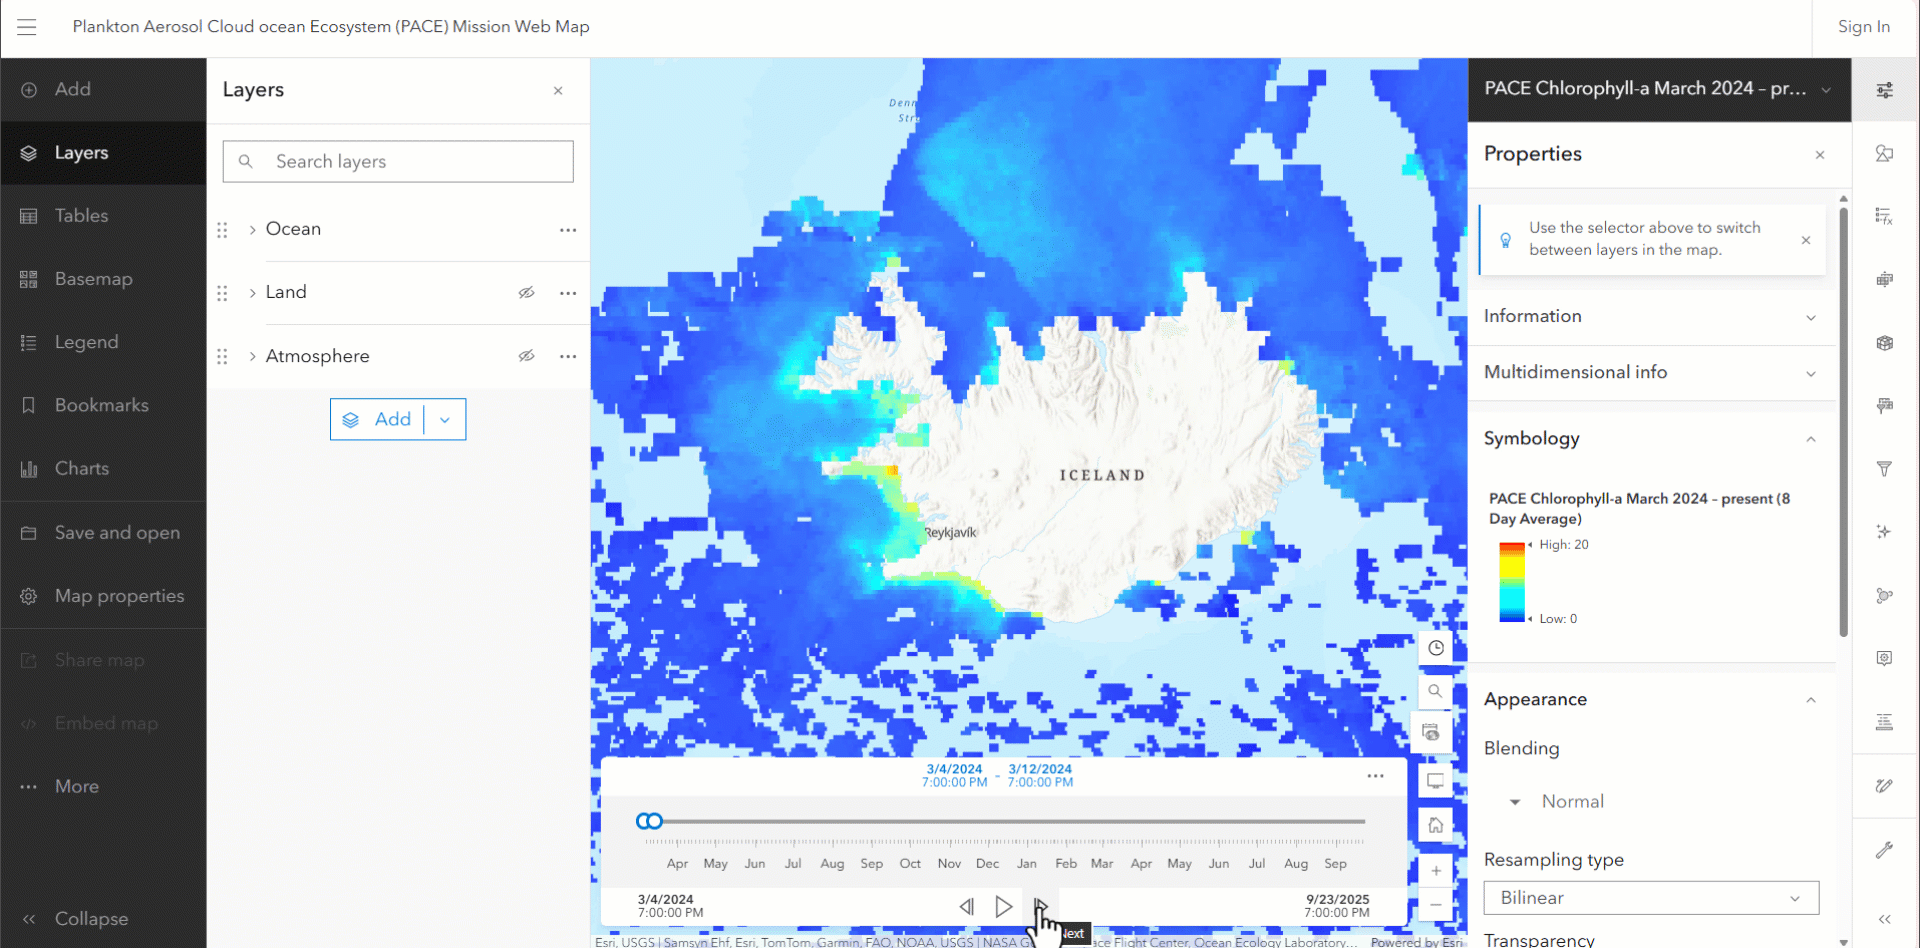
First, we’ll focus on scientifically derived products scientifically derived PACE products including ocean chlorophyll-a, vegetation indices, and aerosol optical depth. NASA Earthdata’s Geographic Information System (EGIS) team has released 10 analysis-ready PACE image services directly into the ArcGIS Living Atlas, giving you instant access to visualize, analyze, and compare environmental changes in both ArcGIS Pro and ArcGIS Online. These services are global, time-enabled and cover Earth’s land, ocean, and atmosphere. No downloads required! Interact with all 10 PACE image services directly in this Experience Builder application or NASA’s Plankton Aerosol Cloud ocean Ecosystem (PACE) Mission Web Map. Jump into PACE data action by navigating layers, toggling datasets, playing the time slider, and zooming to a location. To choose the right image service for you, check out NASA’s PACE content list for product descriptions, source information, and scientific context.
NASA’s Plankton Aerosol Cloud ocean Ecosystem (PACE) Mission Web Map
⬇️📂Downloading PACE Derived Data Products 🌊🌿🌫️
To directly download derived products, such as chlorophyll-a concentration, visit NASA Earthdata (be sure you have an Earthdata account!). While the 10 PACE ArcGIS image services provide ready-to-use access to key variables, NASA offers even more derived products at several time and space resolutions; check out the Data Products Overview list and Data Product Table. These datasets are analysis-ready and can be added directly into ArcGIS Pro, giving you more flexibility to work with data outside the pre-configured image services.
🌈PACE Hyperspectral Reflectance Data
We’ve looked at scientifically derived PACE products, now let’s transition to the hyperspectral reflectance data itself. Are you a user wanting to work beyond the derived PACE data products to perform advanced, custom hyperspectral analysis? With access to hundreds of spectral bands, you can investigate spectral features and build your own indices!
⬇️📂Downloading PACE Hyperspectral Data🌈
We recommend working with these two key hyperspectral datasets, available for download on NASA Earthdata.
- ⛰️For land and other applications: PACE OCI Level-3 Daily Global Mapped Surface Reflectance — about 122 bands at 2 km or 4 km resolution (also available in near-real-time). Use this for algorithms or studies that require reflectance measurements. The PACE land data products, for example, are derived from this information.
- 🌊For ocean applications: PACE OCI Level-3 Daily Global Mapped Remote-Sensing Reflectance — around 200 bands at 4 km resolution (also available in near-real-time). Use this for algorithms or studies of oceans, coasts, or large inland water bodies. The PACE chlorophyll-a product, for example, is derived from this information.
📊🔍Analyzing the Rainbow: From Spectra to Story🌈
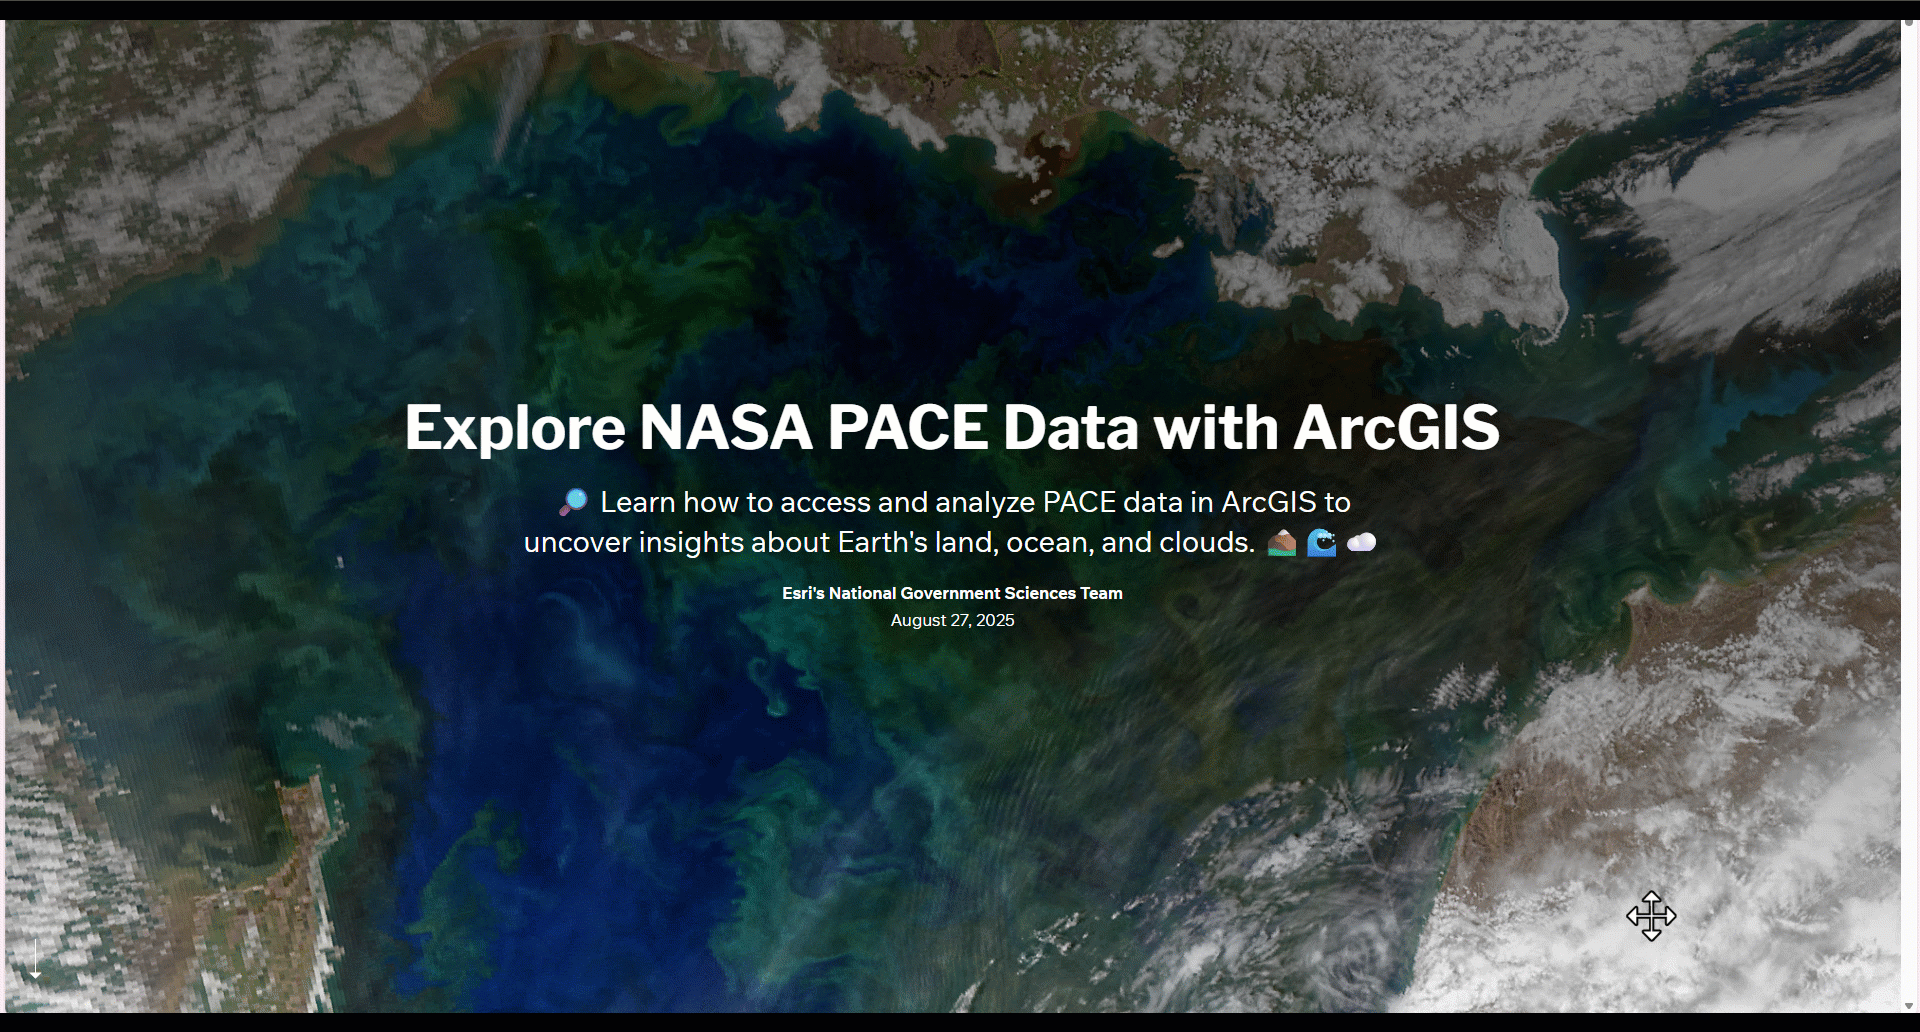
Now that you can download PACE hyperspectral data, the big question is: how do we start to analyze it? Let’s walk through how to bring PACE hyperspectral data into ArcGIS Pro and start turning hundreds of wavelengths into environmental insight. Immerse yourself in ArcGIS Pro workflows by reading this StoryMap: Explore NASA PACE Data with ArcGIS.
🛰️➕🗺️Adding hyperspectral data
ArcGIS supports hyperspectral data in raster formats including NetCDF, TIFF, ENVI formats, and more! Once your data is added to ArcGIS Pro, you can:
- Instantly browse all spectral bands
- Apply dynamic range adjustment for enhanced visualization
- Combine wavelengths directly in the Symbology pane. Check out an example of this workflow in this blog.
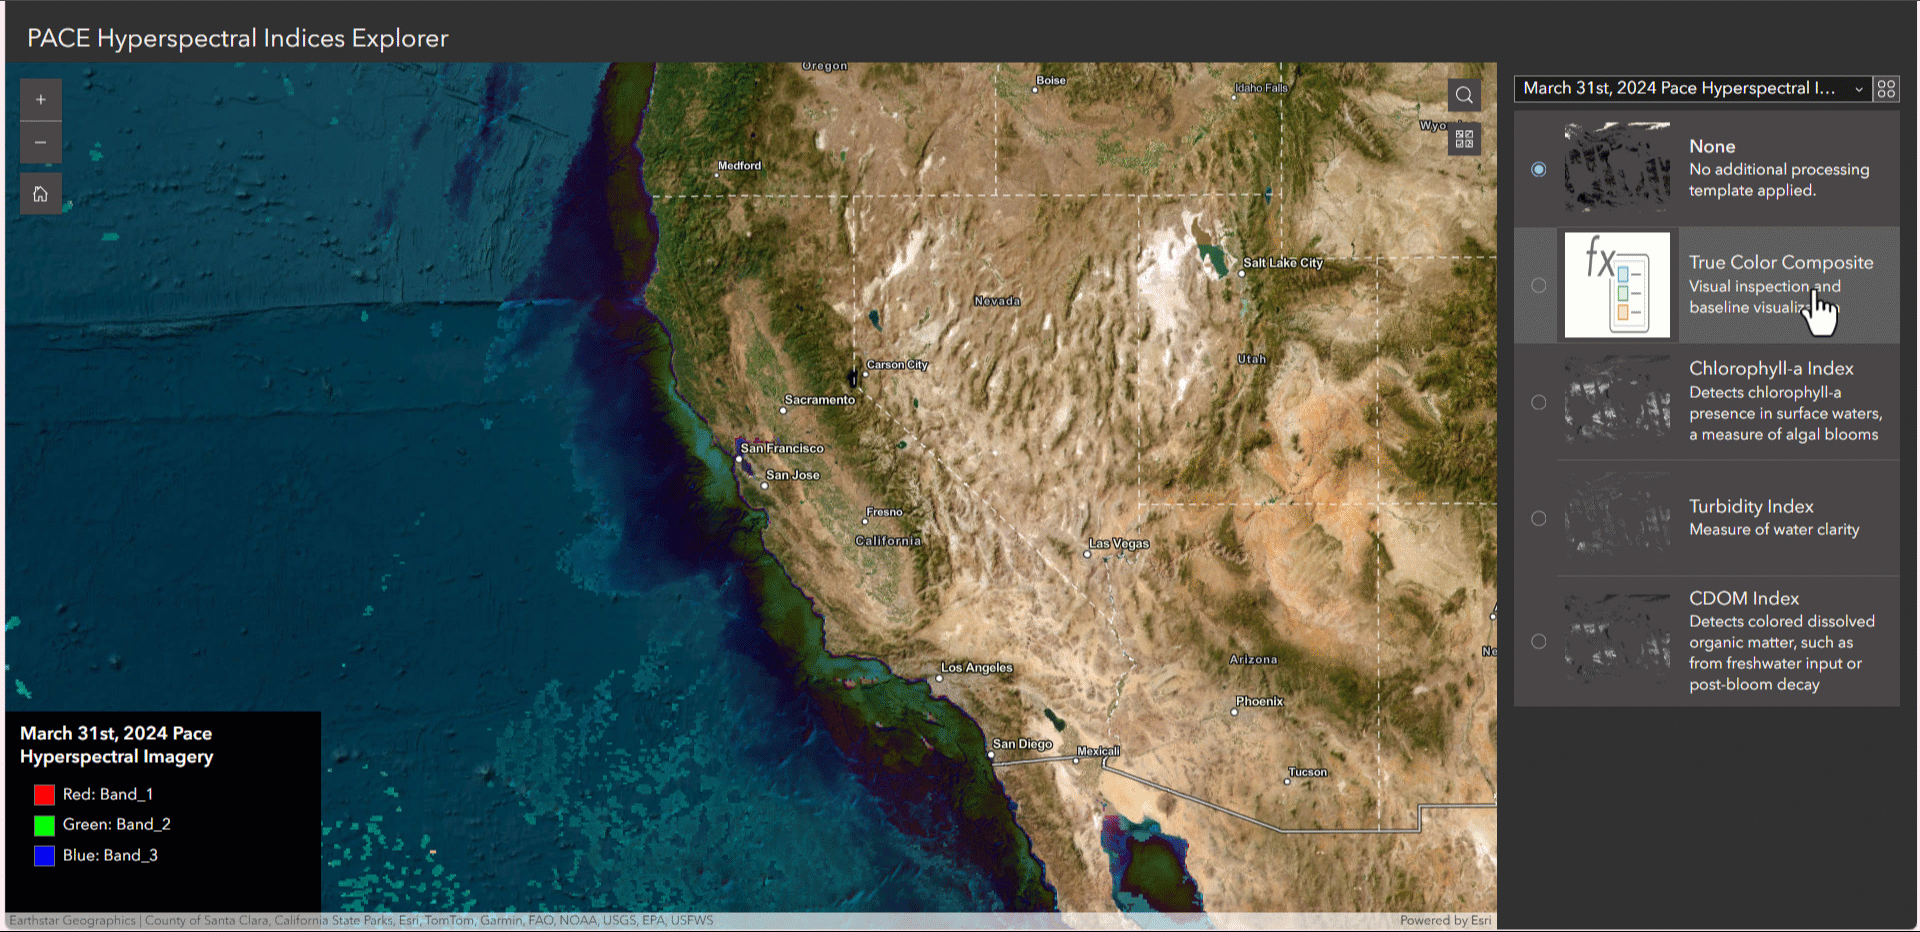
🖼️📦🗃️Mosaic Datasets and PACE Processing Templates
Working with multiple PACE scenes across time or space? You can manage and process multiple rasters together, instead of one-by-one, by adding the rasters to a mosaic dataset. Think of a mosaic dataset as a container that holds your rasters. The PACE OCI raster type comes with built-in processing templates for the hyperspectral and derived products. Learn more about creating a hyperspectral mosaic and what processing templates are available here.
🧩⚙️🖼️Raster Functions
With many potential band combinations and spectral indices, comes many processing responsibilities! Raster functions can be your best friend for on-the-fly processing; perform band math or combine multiple operations through raster function templates. No heavy processing required! To help you get started, my team created PACE-specific raster function templates that you can try right now. They simplify analysis for parameters such as chlorophyll-a, turbidity, or CDOM in one click.
🌈📚 Spectral Analysis
The vast number of wavelengths is powerful… and can be overwhelming! Spectral libraries, like the USGS spectral library, can now be opened directly in ArcGIS Pro. You can now visualize and compare spectral signatures of known materials to the pixels of your raster making interpretation far more intuitive. Furthermore, if you’re aiming to detect changes or anomalies, such as harmful algal blooms, you can take advantage of PACE’s daily global coverage. The Anomaly Detection Wizard provides a guided experience to highlight where and when conditions change over time. Learn more about all the hyperspectral capabilities of ArcGIS Pro in this blog and ArcGIS Pro documentation.
🔦🌎 Illuminating Our Planet
PACE lets us see our planet in hundreds of colors. Combined with ArcGIS, you can transform this spectrum into revealing insights of our oceans, the breath of our atmosphere, and life across Earth. Read about PACE’s vast applications with these beautiful StoryMaps from NASA PACE – Gallery. We encourage you to discover what’s possible, one wavelength at a time!
NASA StoryMaps PACE Series
Acknowledgements for this blog:
This blog was reviewed by Morgaine McKibben, Skye Caplan, and Allison Alcott from NASA Goddard Space Flight Center. Contributors include my colleagues on the Esri National Government Health & Sciences team: Cole Walts, Wynnie Gross, and Prentice McNair. Thank you for your contributions!

Article Discussion: