With the growing availability of imagery from sensors like AVIRIS, EMIT, and the launch of newer hyperspectral sensors, analysts need tools that make spectral analysis approachable and operational in ArcGIS Pro. Hyperspectral imagery provides hundreds of continuous spectral bands across visible, near infrared, and shortwave infrared regions, capturing rich information about the materials in your imagery. ArcGIS Pro 3.6 introduces powerful new tools, Spectral Library Browser, Spectral Library Viewer, and Target Detection Wizard with Detect Target Using Spectra and Resample Spectral Library geoprocessing tools, enabling applications from geologic mapping and mineral detection to precision agriculture and environmental monitoring.
With these enhancements, analysts can move beyond standard classification workflows, leveraging detailed spectral information for advanced tasks such as target detection, material validation, vegetation monitoring, and spectral unmixing.
What Is a Spectral Library?
A spectral library is a curated collection of spectral signatures that describe how materials reflect light across wavelengths. Organizations like the U.S. Geological Survey (USGS) have compiled thousands of reference spectra covering vegetation, minerals, soils, and man-made surfaces. The spectral signatures in these libraries serve as foundational references for analyses such as mineral mapping, vegetation classification, and environmental monitoring, enabling more accurate, validated results.
How ArcGIS 3.6 Supports Spectral Library
With Pro 3.6, you can:
- Open existing spectral libraries, including USGS and ENVI collections.
- Collect spectral signatures directly from imagery and save them as Esri Spectral Library (.esl) files.
- Perform interactive spectral analysis, target detection, and spectral unmixing workflows using these signatures.
These capabilities streamline your hyperspectral analysis. The introduction of spectral library support opens the doors to advanced image analysis capabilities that go beyond traditional image classification.
New Feature Highlights
1.Export Spectra from USGS Spectral Libraries
The USGS Spectral Library contains thousands of spectra from diverse sensors and materials. The Spectral Library Browser allows you to open the library from the root ASCII folder—or filter by specific sensor or material category. You can interactively select, view, and export signatures as an Esri Spectral Library file for analysis such as target detection and spectral unmixing workflows.

2.Create a Spectral Library from Imagery
The enhanced Spectral Signature Viewer makes it easier to collect, edit, and save spectral signatures from imagery to create your own spectral libraries.

3.Explore Spectral Signatures Interactively
The Live Update option in the Spectral Signature Viewer lets you interactively explore spectral profiles as you move your cursor over imagery. Real-time updates help you identify meaningful signatures quickly, keeping your spectral library focused and organized.

4.Compare Spectral Signatures from Multiple Sources
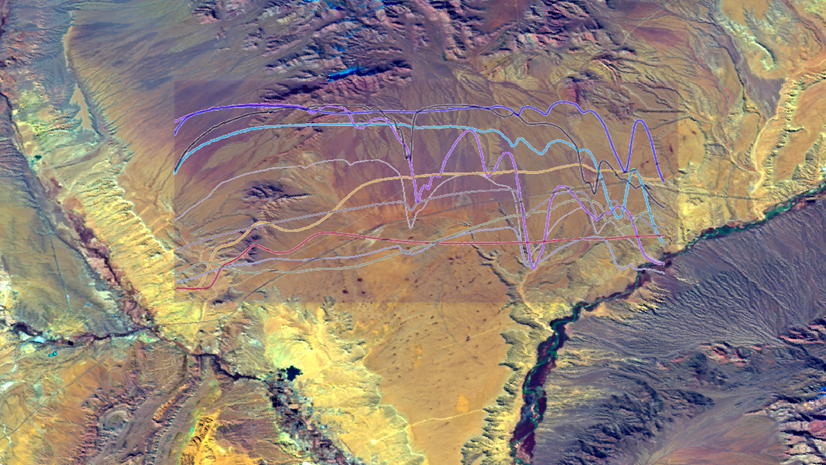
The Spectral Signature Viewer enables visualization of signatures from both imagery and spectral libraries, in one window or side by side, comparing your image-derived signatures with library references or examine spectral changes across different dates.
For example, the figure below shows vegetation spectral changes in wetlands near UC Santa Barbara over February and May, illustrating how reflectance patterns evolve with moisture

5. Highlight Materials Using RGB Handles
The RGB Handles in the viewer indicate which spectral bands are currently used for RGB display. By adjusting these handles, you can emphasize pixels that share similar spectral absorption characteristics.
For example, Jarosite exhibits a distinct shortwave infrared absorption feature, placing the red handle over a reflectance peak and green/blue handles over absorption valleys, highlights Jarosite-like pixels in reddish tones.

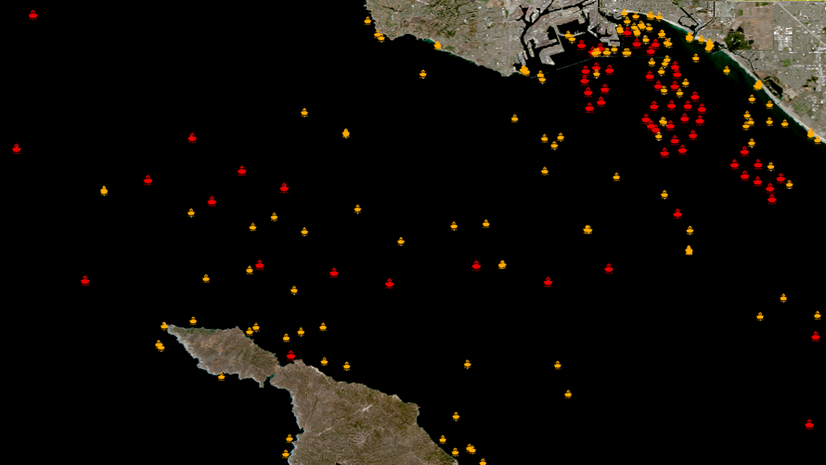
6.Detect Materials with Target Detection
Spectral libraries are essential for identifying materials of interest in imagery. The Target Detection Wizard guides you through defining processing extent, choosing an algorithm, tunning threshold, and generating results. In the Colorado mountains, mineral signatures like Hematite, Pyrite, and Rhodochrosite were selected from USGS library, detected using the Spectral Angle Mapper (SAM) algorithm, producing clear mineral maps in just a few steps.

7. Spectral Unmixing for Mixed Pixels
Remote sensing pixels often contain mixtures of multiple materials. Linear spectral unmixing calculates the abundance of each material within a pixel. In ArcGIS Pro 3.6, the Linear Spectral Unmixing tool has been enhanced to support spectral libraries. You can now use signatures collected from imagery or selected from an existing library as the reference endmember, streamlining the linear unmixing workflow and improving consistency across projects.
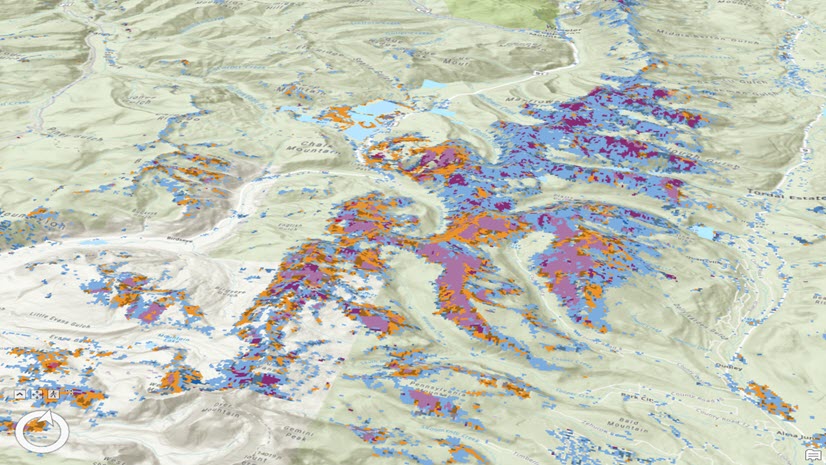
The figure below shows an abundance map of trees, grassland, and shrubs within the Jack and Laura Dangermond Preserve. The spectral signatures were collected from field GPS data using the Spectral Signature Viewer and applied to an AVIRIS hyperspectral imagery using the Linear Spectral Unmixing Geoprocessing tool.

Summary
ArcGIS Pro 3.6 provides a comprehensive environment for hyperspectral analysis. From integrating USGS spectral libraries and building custom collections to performing target detection and spectral unmixing, these tools make it easier to turn detailed spectral data into meaningful insights.
Explore these new capabilities in your workflows and share your feedback to help guide future enhancements.


Great job ESRI . Great team!!