Imagine petabytes of Earth observation imagery streaming on-demand, ready-to-explore and ready-to-analyze. Imagine deriving and disseminating insights, seamlessly putting decision makers in the driver’s seat. All from a web browser.
Not that long ago, a system for accessing, analyzing, and deriving insights from massive imagery archives, without actively procuring compute resources or downloading even a single data file, was hard to imagine. With the convergence of available Earth observation data, internet and cloud technology, powerful ready-to-use raster analysis tools in ArcGIS Online, and authoritative ready-to-use imagery content from ArcGIS Living Atlas of the World, deriving information and insights from imagery has never been more accessible. This level of accessibility has lowered the barrier of entry and is opening doors for users, organizations, and applications across a broad range of industries.
It takes a comprehensive and robust system to make this all possible. This article will primarily focus on Living Atlas imagery as an integral piece of the system and serve as a quick reference guide on ready-to-use imagery layers for analysis.

Table of Contents
- Imagery layers available for analysis
- Imagery layers optimized for analysis
- Enabling imagery layers optimized for analysis
- Applications and Tutorials
Imagery layers available for analysis
In ArcGIS Living Atlas, imagery data is provided as services via imagery layers. Layers are logical collections of geographic data that are used to create maps and are the basis for geographic analysis. Imagery can be provided and accessed through various layer types including tile layers, dynamic imagery layers, and tiled imagery layers. While even tile layers can be used for certain types of analysis, the focus of this article is on imagery layers. Imagery layers include collections of both continuous and discrete raster data, and they can maintain and provide access to source pixel values.
Living Atlas provides a rich collection of ready-to-use imagery layers. While most of these layers are enabled for analysis, some are better suited for certain levels and types of analysis. With this in mind, it is useful to understand that a layer will typically fall into one of three general analysis categories:
1. Limited single source analysis: the layer has size limitations for analysis and may not be optimal for use with other layers in multisource analysis.
2. Single source analysis: the layer does not have defined size limitations for analysis but may not be optimal for use with other layers in multisource analysis.
3. Optimized for analysis: the layer provides scalability for larger and more diverse analysis without size constraints and is optimal for multisource analysis.
This information can be found in the layer item description. Some items will have a “Key Properties” or a “Dataset Summary” section providing the analysis category.
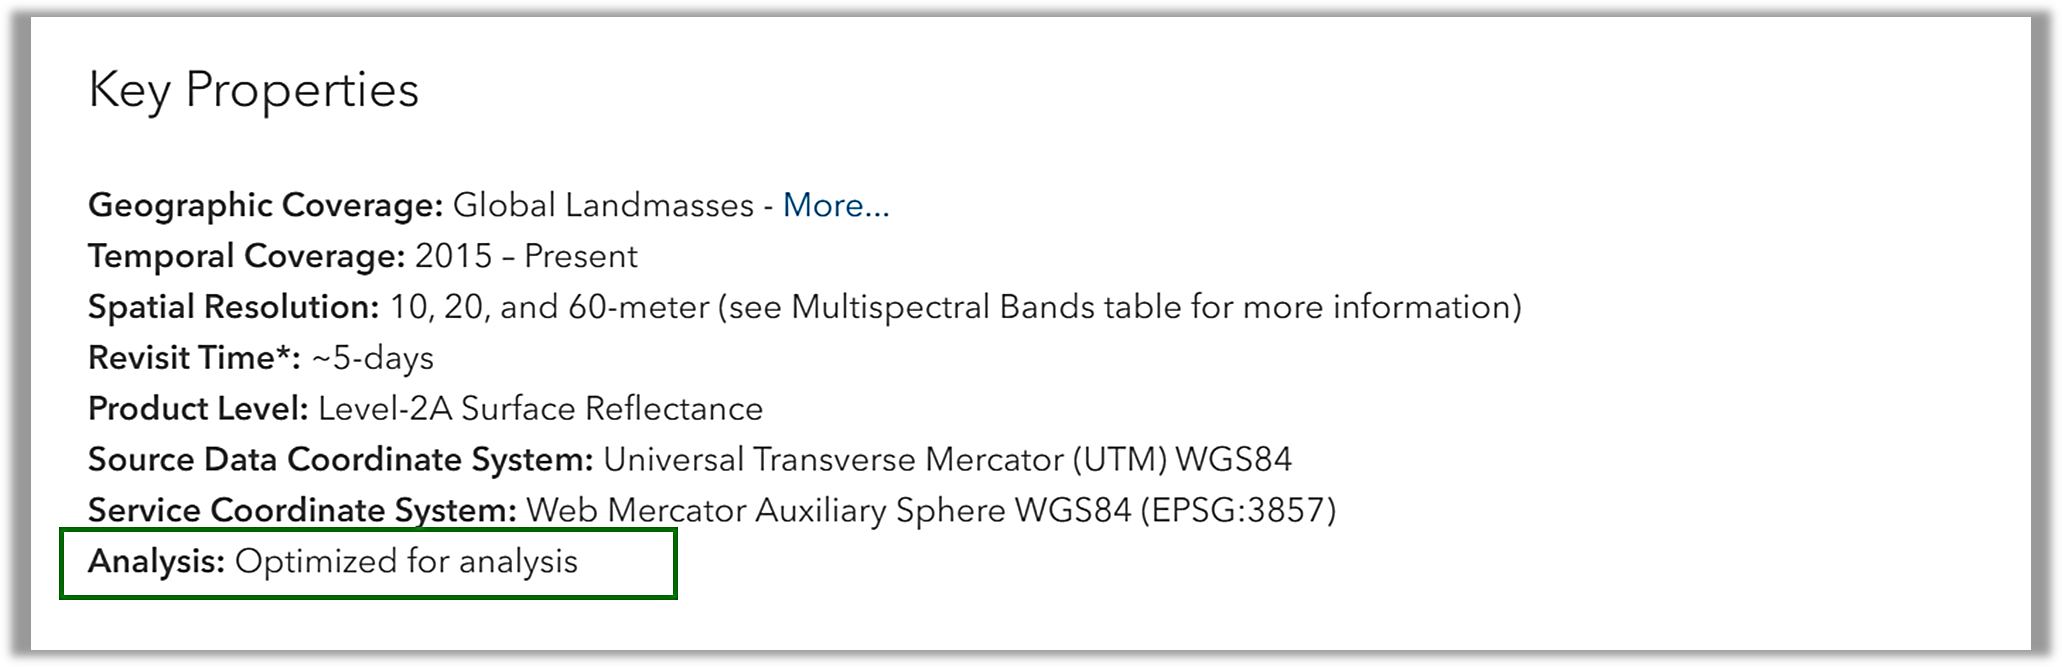
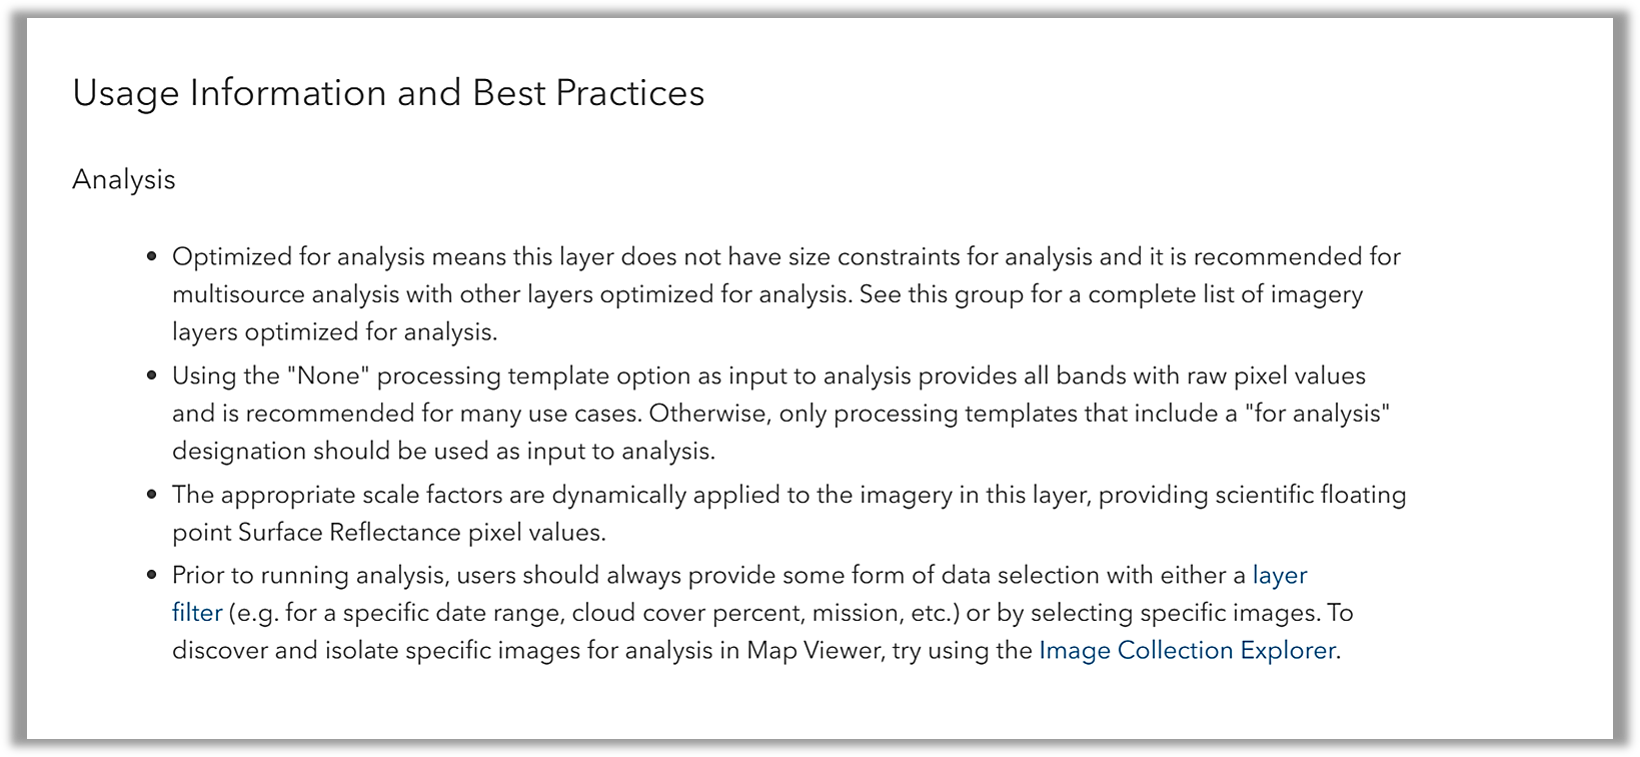
Item descriptions may also include sections such as “What can you do with this layer” or “Usage information and best practices” providing additional information about analysis.
Imagery layers optimized for analysis
Of the three categories noted above, layers optimized for analysis often provide the most utility. With these layers, users are able to scale up their analysis across larger geographies and deeper historical records. With these layers, users are also able to integrate and analyze multiple optimized layers at once, gaining more comprehensive insights to better understand and address the local, national, and global challenges we face.
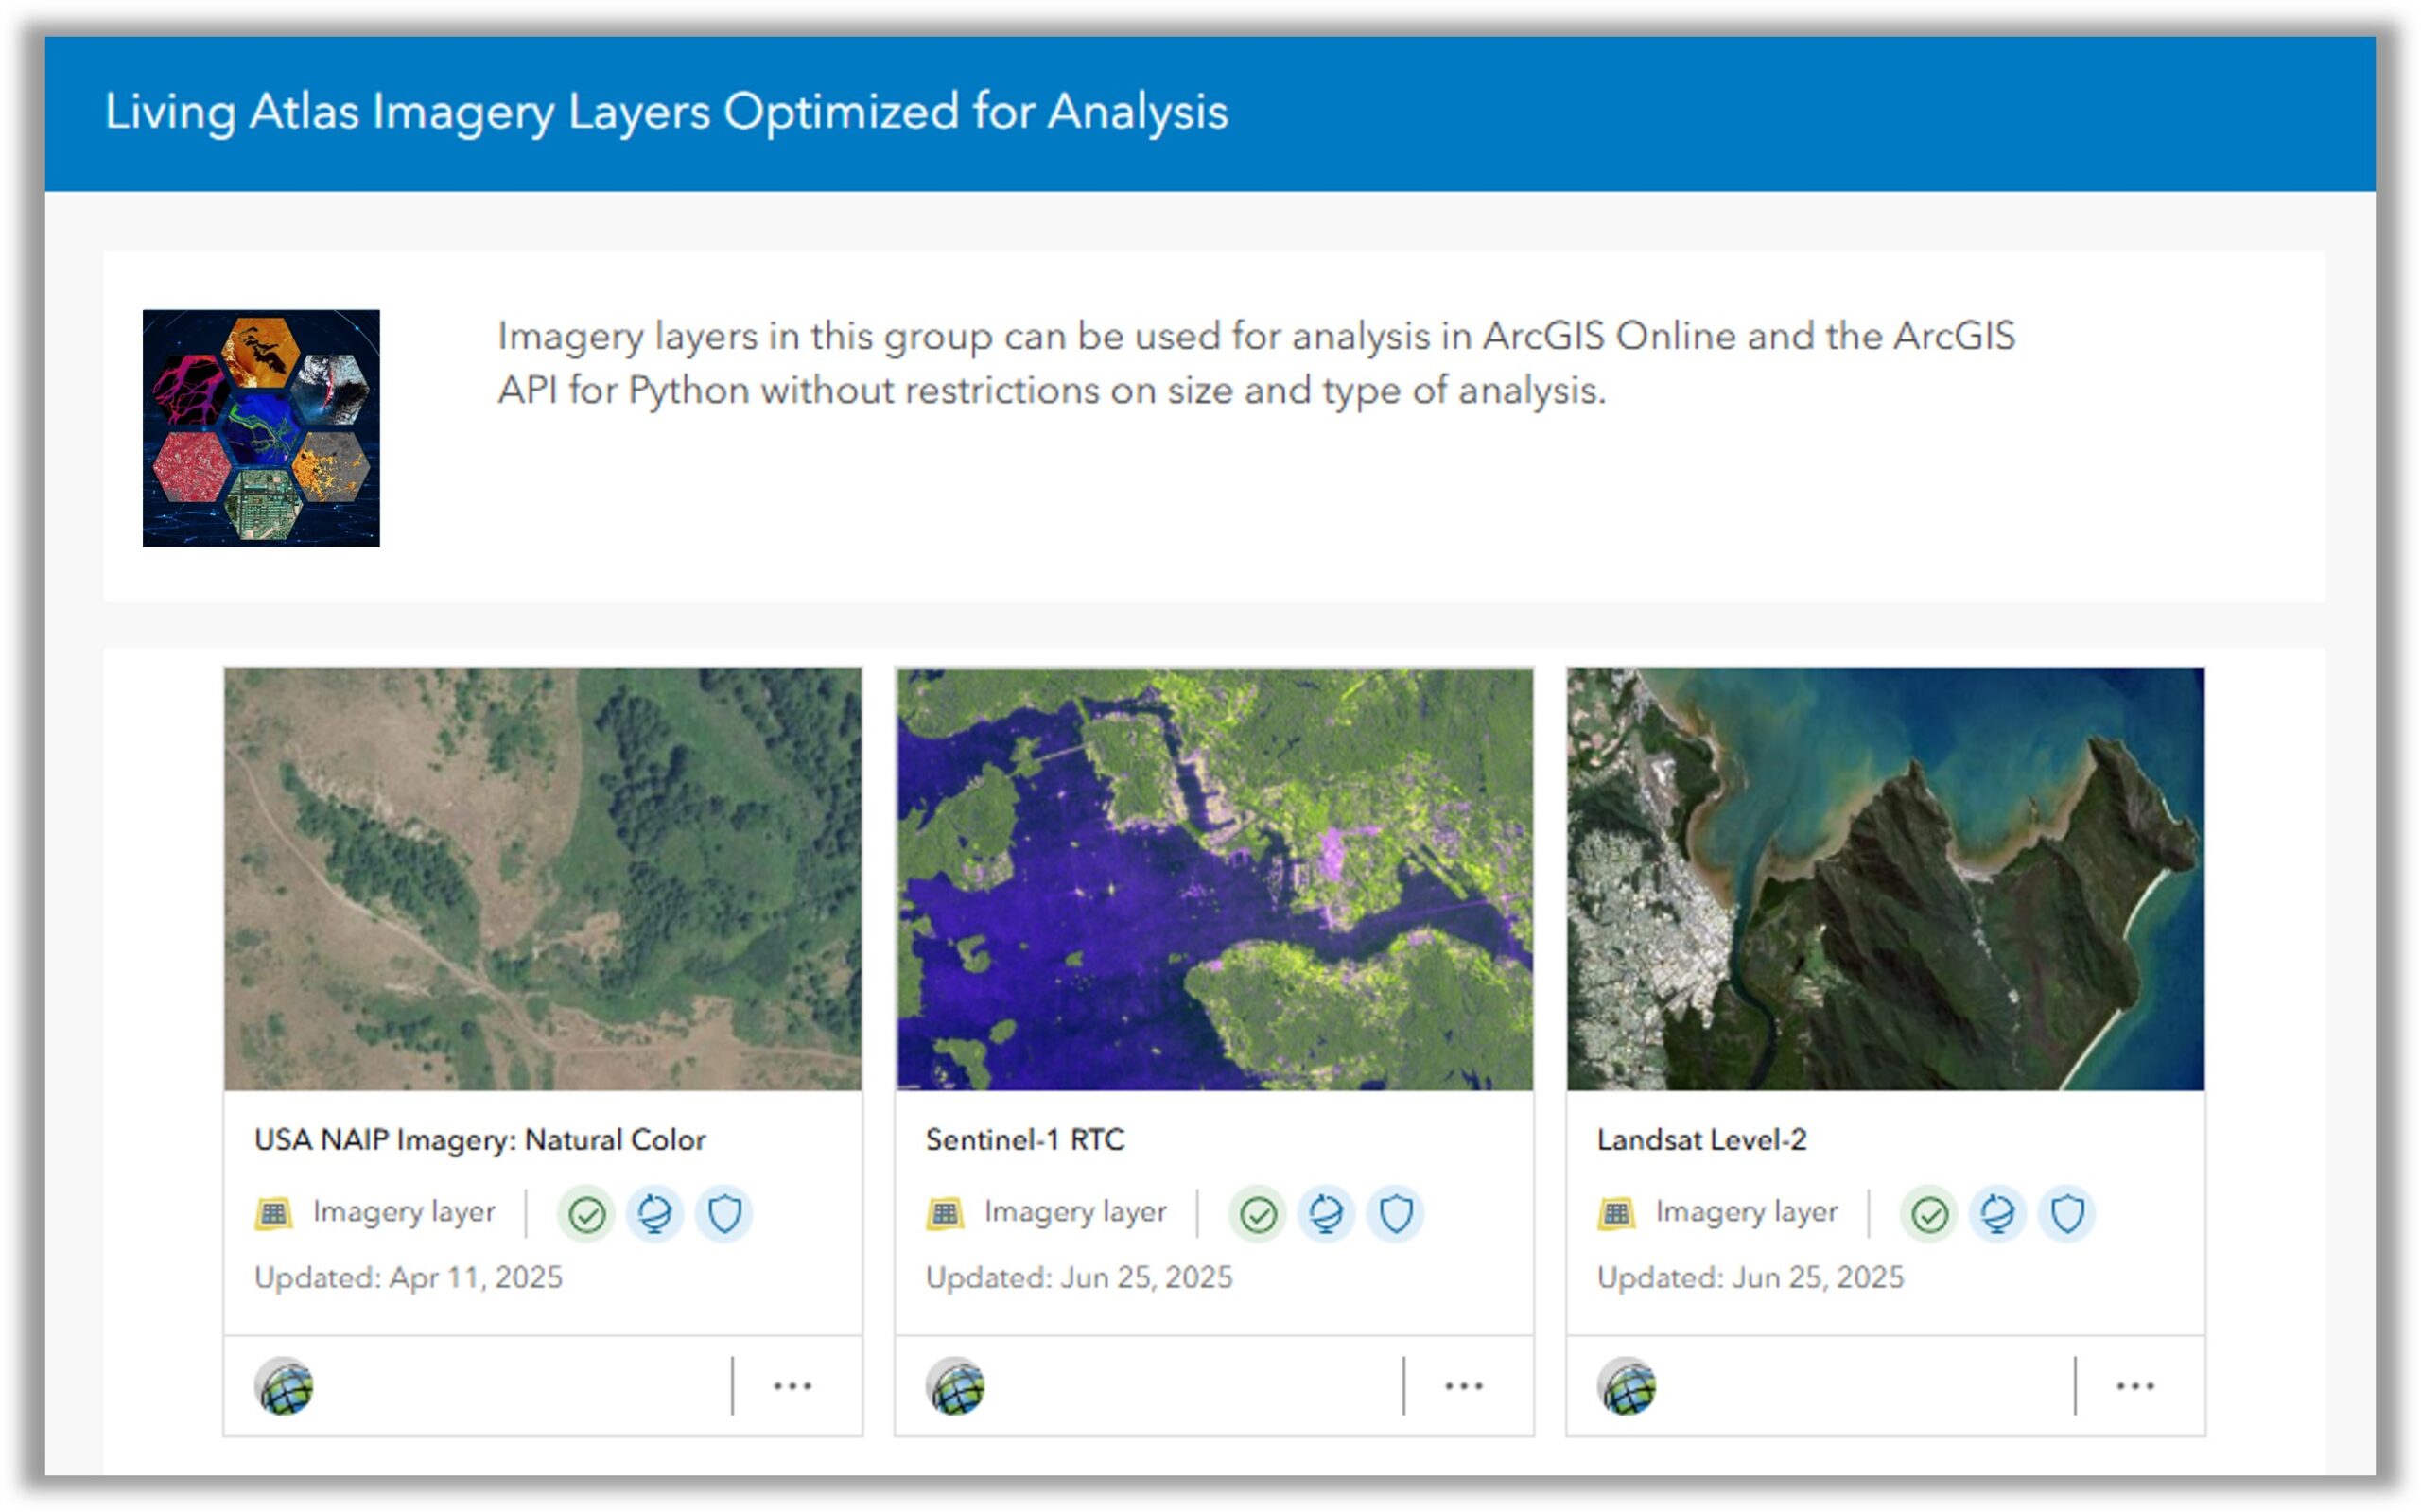
One way to discover and keep track of the available layers is through the Living Atlas Imagery Layers Optimized for Analysis group. As the list of available layers continues to grow, they will be added to this group.
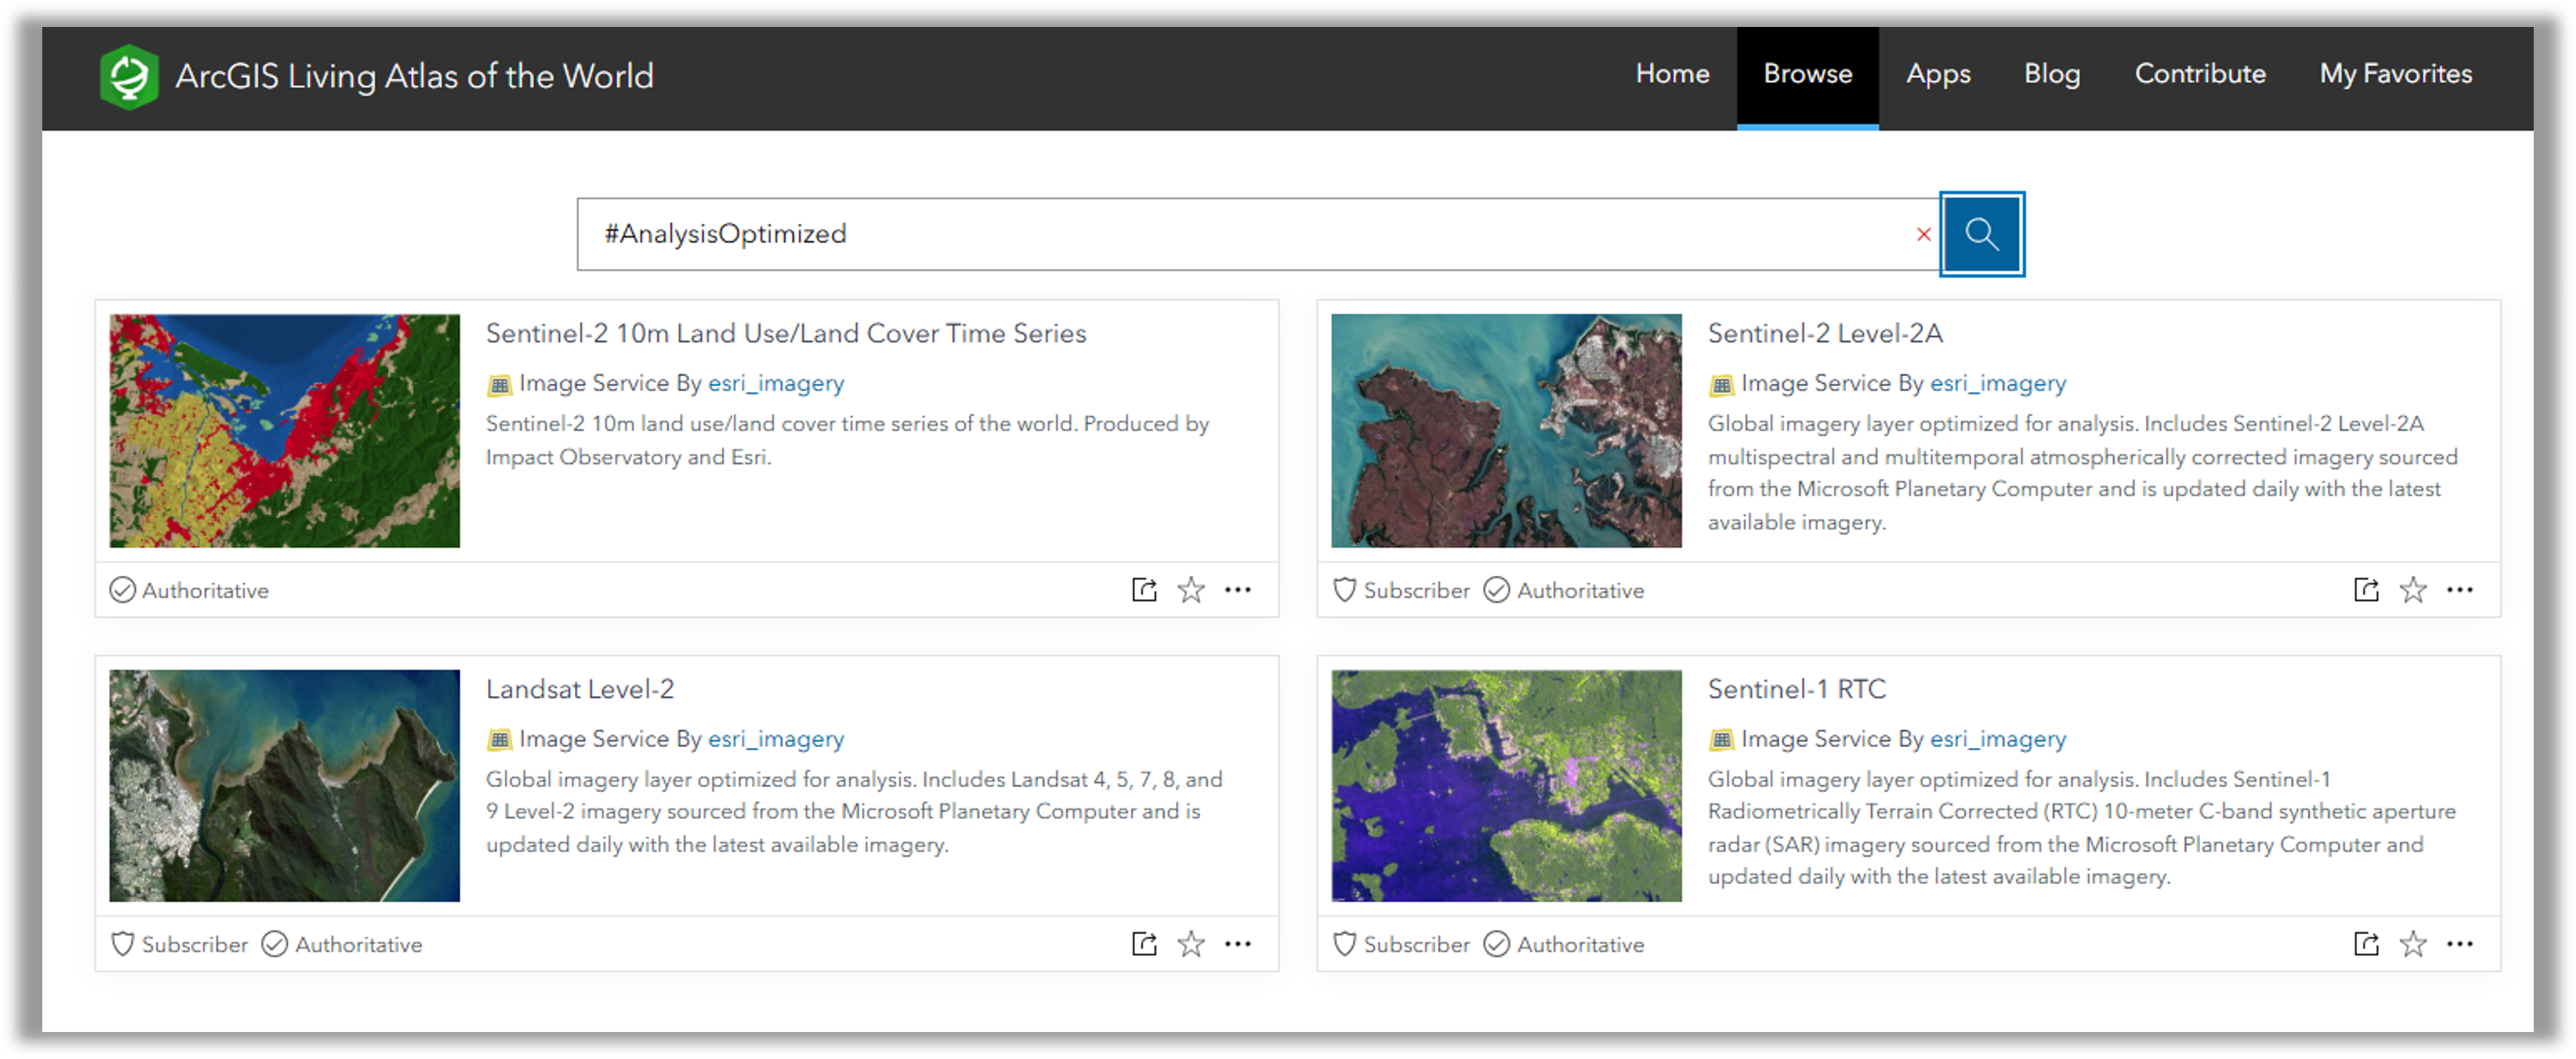
Another way to easily discover and access these layers is by using a tag search on the Living Atlas website. A search of #AnalysisOptimized will return the same list of layers optimized for analysis.
Enabling imagery layers optimized for analysis
To take advantage of imagery layers optimized for analysis, the capability will need to be enabled by your ArcGIS organization administrator.
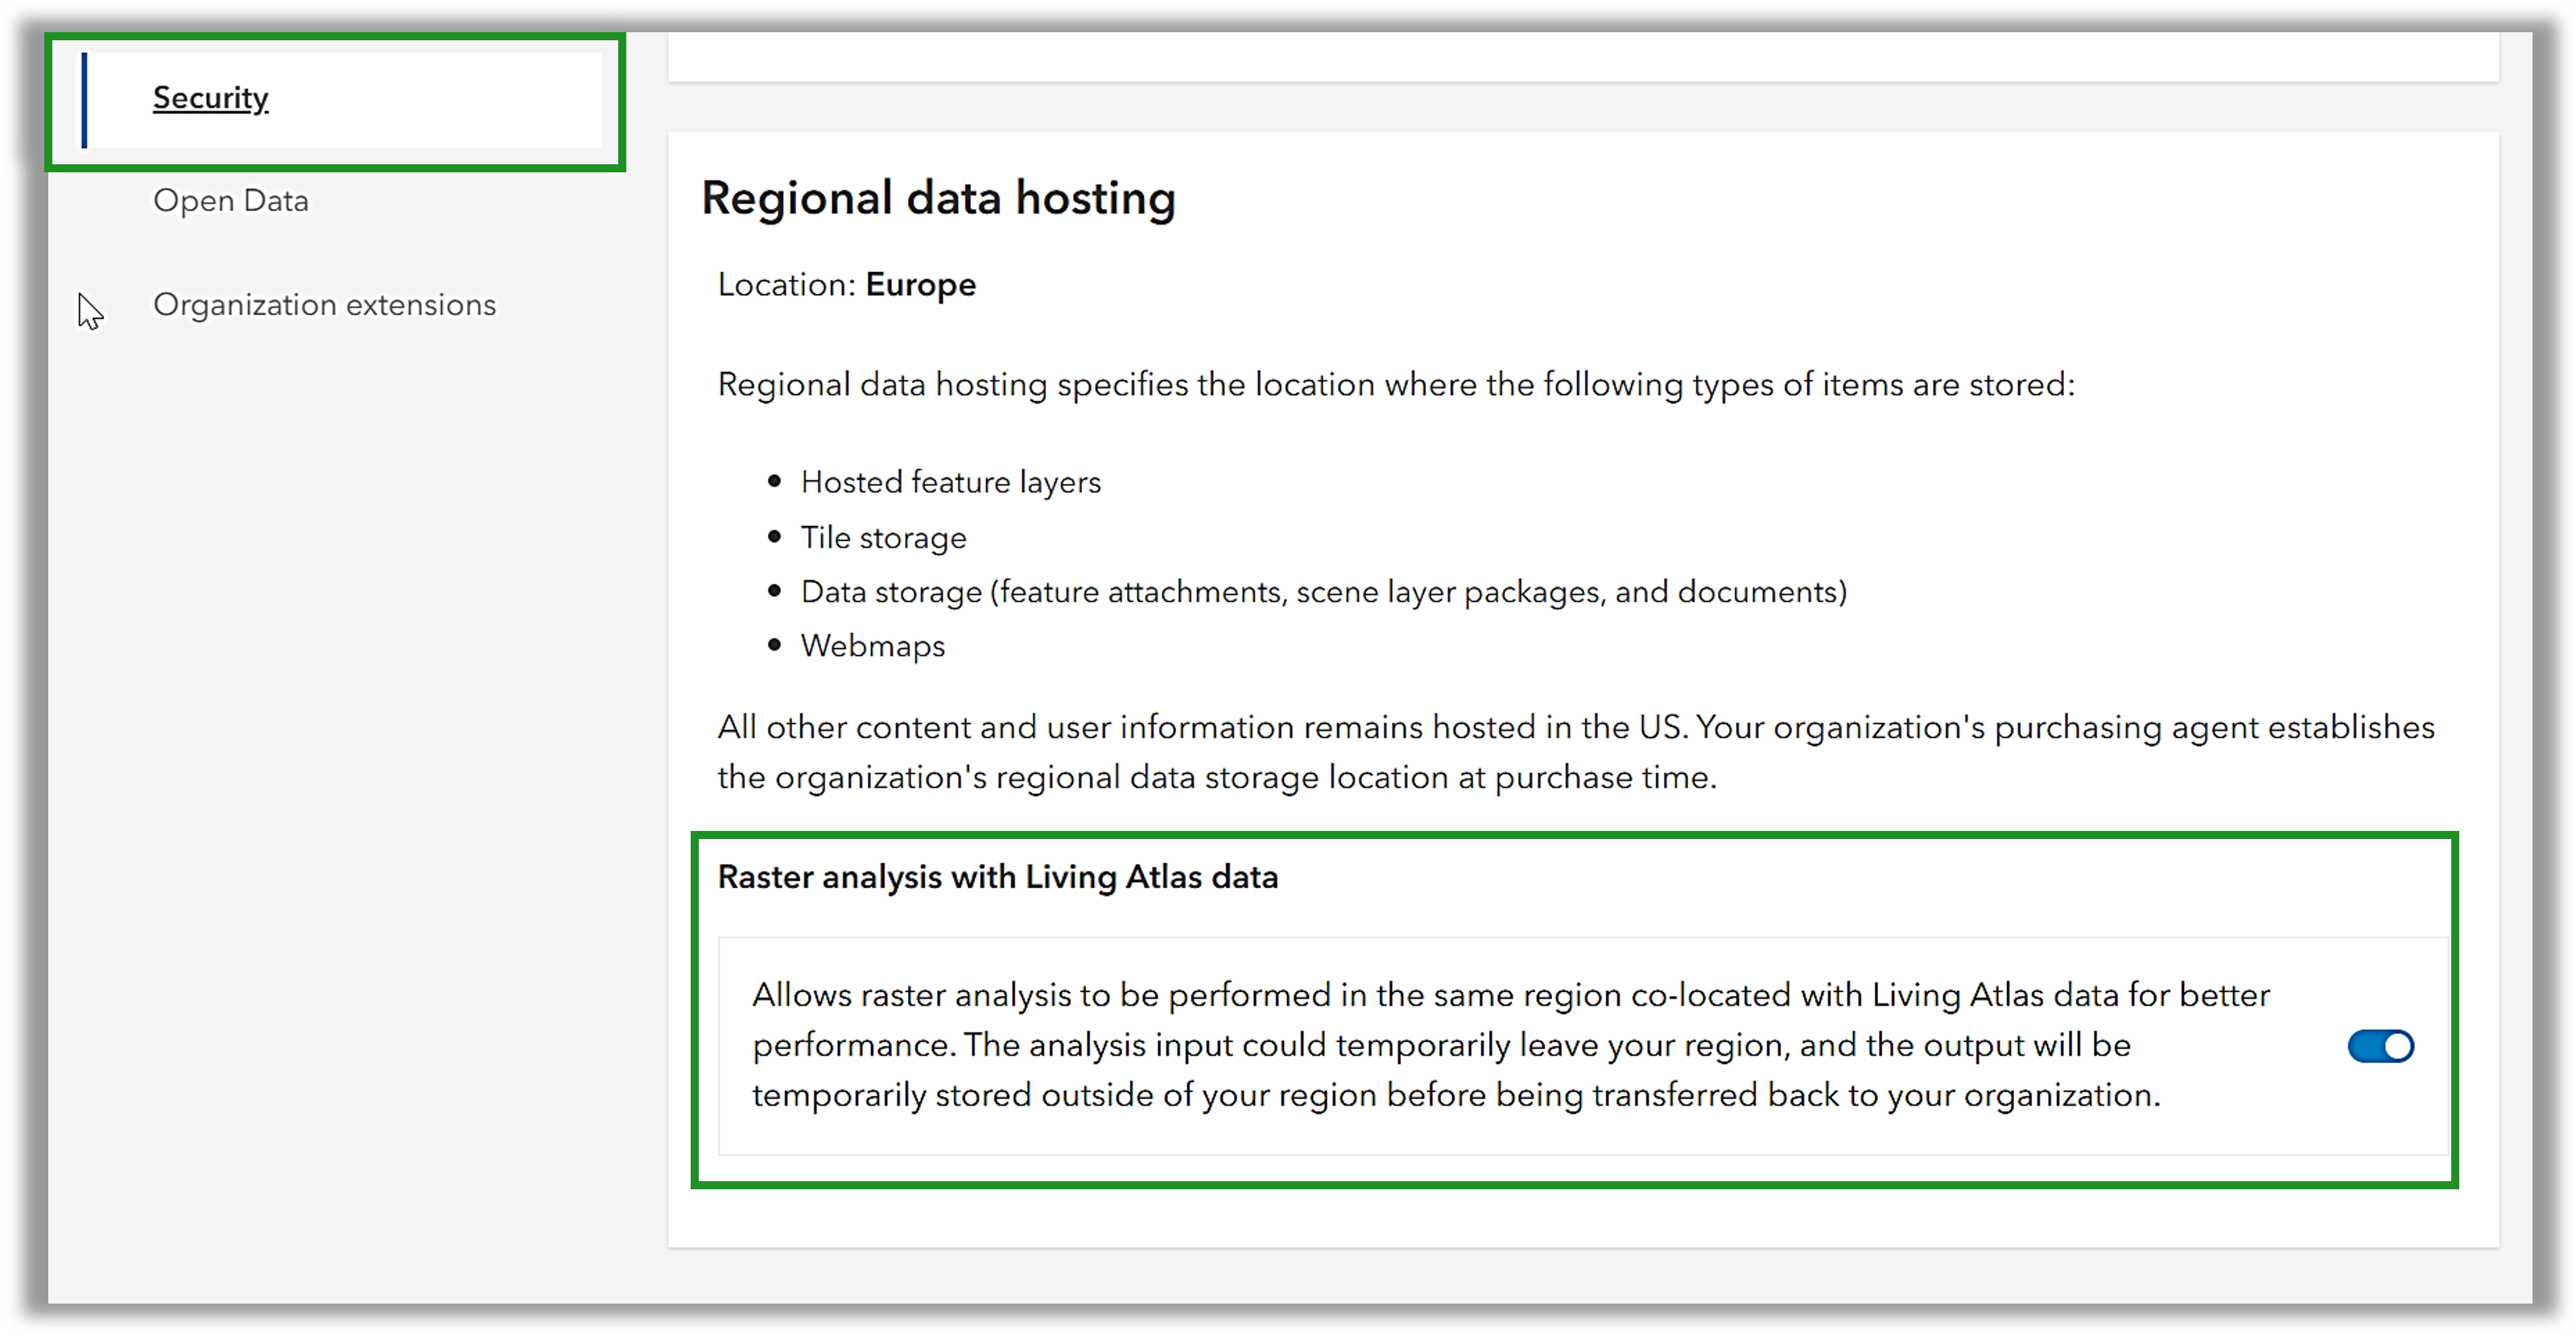
Regional data hosting is an important security consideration for some organizations. Enabling the Raster analysis with Living Atlas data option under the Regional data host settings allows raster analysis to be performed in the same cloud region co-located with Living Atlas data for better performance. While final analysis results are persisted in an organizations region, the analysis input, as well as intermediate results, can temporarily be stored outside the organizations region.
Organization administrators can enable this feature by going to Settings -> Security -> Regional data hosting within the ArcGIS organization administration panel. This information can be found in this help document.
Additional technical details regarding imagery layers optimized for analysis can also be found in Understand imagery layer settings for analysis.
Applications and tutorials
At a technical level, imagery layers optimized for analysis are about opening the door to larger scale and multisource analysis. Fundamentally, they are about unprecedented accessibility. Data, technology, information, and insights are infinitely more valuable in the hands of many than in the hands of few. At the core of what we are doing, is the enablement of a global user community.
Here are a some applications of the layers to help get started:
- Learn to map urban heat islands
- Mapping mangrove dynamics
- Creating a cloud-free imagery composite
- Monitoring algal bloom concentrations
Kudos to everyone making this possible!
Zhiguang Han
Jie Zhang
Shailesh Goel
James Sill
Abhijit Doshi
Ling Tang
Peng Gao
Nikhil Shampur
and others…

Article Discussion: