Predicting the weather is complicated. Knowing where it will rain, how long, and how hard requires vast amounts of observations, complex models, massive computing power, and skilled human interpretation. Trying to predict where that rain will result in flooding is even more challenging. Until now. NOAA’s National Water Center has just completed expanding access to near real-time flood inundation map forecasts for nearly 100% of the United States population – a first of its kind, high resolution flood prediction service. In addition to broad public access through the National Weather Service, this information is also available through a special series of web layers built specifically for ArcGIS Living Atlas.
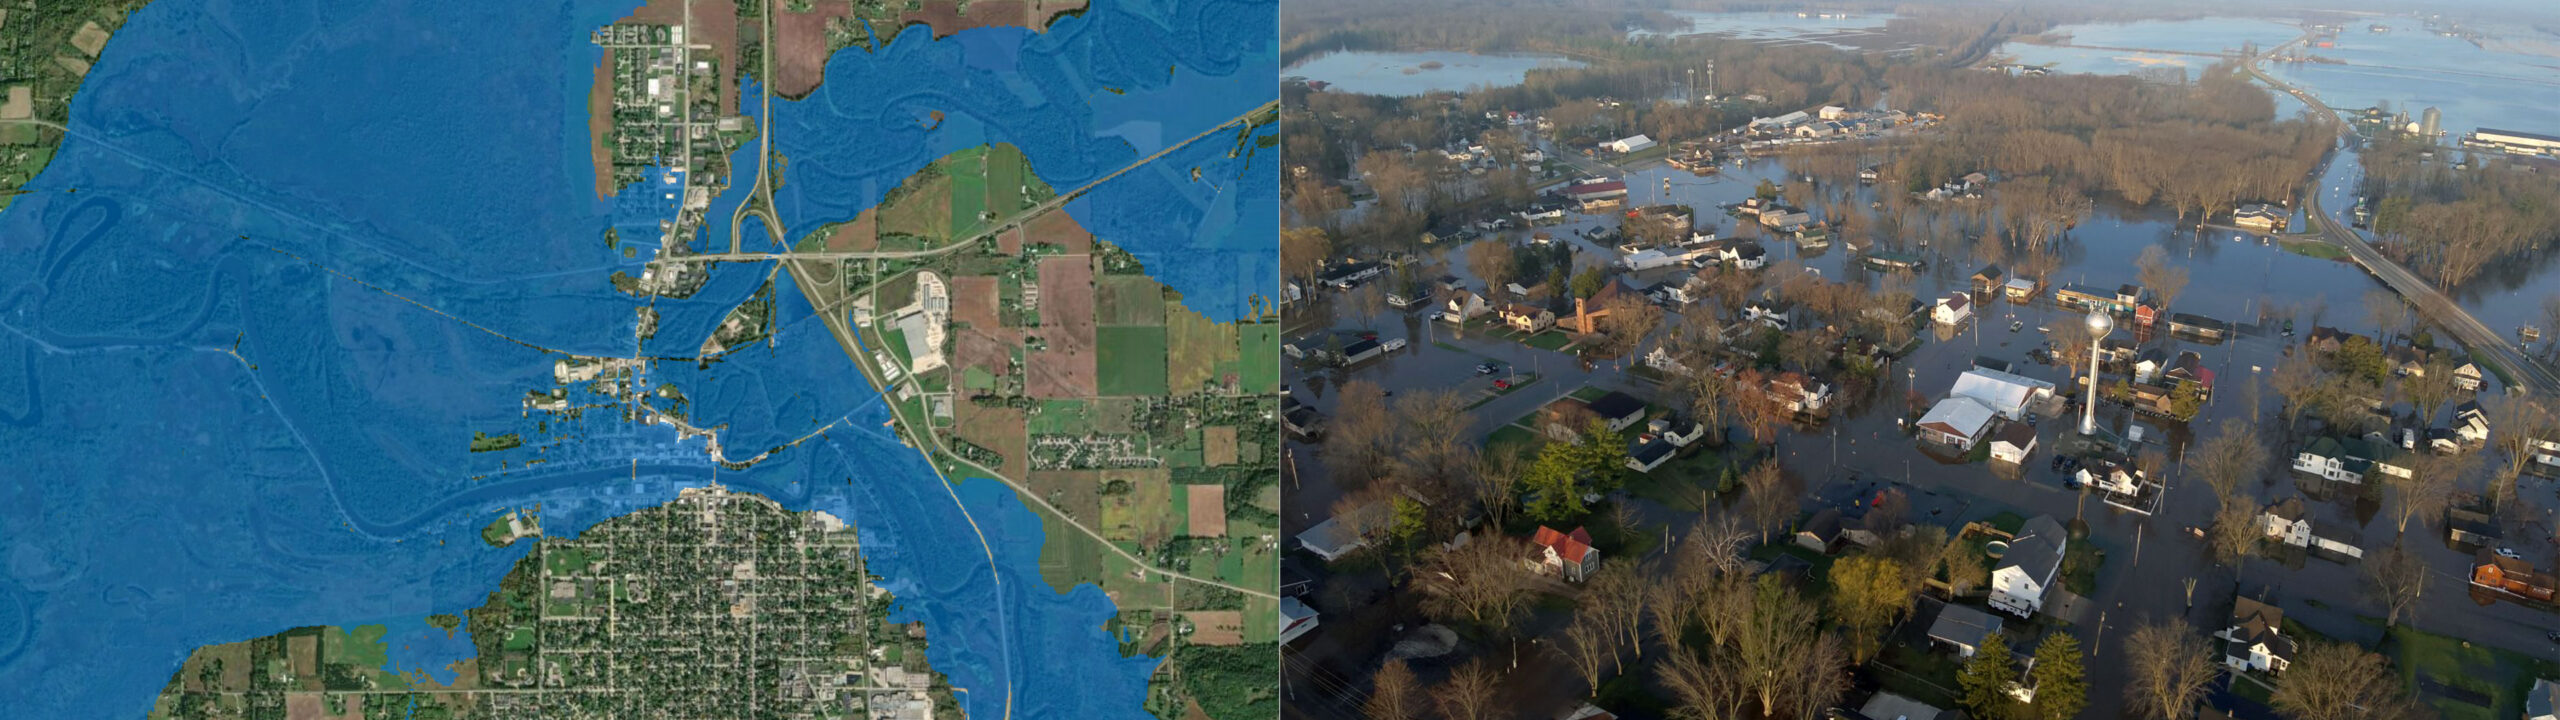
We want to get this incredibly important information in the hands of state and local officials and emergency management professionals as quickly as possible, and we know that partnering with the Living Atlas and GIS community is one of the most effective ways to do that.
TL;DR Flood Inundation Modeling
NOAA determines which areas will likely flood by combining forecasted streamflow with a high-resolution digital elevation model. First, the model analyzes the terrain to calculate how high every patch of ground sits relative to its nearest stream or riverbed. Next, the model estimates how much water will flow through those rivers during a storm, based on forecasts from the River Forecast Centers (RFCs) and the National Water Model (NWM), translating that volume into an expected water height. Finally, if the predicted river water rises higher than the surrounding ground’s relative elevation, the model marks that land as flooded.
Picking the Right Layer for the Job
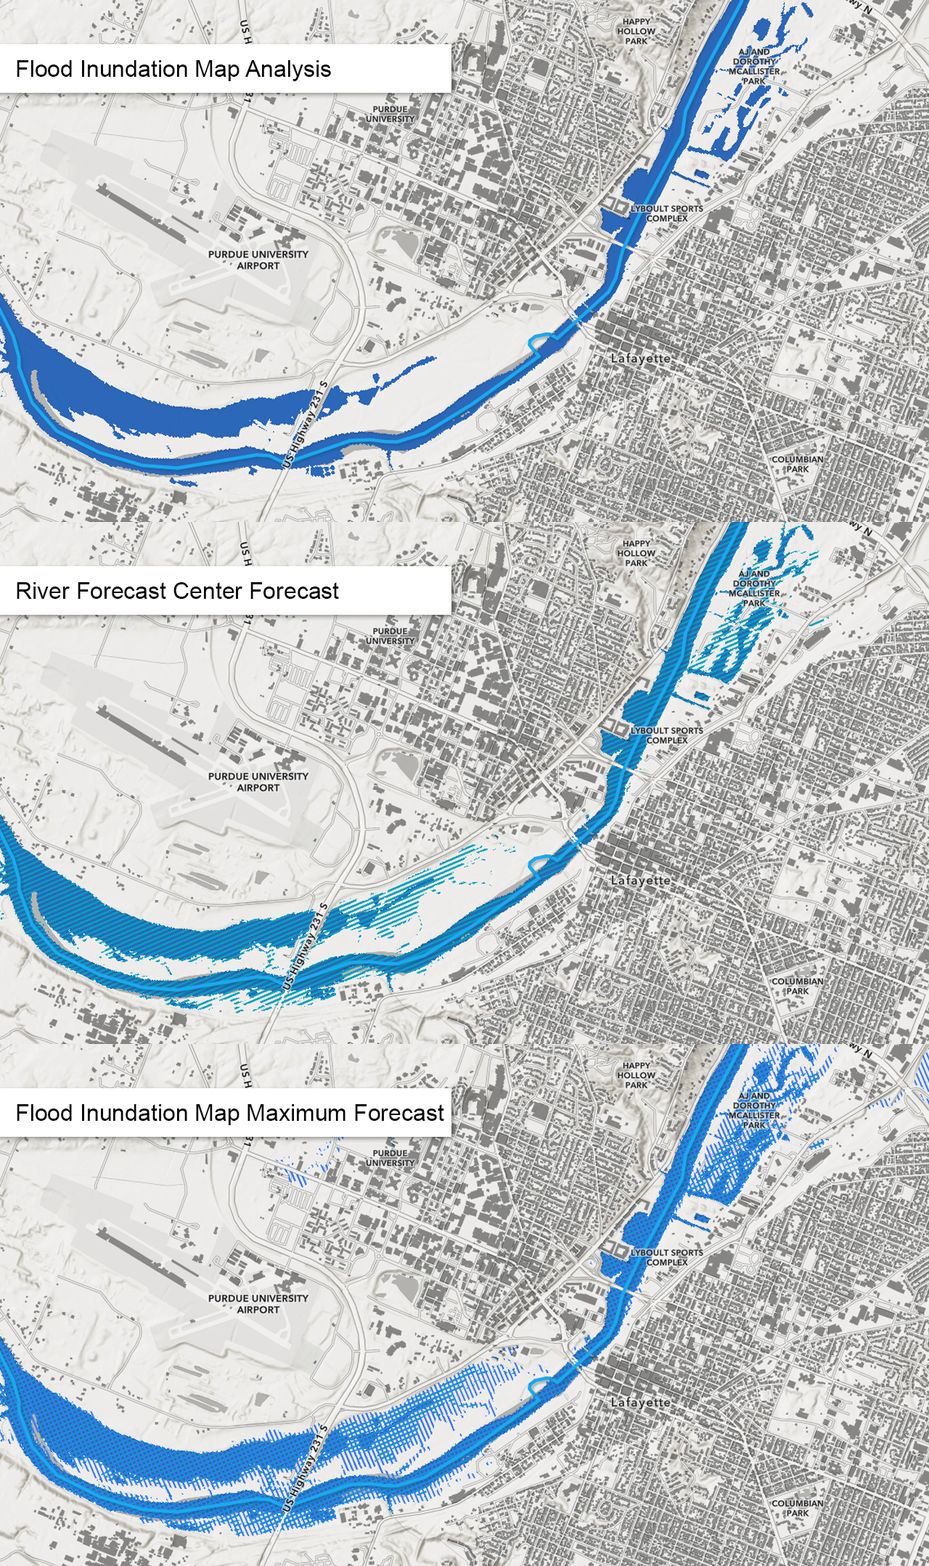
The Flood Inundation Map in Living Atlas comes in three flavors:
- NOAA Flood Inundation Map Analysis: the current flood extent. Updating every hour, this layer displays which areas are likely flooded, along with current streamflow conditions.
- NOAA River Forecast Center 5-Day Flood Forecast: Many flood impacted areas in the United States are supported by RFCs, where expert hydrologists update the FIM with more recent river and stream gauge information. This layer updates every hour and should be used as the primary forecast map, where available.
- NOAA Flood Inundation Map 5-Day Maximum Forecast: updating every six hours, this layer provides the maximum modeled flood information for the entire United States and should be used for areas not covered by an RFC forecast.
Each of the layers in Living Atlas is styled to work together as overlapping layers, which helps to identify which 5-day forecast should be used.
Flood Inundation Maps + Living Atlas = More Informed Decisions
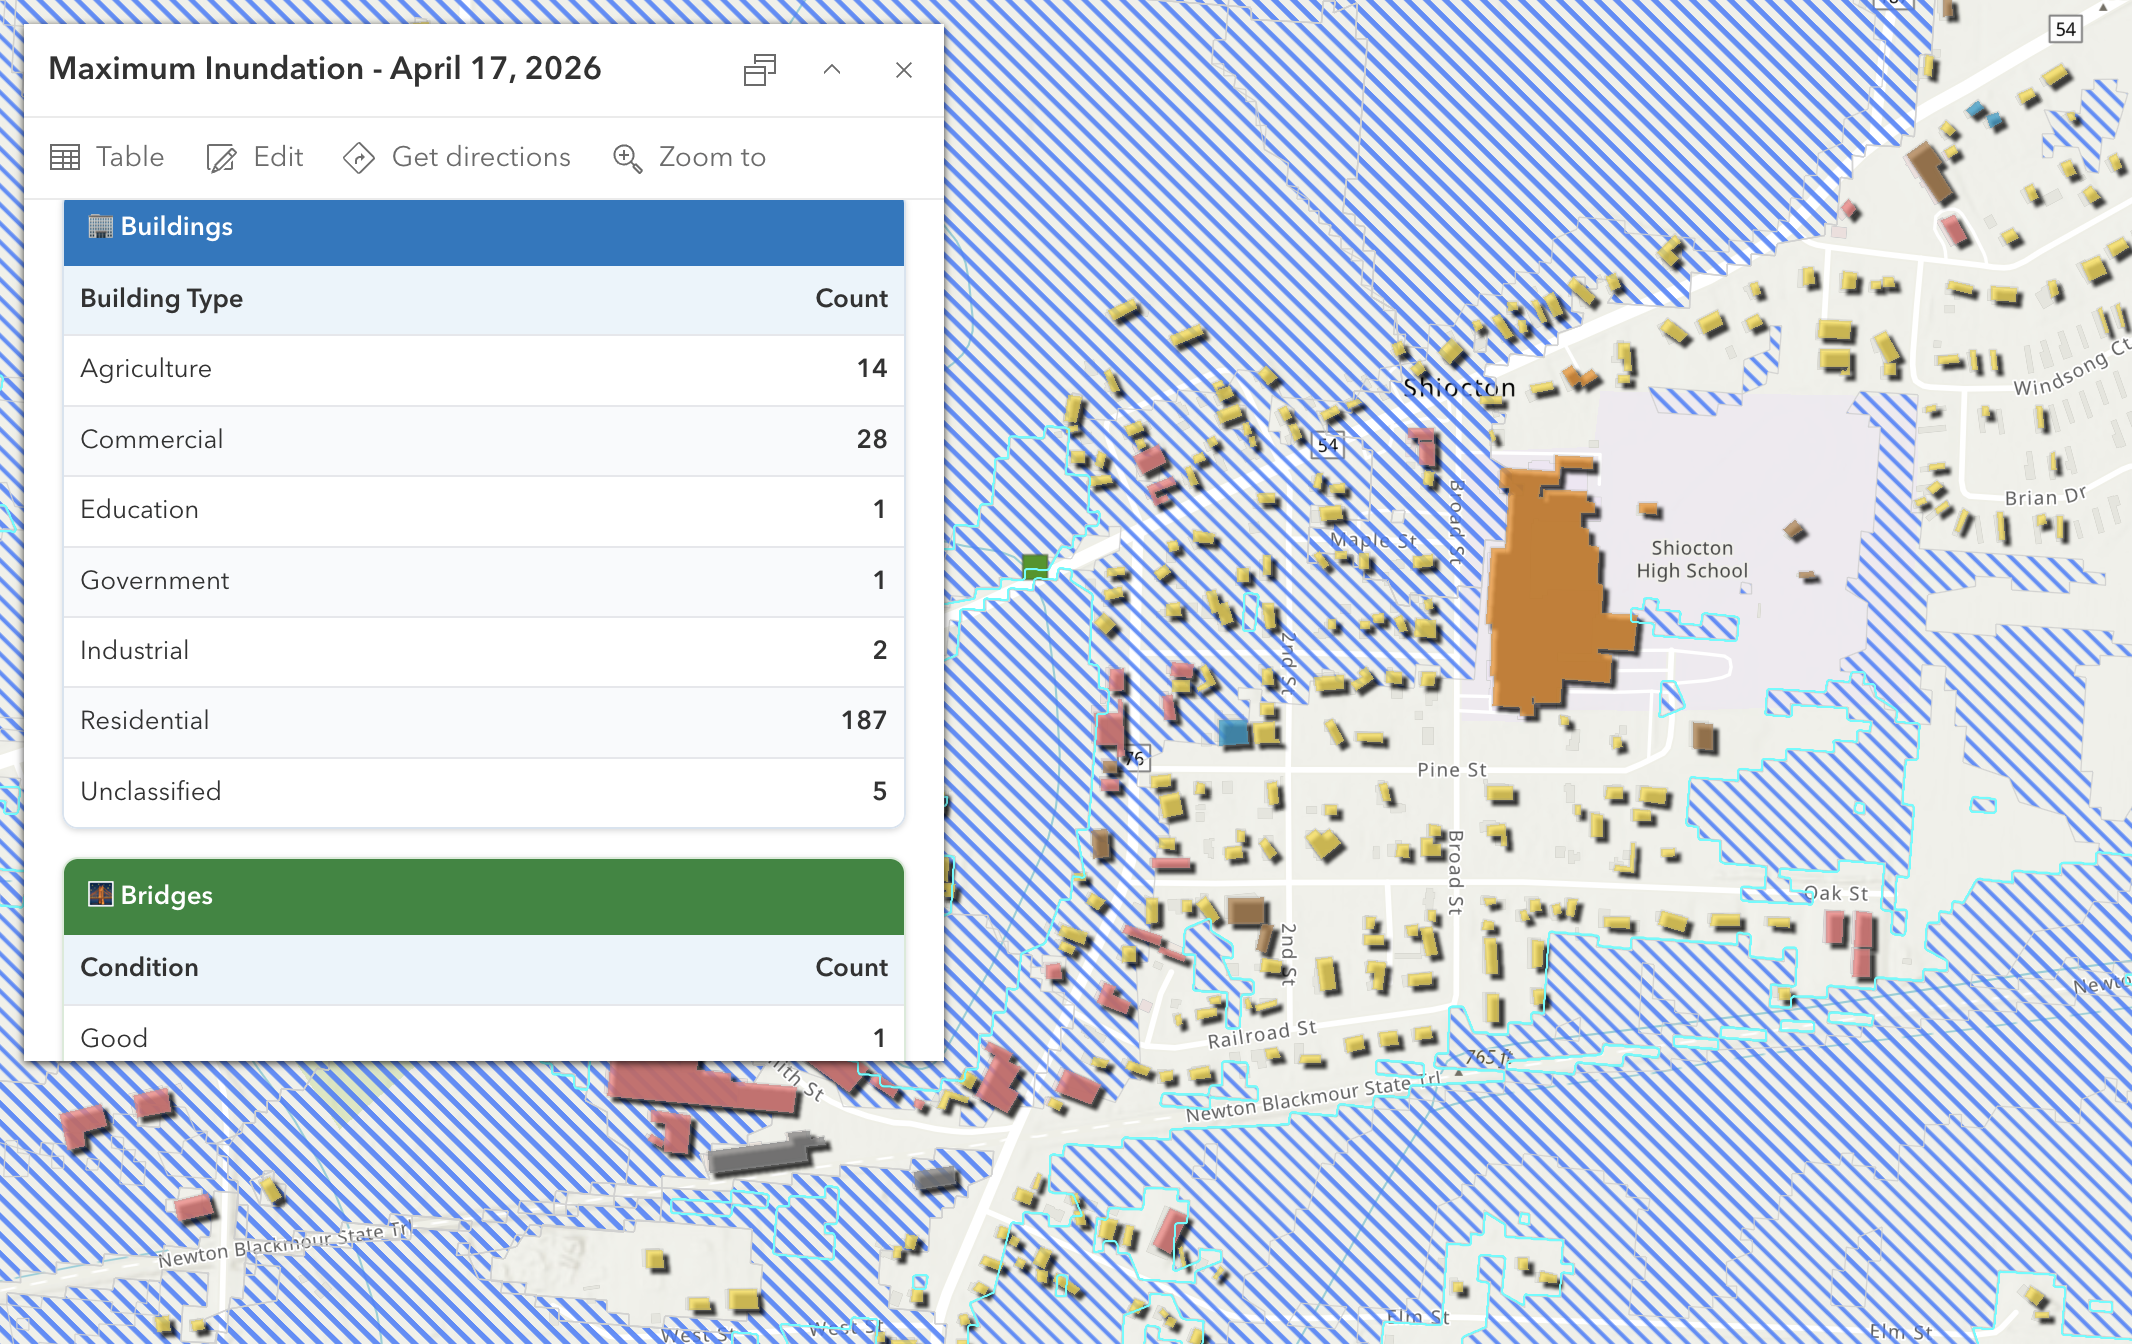
Not only does Living Atlas make accessing these new current and forecasted flood maps easier, it also simplifies flood impact analysis with the rich collection of trusted data on populations, infrastructure, and the environment. For example, in this map, a simple Arcade expression summarizes all buildings and bridges within the contiguous flood polygon, using FEMA’s USA Structures and the Dept. of Transportation’s National Bridge Inventory. Similar maps can show at-risk populations, levees, or other exposed infrastructure.
Esri will be creating a series of maps to help inform flood decision making. Have a map idea? Let us know in the comments.


Article Discussion: