Understanding the United States’ highway network requires more than knowing where the roads are. Transportation professionals need information about how roads are used, their physical characteristics, and how they are performing.
The latest Highway Performance Monitoring System (HPMS) data from the Federal Highway Administration (FHWA) is now available in ArcGIS Living Atlas. This new HPMS layer is managed by the FHWA’s Office of Highway Policy Information, and provides a national view of the public road network with the latest available HPMS attributes, ready to use in ArcGIS maps, apps, and analysis.
HPMS is FHWA’s national highway information system for collecting data about the extent, condition, performance, use, and operating characteristics of the nation’s public roads. The program provides an important foundation for understanding the highway network and supports transportation planning, analysis, and decision-making.
The HPMS layer in Living Atlas brings this information together into a single national resource, making it easier to explore highway characteristics across the United States.
Explore the nation’s highway network
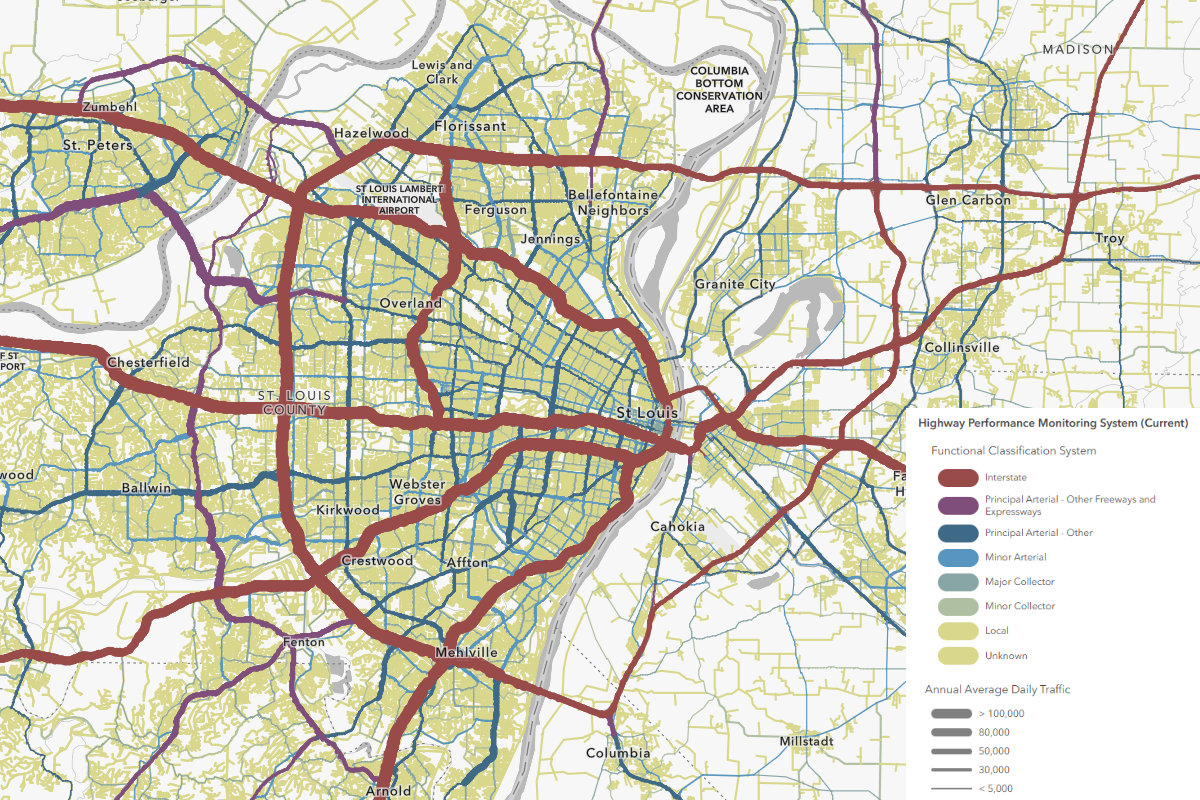
The Highway Performance Monitoring System (Current) layer provides a detailed view of the U.S. highway network and its characteristics. The layer combines HPMS information with national roadway geometry, allowing you to visualize and query highway segments as well as other public road segments across the country.
Because the data is available as a single national layer, you can move seamlessly from a nationwide view to individual roadway segments. Filter the layer by attributes, zoom into an area of interest, or use the data as a foundation for more detailed transportation analysis.
This makes HPMS useful for questions such as:
-
Where are the highest-volume roads?
-
How are traffic volumes distributed across the highway network?
-
What are the characteristics of roads in a particular state or region?
-
How many lanes are present on different roadway segments?
-
How do roadway conditions vary geographically?
-
Where are particular functional classes of roads located?
-
How do roadway characteristics relate to other demographic, economic, or environmental factors?
Integrating HPMS Data into a Unified Roadway Network
One of the key strengths of this HPMS layer is the ability to integrate roadway information into a single, spatially enabled dataset. States submit HPMS data as separate, linear-referenced events, and different attributes may apply to different portions of the same roadway.
For example, Annual Average Daily Traffic (AADT) may be reported for mile 1 to mile 5, while pavement condition data covers mile 2 to mile 4. In their original form, these attributes are stored as separate linear-referenced records. The Full Spatial Join process combines HPMS attributes with the roadway network using SQL and dynamic segmentation, creating roadway segments that reflect changes in the underlying attributes.
As attribute values change, the process creates new segments, ensuring that each resulting roadway section has a consistent set of characteristics. The result is a fully attributed spatial representation of the highway network, where roadway geometry and HPMS attributes can be analyzed together. This simplifies GIS workflows by allowing users to query multiple roadway characteristics directly, without having to reconstruct relationships across separate linear-referenced datasets.
Visualize traffic and travel
Traffic volume is one of the most useful ways to understand how the highway network is being used.
HPMS includes Annual Average Daily Traffic (AADT), providing information about the average daily traffic volume associated with roadway segments. Mapping AADT allows you to quickly see differences in traffic activity across the national network.
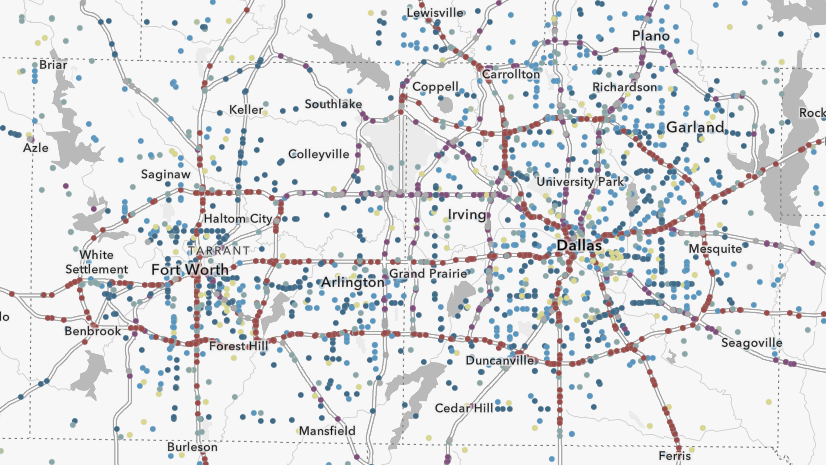
You can symbolize the highway network by traffic volume to create maps ranging from a national overview to detailed views of individual metropolitan areas.
By multiplying AADT by roadway segment length, you can estimate daily vehicle miles traveled (DVMT). Multiplying that estimate by the number of days in the reporting year provides an estimate of annual vehicle miles traveled (AVMT). Combining traffic and roadway characteristics can help provide additional context for understanding travel patterns.
For example, you can use ArcGIS to compare traffic volumes with population, land use, employment, freight activity, or other transportation datasets available in ArcGIS Living Atlas.

Examine roadway condition
HPMS isn’t limited to information about traffic. The dataset also includes attributes describing roadway condition.
The International Roughness Index (IRI) is one example. IRI measures roadway roughness and can help characterize pavement condition and support transportation analysis.
Mapping IRI alongside traffic volume provides another way to explore the nation’s highway network. You can identify areas with different combinations of traffic activity and roadway condition and then combine those results with other datasets for additional analysis.
Because HPMS includes numerous roadway attributes, users can create maps focused on the specific measures most relevant to their projects.

Analyze roadway characteristics
HPMS contains much more than a single traffic or condition measure. Its attributes allow you to examine many characteristics of the highway network.
Depending on your area of interest, you can use the layer to investigate:
-
Functional classification
-
Traffic volume
-
Vehicle miles traveled
-
Number of through lanes
-
Posted speed
-
Roadway characteristics
-
Pavement and roadway conditions
-
Other HPMS inventory and performance indicators
These attributes can be used individually or together to create thematic maps and perform spatial analysis.
For example, you could select major roadway segments with high traffic volumes, examine their physical characteristics, and compare them with demographic or land-use patterns. You could also use HPMS as the transportation-network foundation for a broader regional or national analysis.
HPMS use cases in transportation analysis
HPMS is a foundational transportation data resource used by organizations across federal, state, regional, local, academic, and private-sector settings. Its standardized roadway, traffic, and condition information supports a wide range of planning, management, research, and business applications.
Federal agencies: HPMS supports FHWA and other federal agencies in highway performance management, safety analysis, air emissions modeling, freight planning, and capacity analysis. It also contributes to the biennial Conditions and Performance Report to Congress.
State departments of transportation: As both major data contributors and users, state DOTs rely on HPMS as a common baseline for tracking transportation performance measures, evaluating roadway conditions, managing assets, and meeting federal reporting requirements.
Regional and local agencies: Metropolitan planning organizations and local governments can use HPMS traffic volumes and roadway capacity information to support travel-demand analysis, identify potential congestion bottlenecks, and guide infrastructure investment and planning decisions.
Researchers and academic institutions: HPMS provides a foundation for studying relationships between roadway characteristics and outcomes such as traffic crashes and pavement deterioration. Traffic data can also support research beyond traditional transportation applications, including investigations of links between traffic volumes and wildlife-vehicle collisions.
Private sector: Businesses can apply HPMS data to location-based and risk analyses. Traffic volumes can inform retail and commercial real estate site selection, while roadway characteristics and conditions provide valuable context for freight logistics.
Thank you, FHWA
The geographic community is fortunate to have this dataset provided by the FHWA’s Office of Highway Policy Information. Thank you for your hard work and for collaborating with the Esri Living Atlas team on publishing this layer to ArcGIS Online and nominating it for inclusion in Living Atlas.
How will you use this layer?
Add the HPMS layer to a map and explore the attributes of the nation’s public road network. Use filters and smart mapping to visualize traffic volumes, roadway characteristics, and pavement condition, or combine HPMS with other ArcGIS Living Atlas content to investigate transportation patterns at local, regional, and national scales.
Whether you’re studying a single highway corridor or analyzing the national transportation network, HPMS provides a geographic foundation for understanding roadway use, characteristics, and condition.
How could your organization use HPMS content in Living Atlas? Are you exploring roadway condition to help inform pavement maintenance priorities, or analyzing traffic patterns to support future transportation planning?
Share your maps, apps, and use cases in the Esri Community’s ArcGIS Living Atlas space, or nominate your own content for inclusion in Living Atlas.
For questions, feedback, or to share your work, contact Steven Aviles (saviles@esri.com) or FHWA, Office of Highway Policy Information (PolicyInfoFeedback@dot.gov)




Article Discussion: