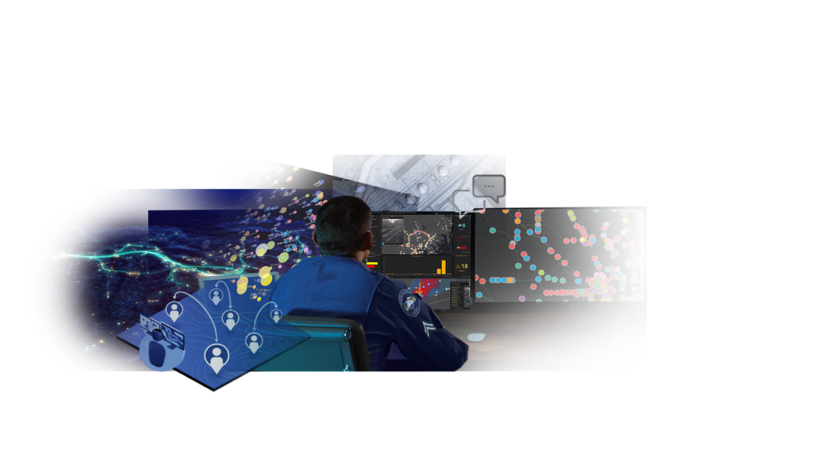
A picture is worth a thousand words. A quote you commonly see applied to photography, paintings, or other art. Yet, a quote you may not relate to tactical situational awareness workflows where object locations and activities are continuously updating. Where observing the current operating picture is critical for mission success. Through the power of ArcGIS Mission, this situational awareness picture can come to life by leveraging an ArcGIS Dashboard, an interactive, single-view of the mission that can be created automatically to aid in mission-critical decision making.
Mission observers in your organization, such as a supervisor, an executive, or even a commander, can leverage a mission dashboard to provide insightful views of geographic information and help monitor events or activities occurring in your mission. Multiple information elements from your mission such as tracks, chats, tasks, and reports come together on a single screen to provide a comprehensive view of your mission. This engaging view of key mission data provides insights for decision making to achieve mission success.
Create and Configure Your Mission Dashboard
Once your mission is created, the mission owner can easily create a dashboard for the mission by providing a title, tags, and an optional description. With a single click, like the push of a button on a camera, your common operating picture has been snapped for your audience to view.

The configuration of your dynamic dashboard is automated and users can see different elements come to life. Centered around your mission map, these elements are based on key mission activity layers and are available for all mission members to utilize. As new information comes into the mission, the dashboard elements update in real-time .

By default, the following elements are configured when a dashboard is created:
- Active Mission Members — The number of active ArcGIS Mission Manager and ArcGIS Mission Responder users within the mission.
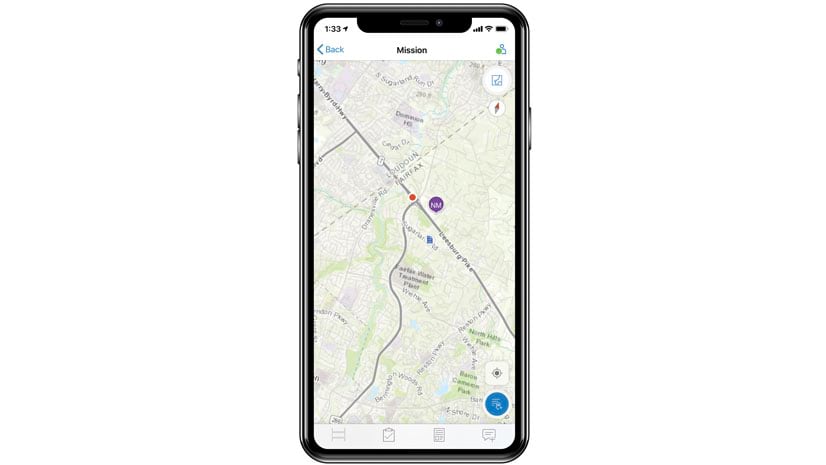
- Mission Responder – Last Known Locations — The last known location of any Responder user, as well as their current battery percentage.
- Mission Map with Tracks — The Track history from any Responder user on the mission map.
- Mission Reports — A list of Tactical Summary Reports that have been sent throughout the lifetime of the mission.
- Mission Tasks — A list of Tasks that have been sent throughout the lifetime of the mission.
- Total Mission Reports — The number of Tactical Summary Reports within the mission.
- Total Mission Tasks — The number of Tasks within the mission.
- Mission Chat Log — A list of Chats that have been sent throughout the lifetime of the mission.
Extending Your Mission Dashboard
Think of the default dashboard as a quick way to spin up a comprehensive view of your mission, but not the comprehensive view. Why is that? This view can be edited and adjusted to your organization’s needs at any time. Do you have a new element you want to configure to the dashboard based on a new mission layer you added such as significant activity? Do you need to add an indicator for when a threshold is met on a mission layer such as low battery percentage for your mobile operators? All of this and more can easily be done at any time because the mission dashboard is a Dashboard item that lives in your organization’s portal content.

So the next time you use ArcGIS Mission, ensure you leverage the mission dashboard to provide your observers with a current operating picture worth a thousand words to achieve mission success.
Get in touch with an Esri representative at go.esri.com/mission or visit the YouTube Playlist to learn more about Mission and how you can add it to your organization’s ArcGIS Enterprise deployment.

Article Discussion: