ArcGIS Online has introduced a significant enhancement for administrators and advanced users: the new Organization Status Dashboard (Beta). This interactive dashboard is designed to provide more granular and actionable insights about your organization’s activity, usage, and credit consumption – making it intuitive and efficient to manage and optimize resources.
Accessing your New Beta Dashboard
- To view the beta dashboard, your organization should have beta apps and capabilities unblocked. You can access this setting at Organization Settings > Security > Blocked Esri apps and capabilities
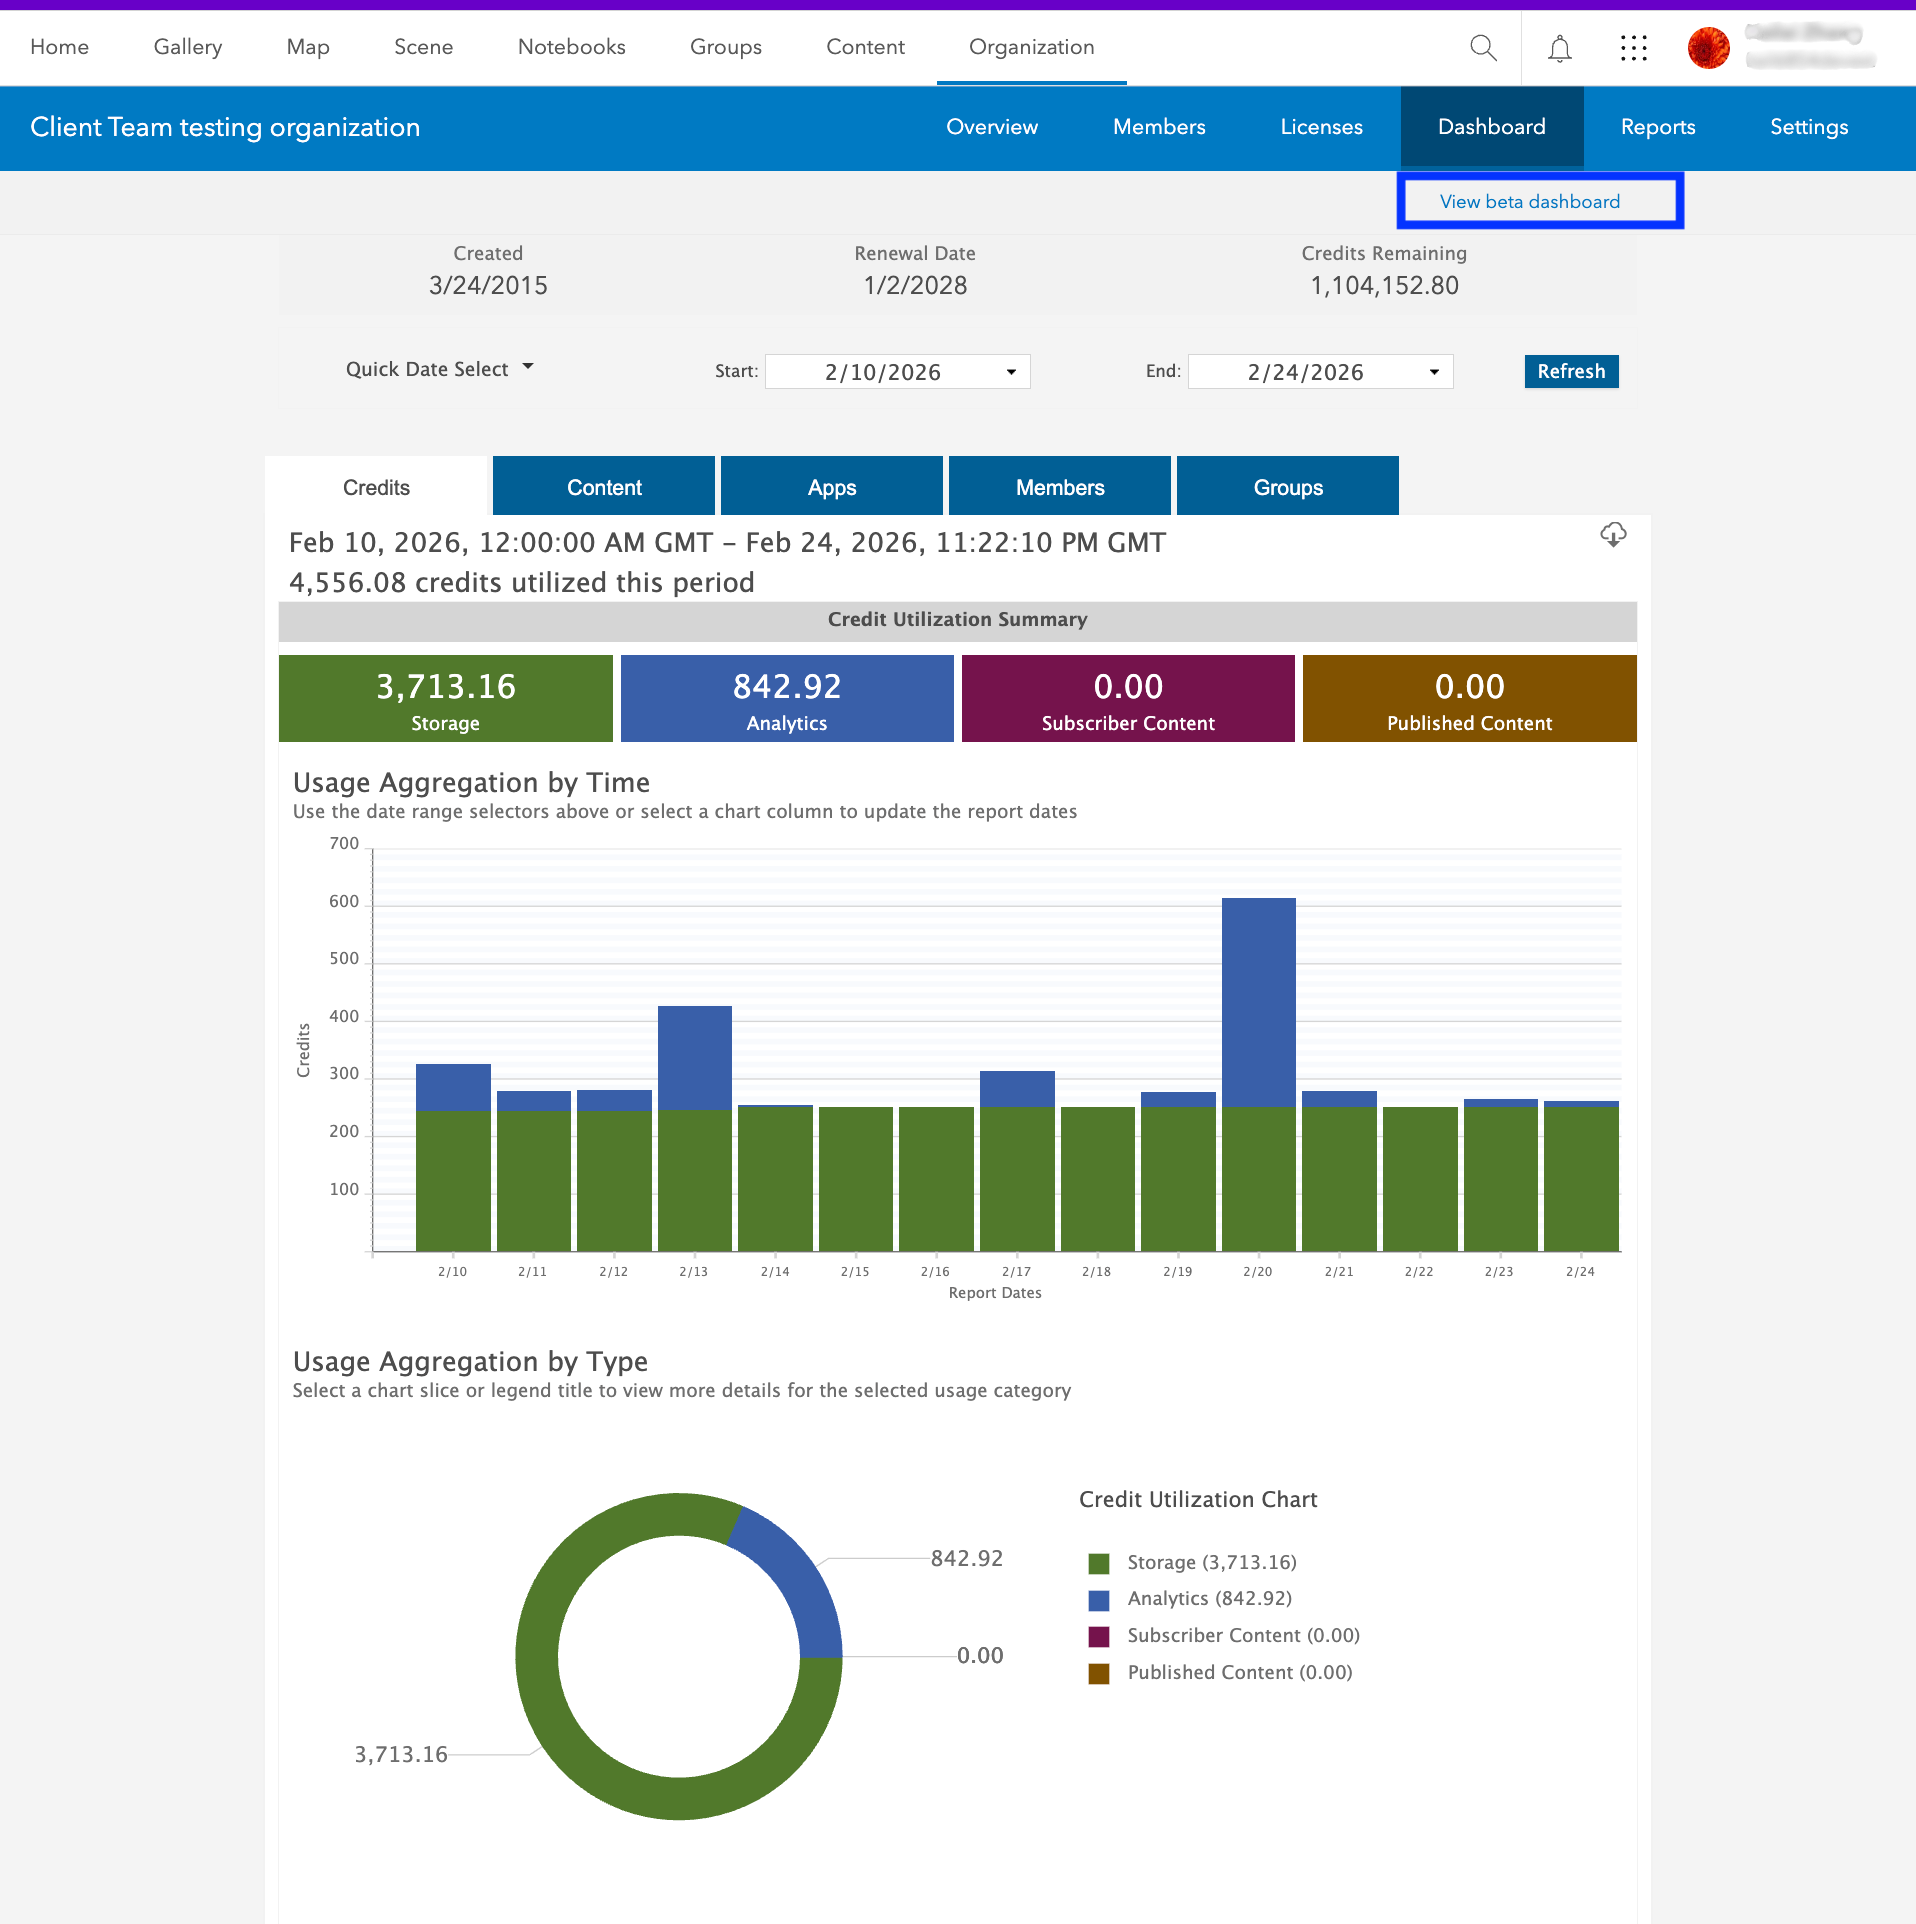
- Navigate to the Organization page.
- In Dashboard tab > Click on “View beta dashboard”
Note: While the new dashboard is in Beta, you can switch back to the legacy dashboard anytime, allowing you to transition at your own pace.
Choosing the time period for your data views
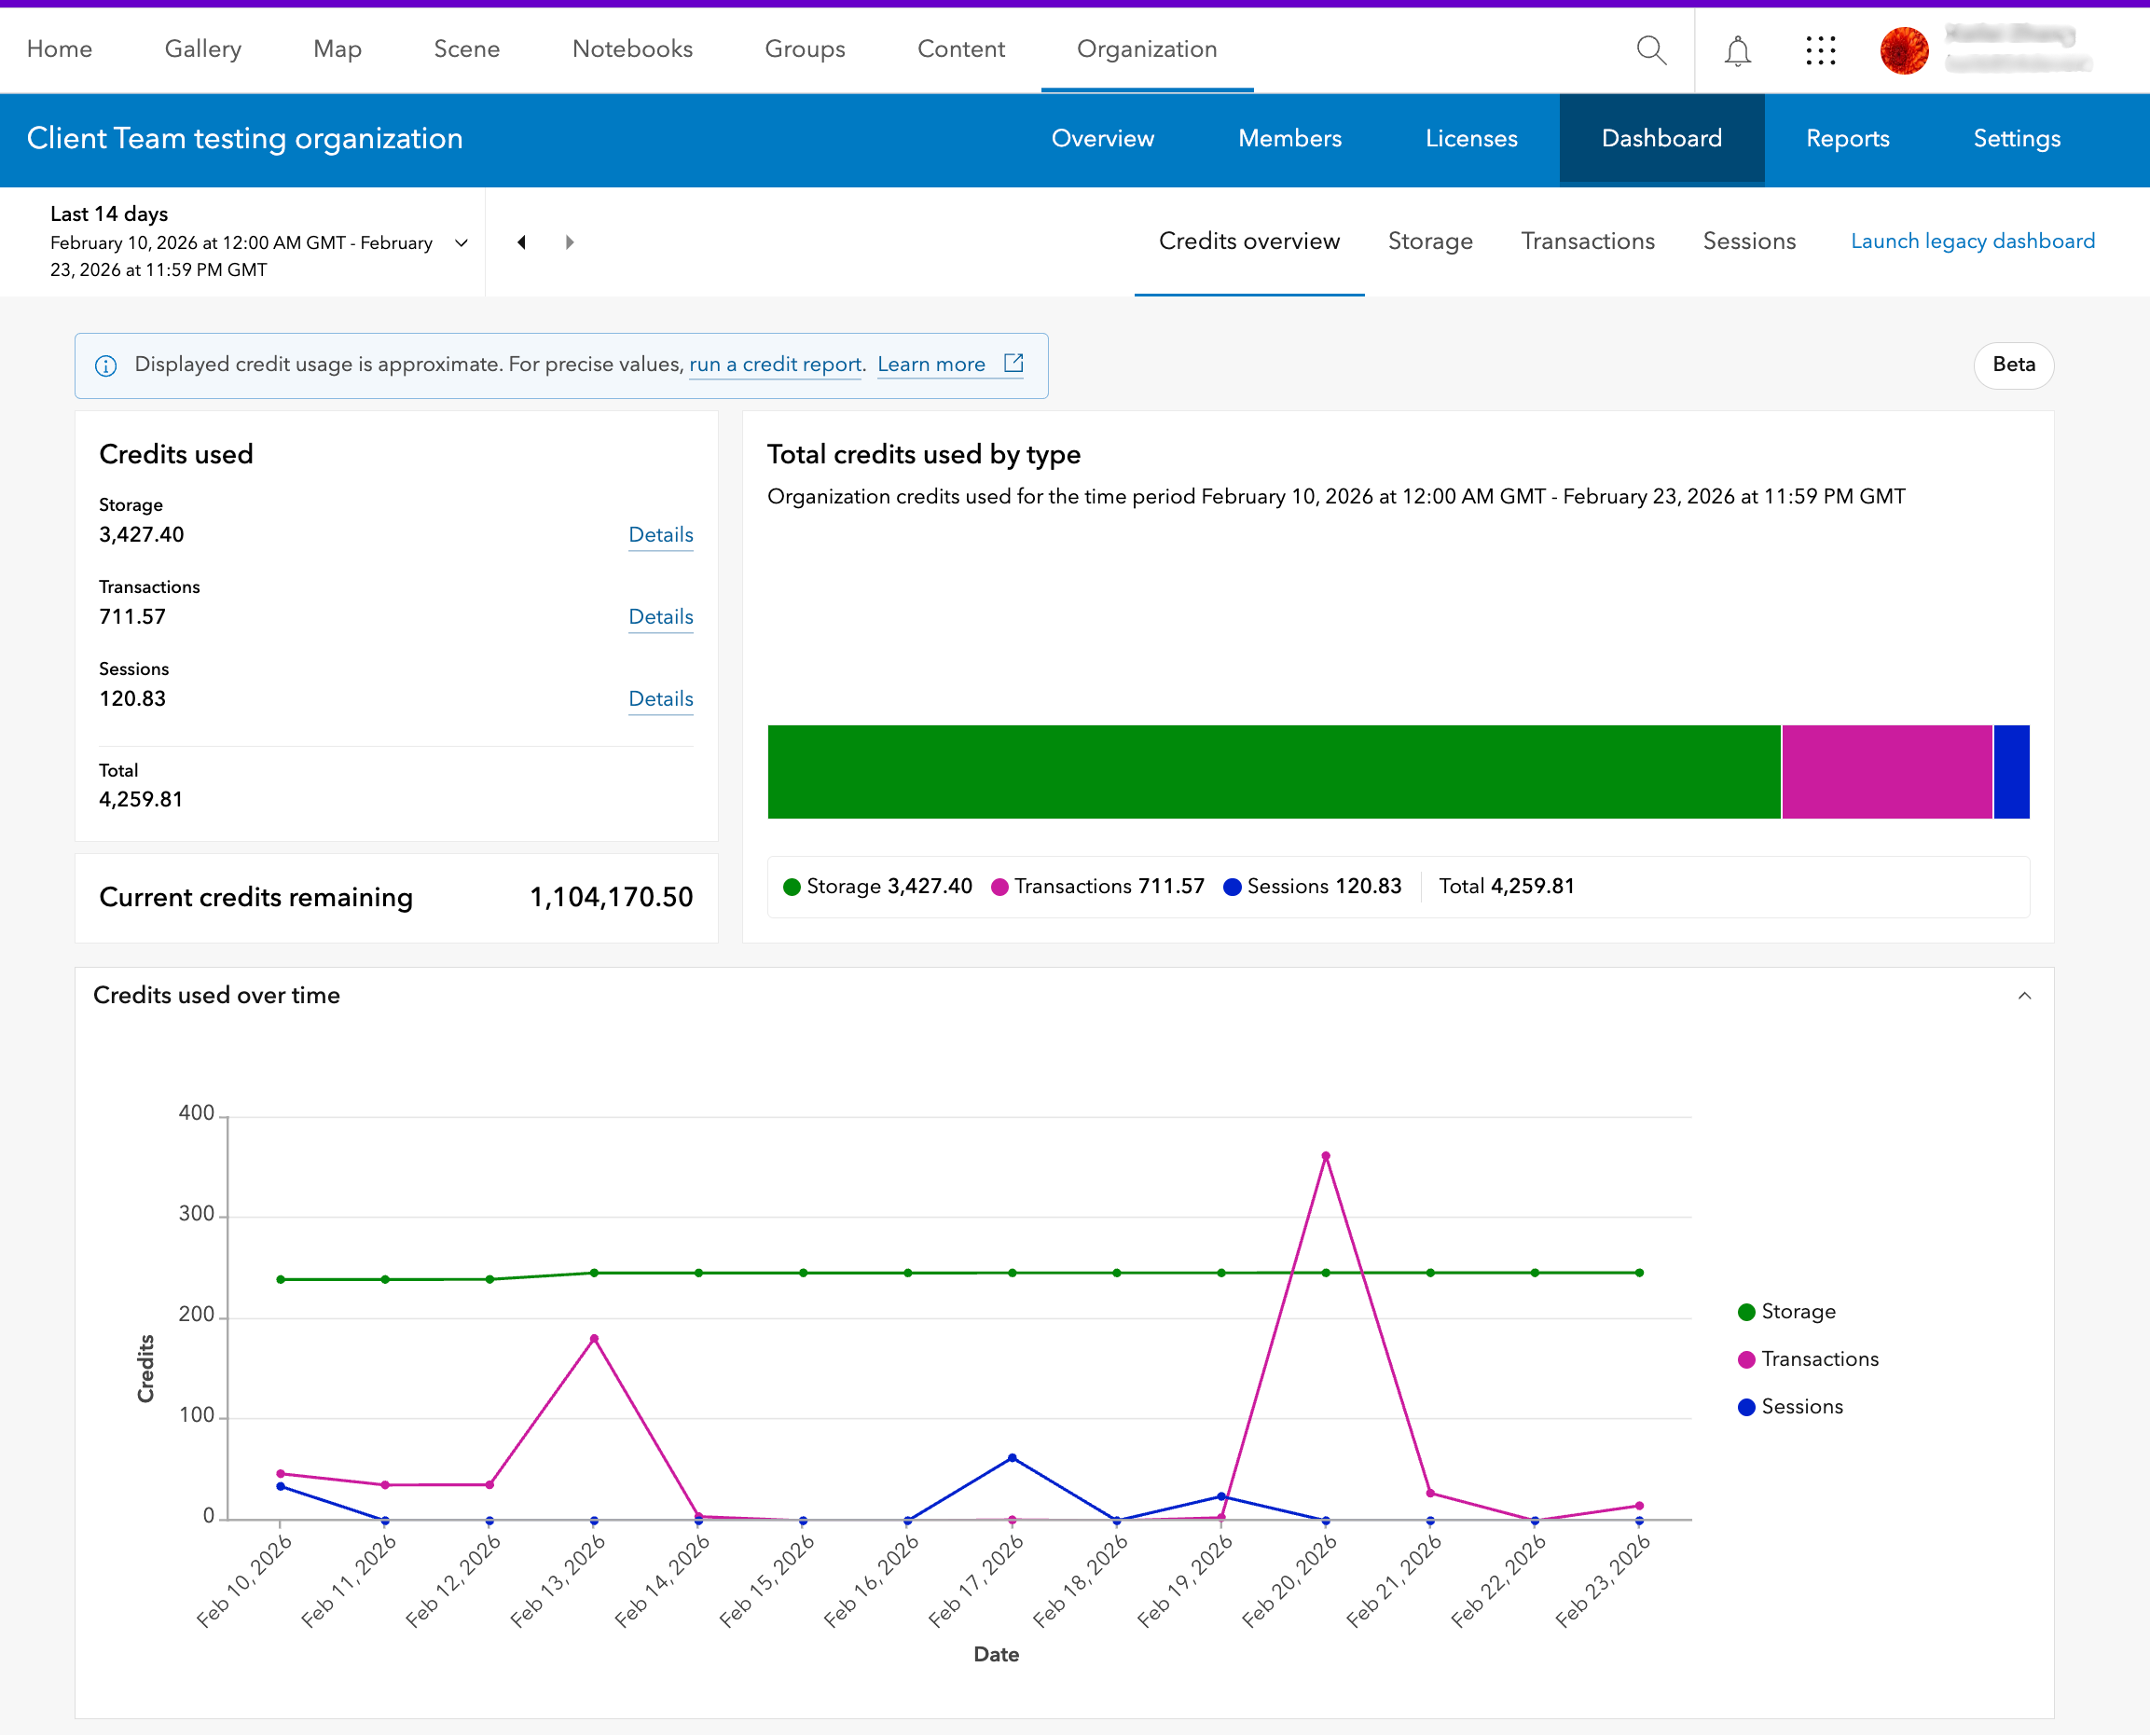
You can find the date picker at the top of the dashboard and use the listed date ranges like “Last 7 days,” “Last 30 days” or “Last quarter”. You can also select a custom range using the “daily”, “weekly” or “monthly” data aggregation. Once you set the data aggregation by days, weeks or months, the left and right arrows beside the date picker help you navigate the selected date duration forward and back.
Understanding how your organization consumes credits
The new beta dashboard provides insights about credit consumption of the organization. The dashboard organizes credit consumption into three primary categories – Storage, Transactions, and Sessions, that are based on how credits are consumed by the organization.
The Credits overview tab provides a high-level summary of your organization’s total credit consumption for the selected date range with enhanced visuals and breakdowns making it easier to spot trends in credit consumption over time. You’ll also find insights such as:
- Trend of credit consumption for each category (Storage, Transactions, and Sessions)
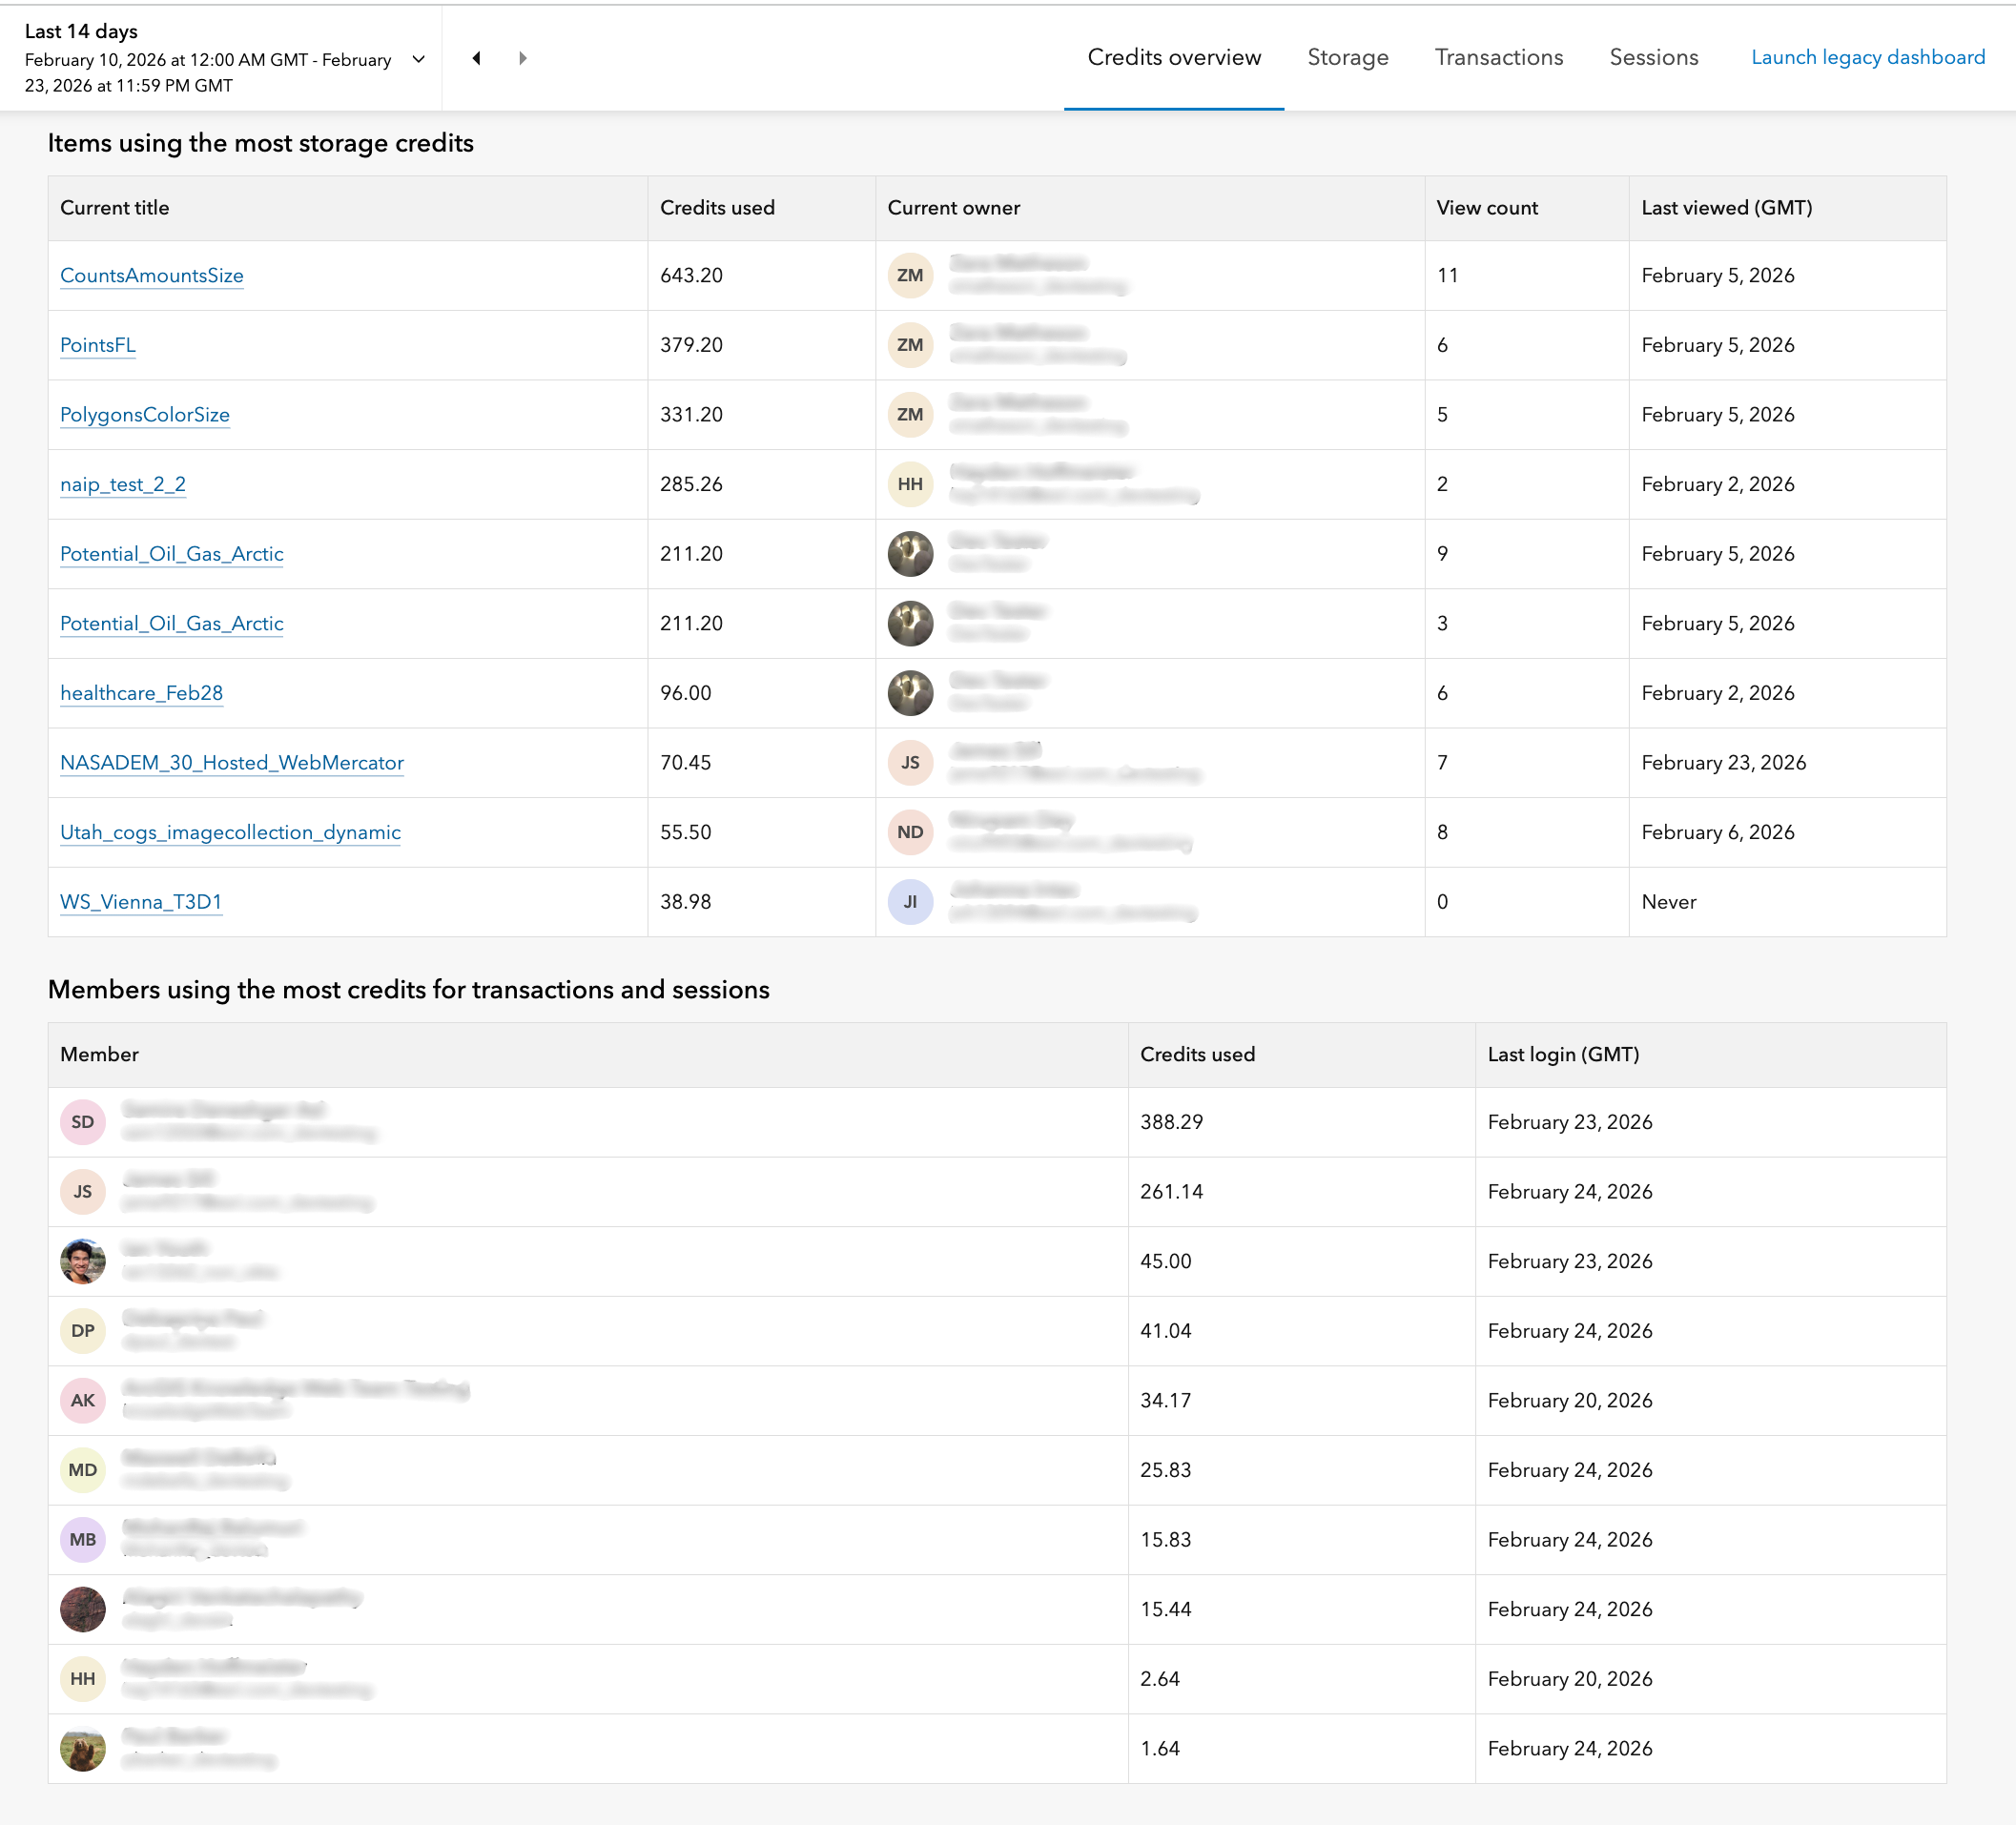
- Items using the most storage credits
- Members using the most credits for transactions and sessions
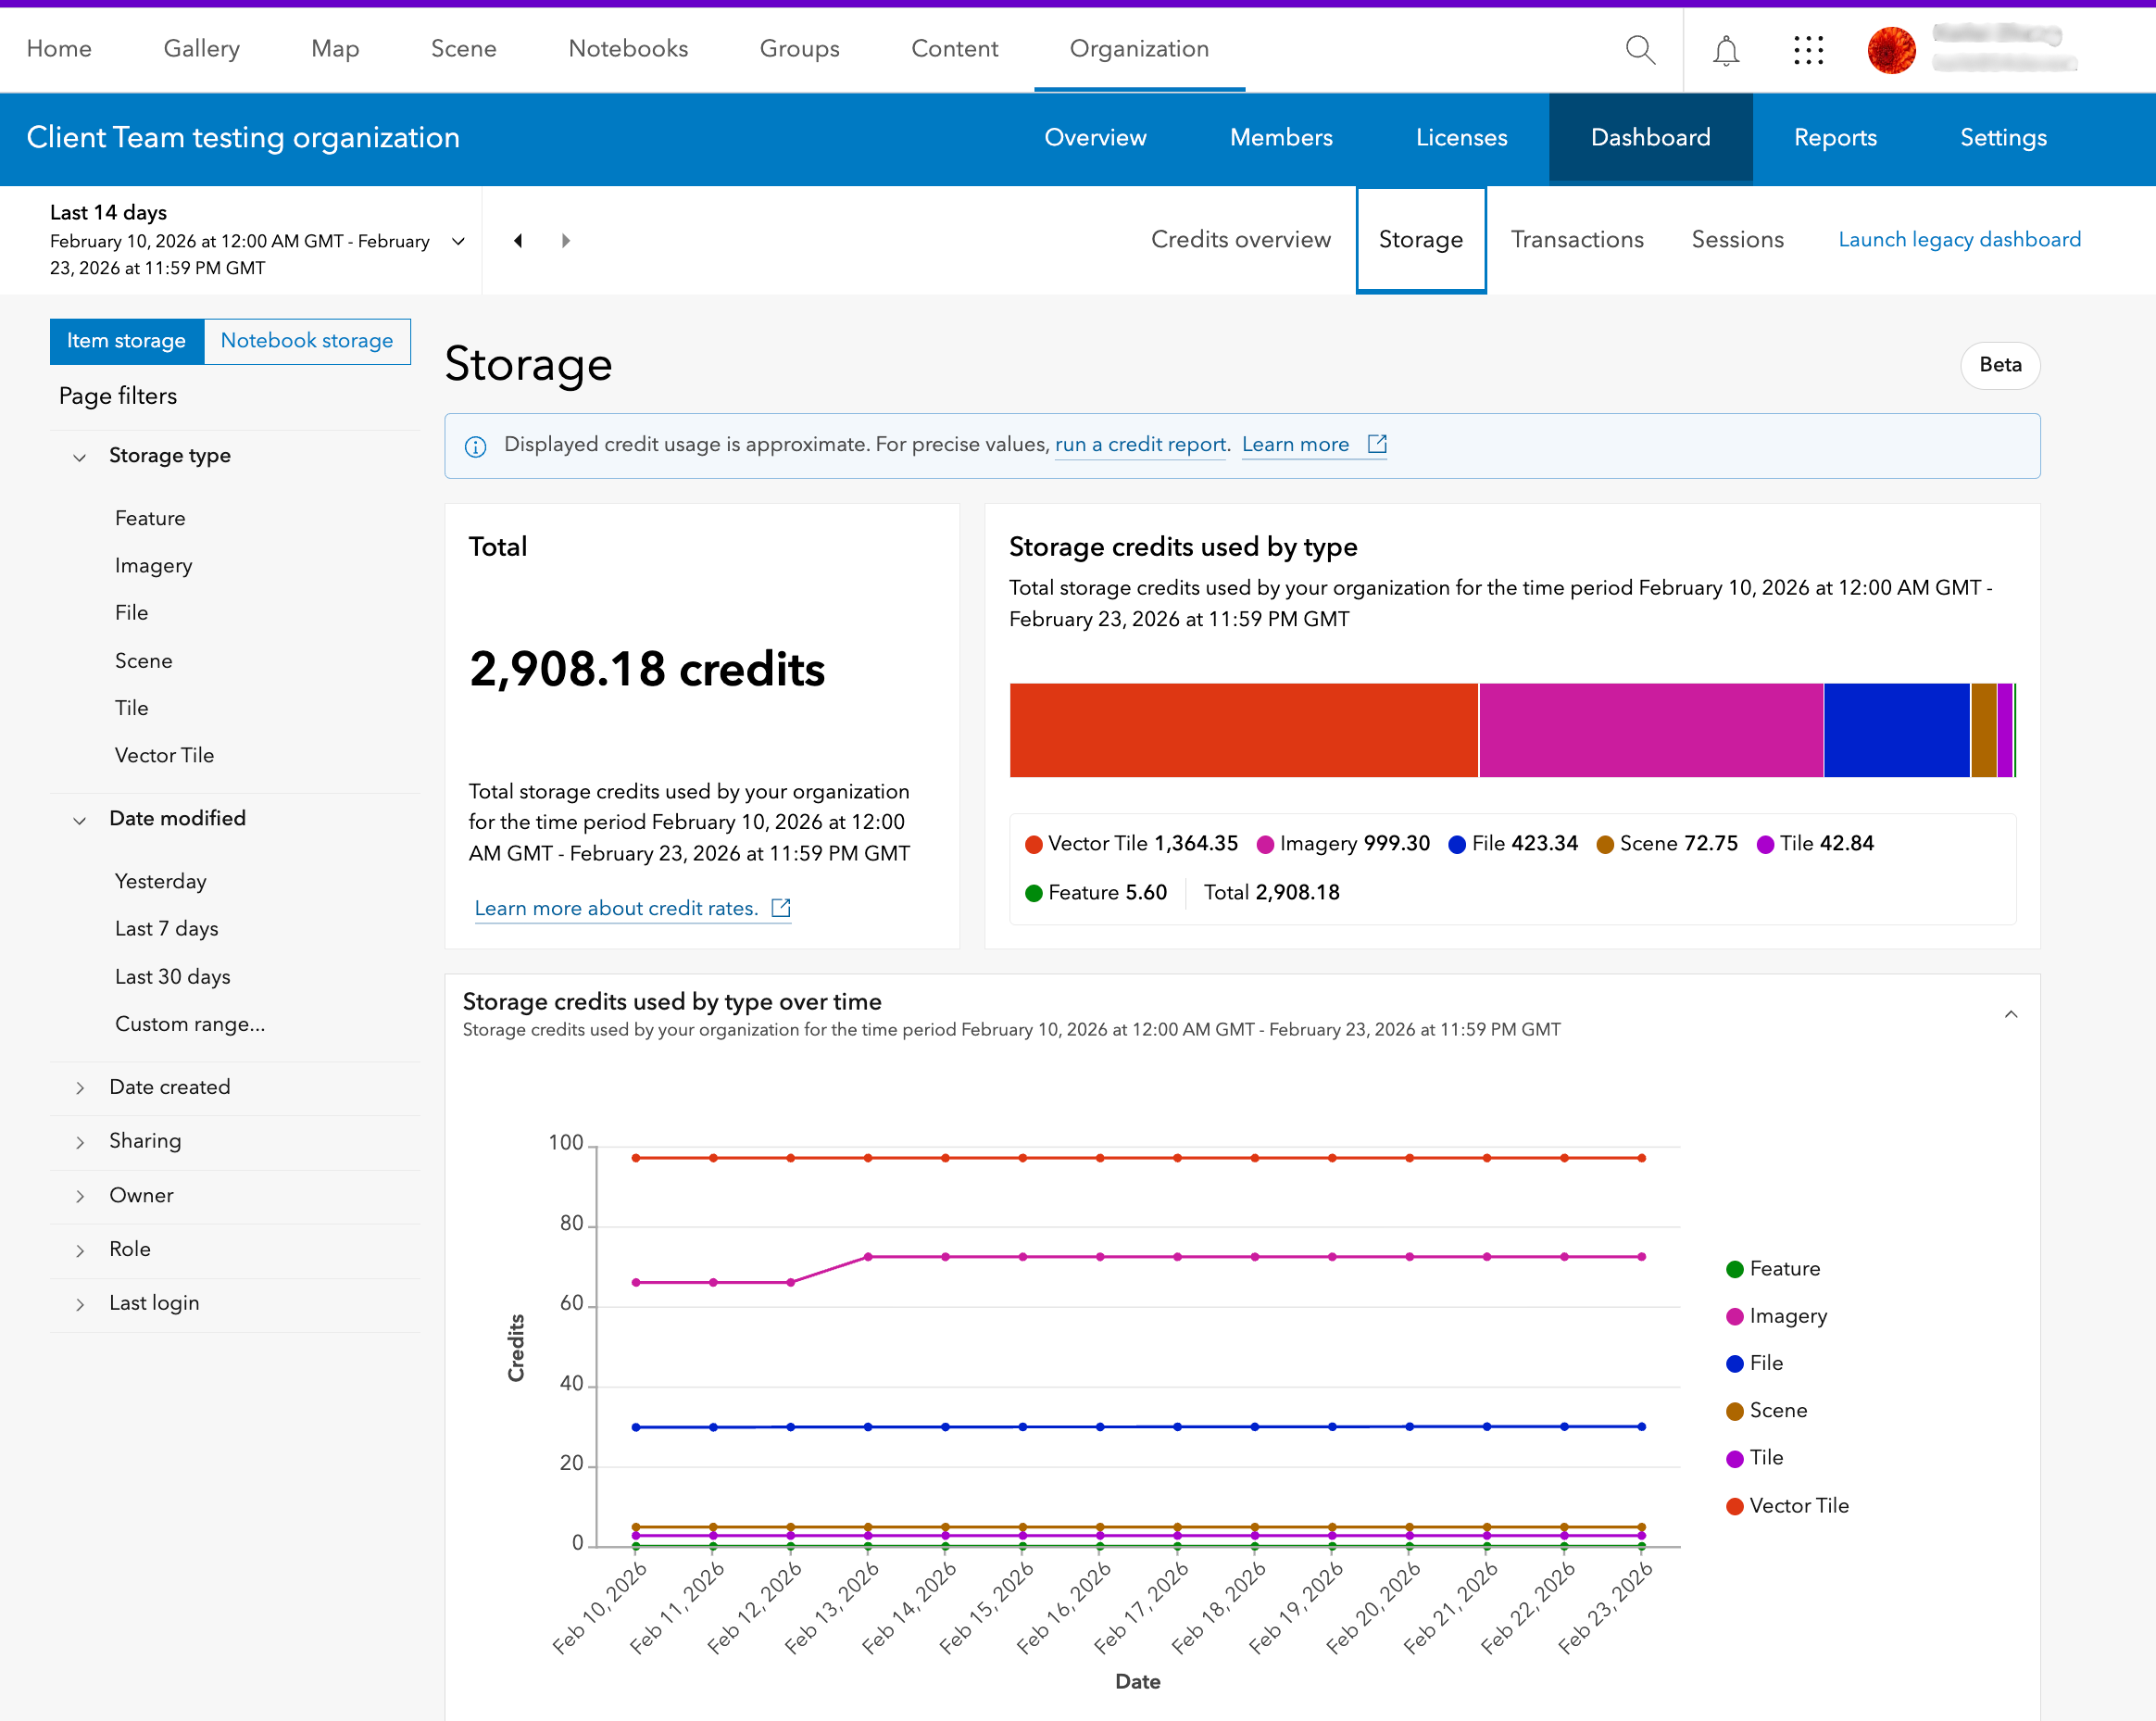
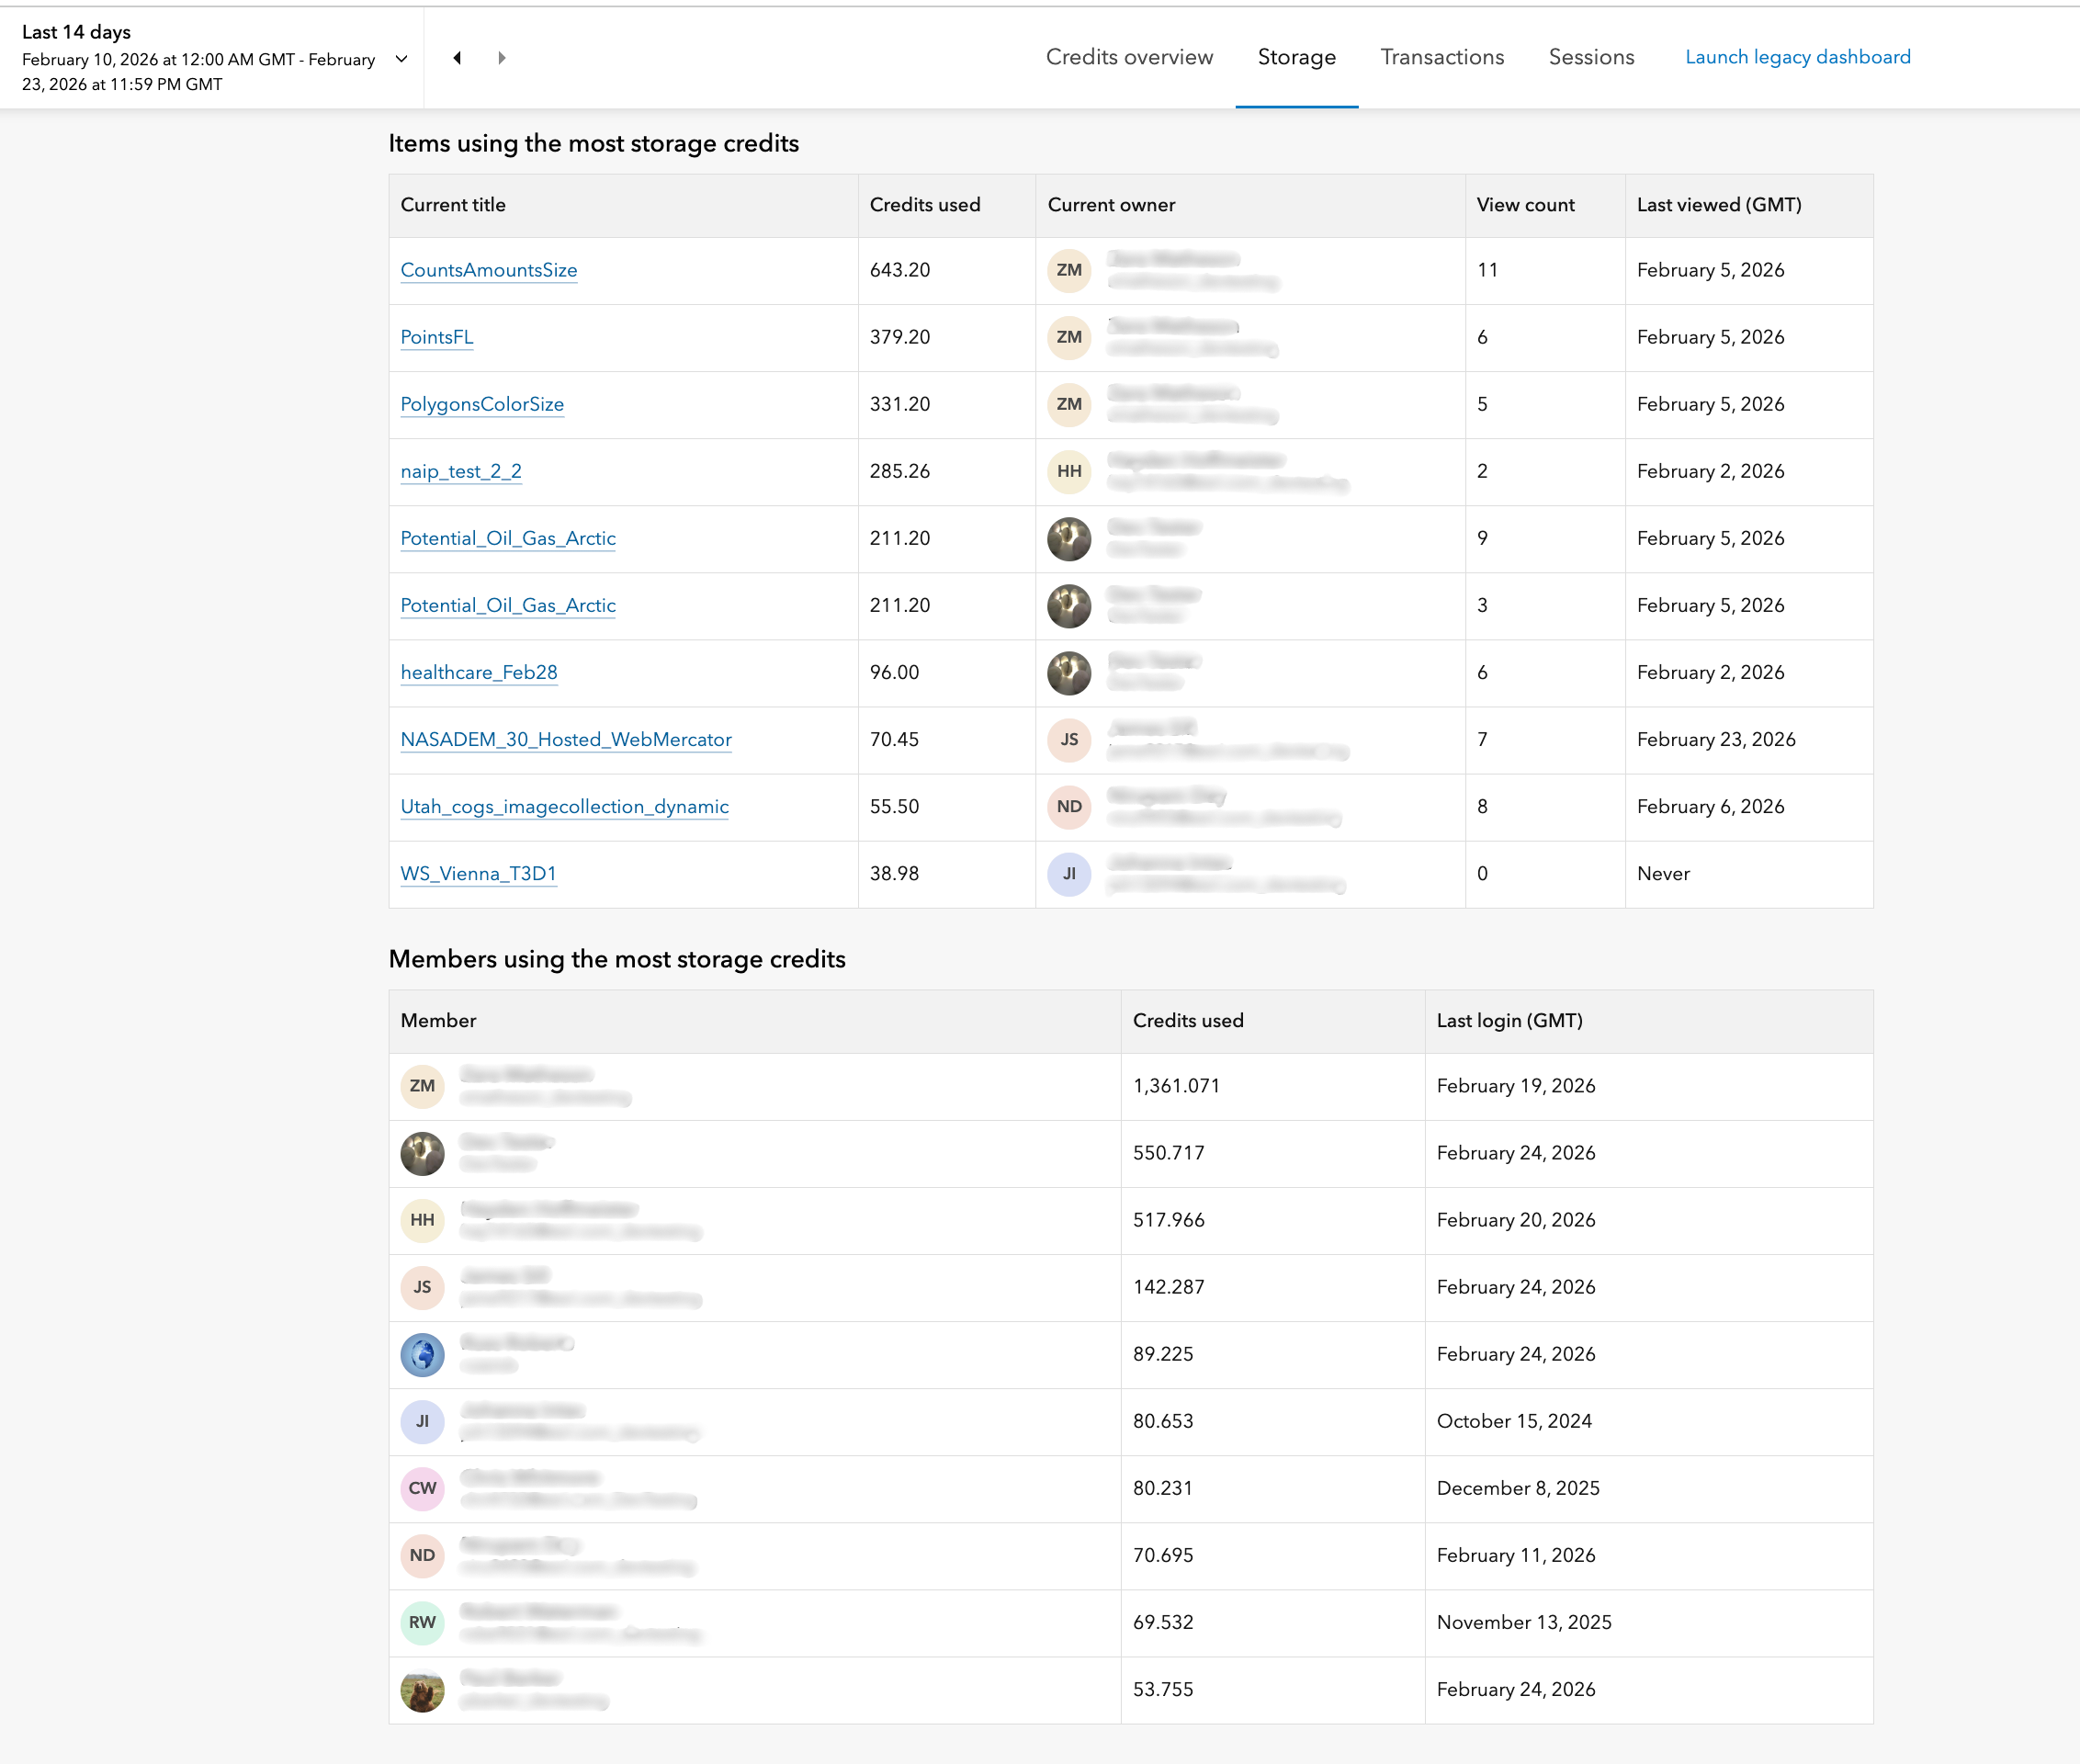
1. Storage
“Storage” refers to the storage of items in your ArcGIS Online organization. For more information about storage, check out Credits and storage. Storage is organized into two subcategories – item storage (such as hosted feature layers) and notebook storage (for notebook-specific files and outputs), making it easier to monitor and optimize usage for different workflows. You can see up to 10 members whose items collectively consumed the most credits for storage in the selected time period, and up to the top 10 individual items that consumed the most credits as well.
2. Transactions
Transaction-based tools—such as geocoding, GeoEnrichment, image analysis, and spatial analysis tools—are charged based on the number of records and the generated output. For more information about credit consumption when using analysis tools, check out Understand credits for spatial analysis.
You can see up to 10 members whose items collectively consumed the most credits for transactions in the selected time period, and up to the top 10 individual transaction types that consumed the most credits as well.
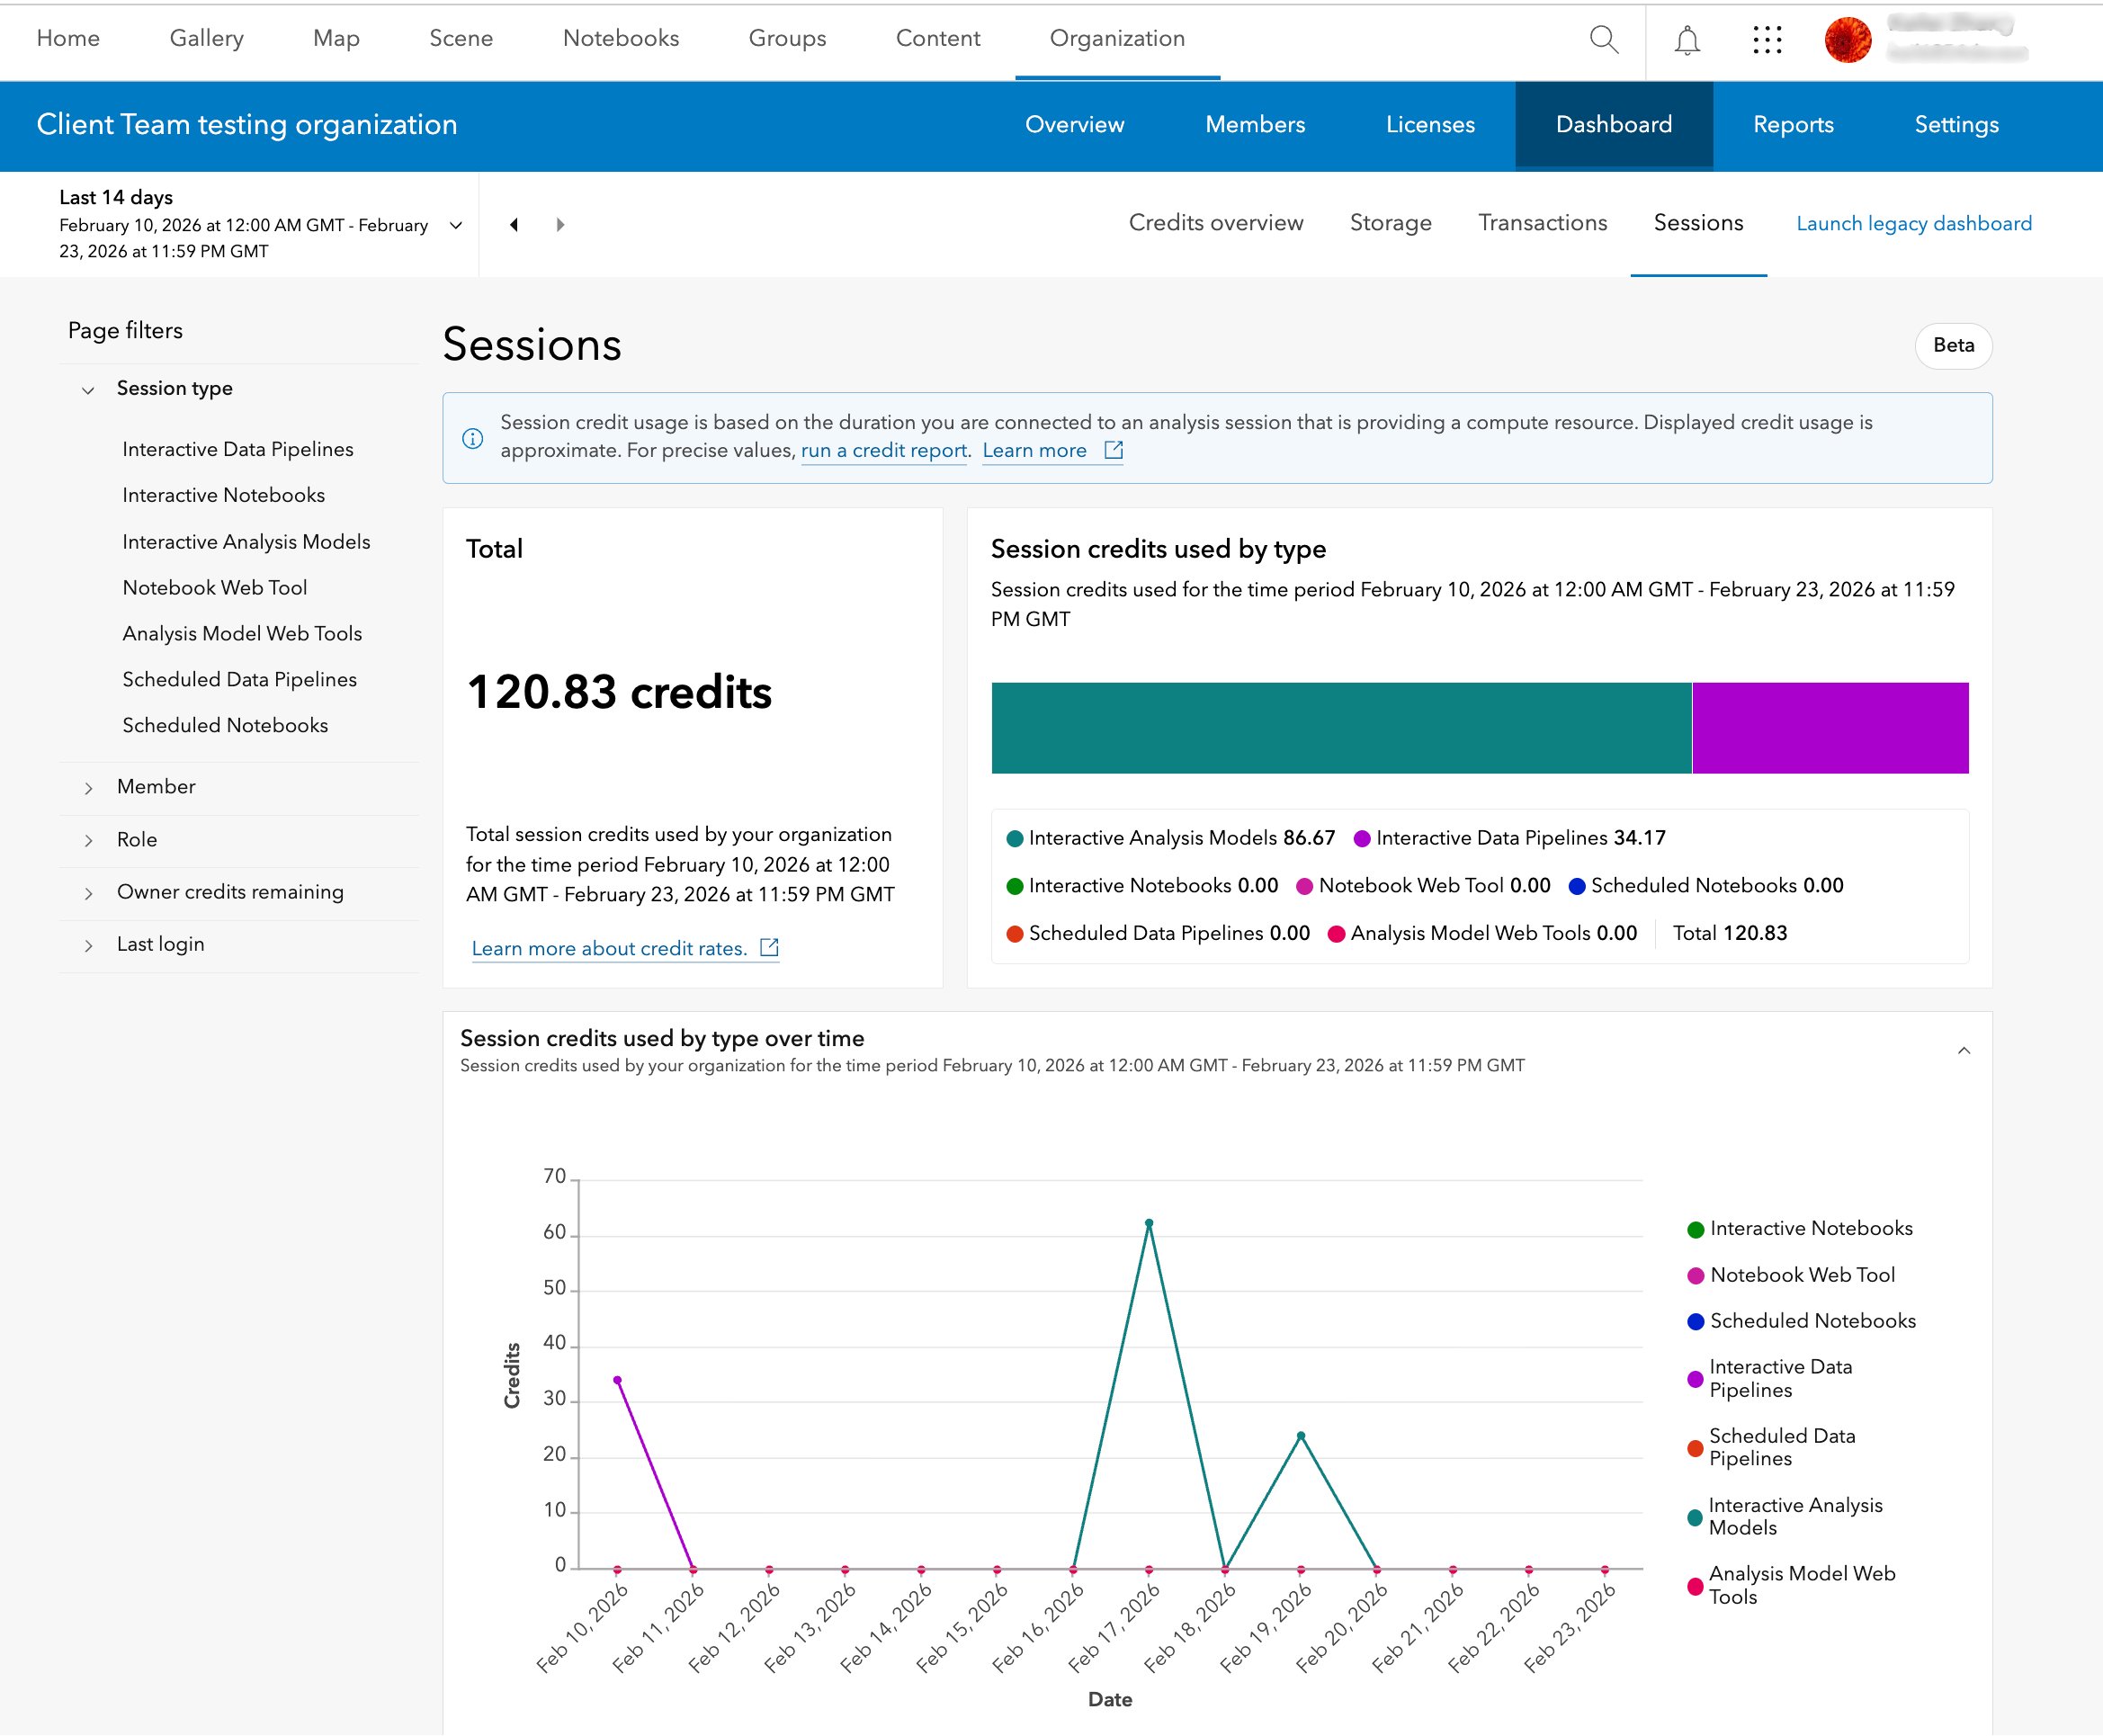
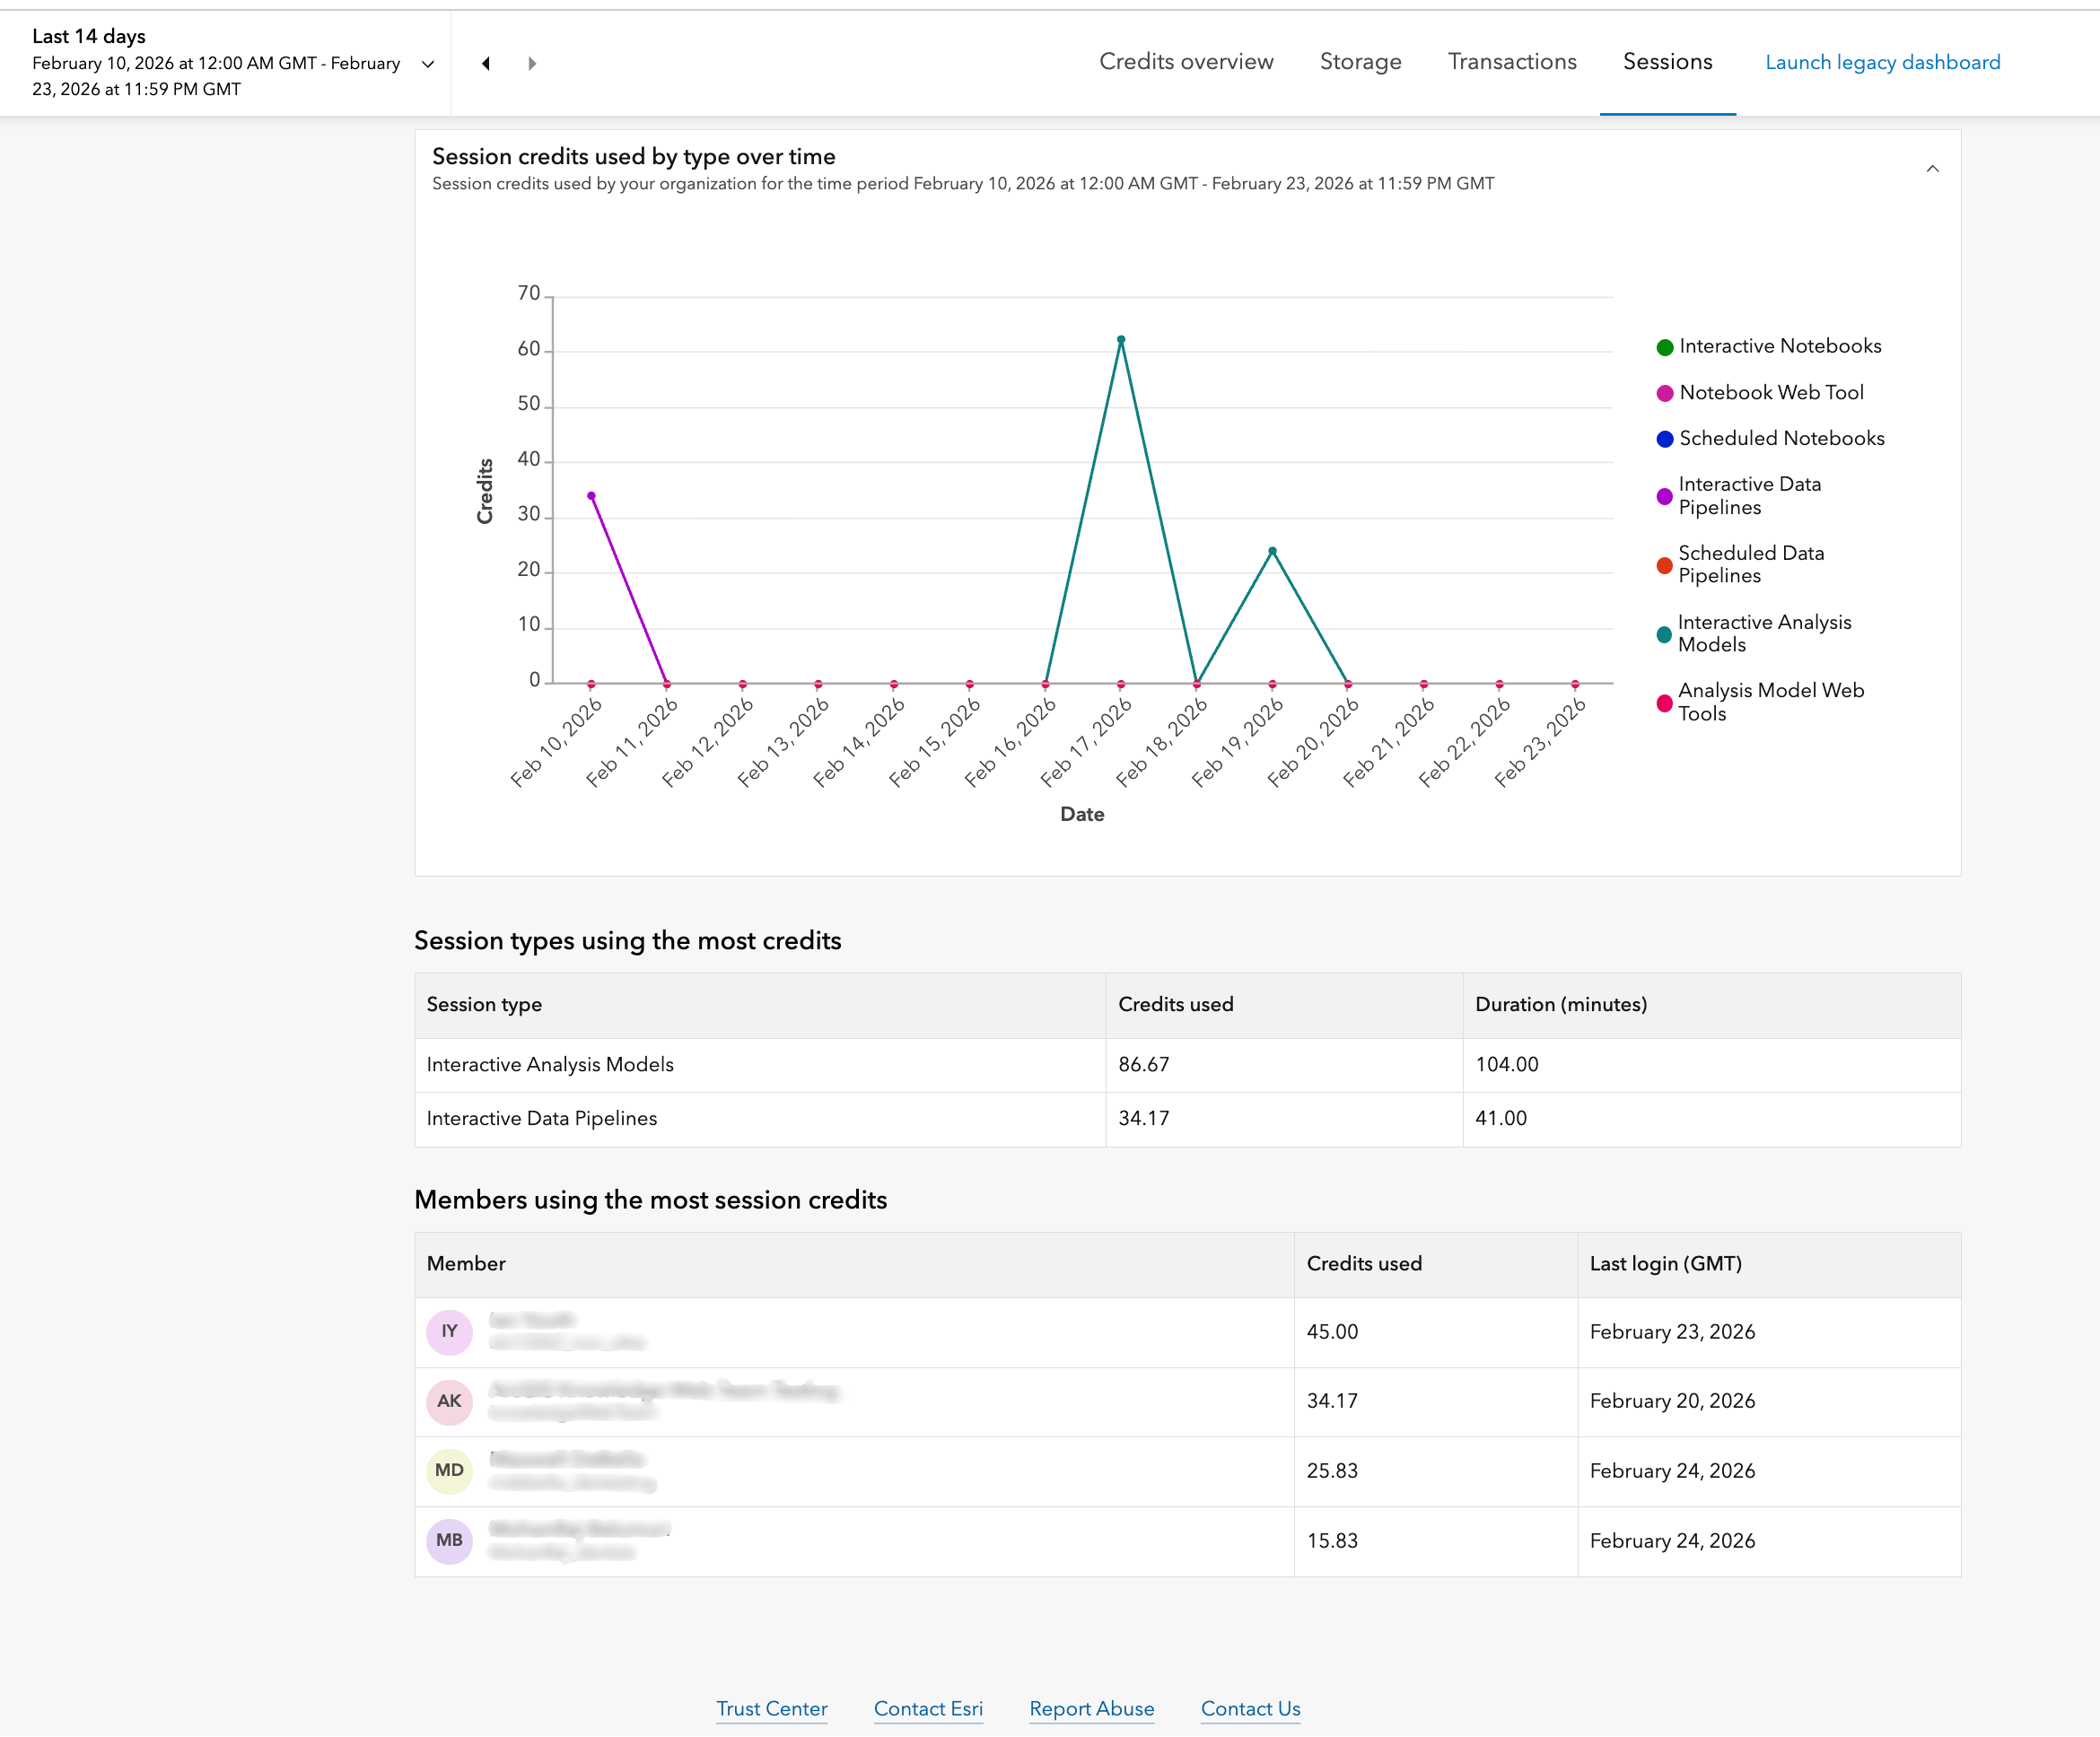
3. Sessions
The Sessions tab displays the organization’s credit consumption by sessions. Session credit usage is based on the duration you are connected to an analysis session that is providing a compute resource. You can see up to 10 members whose items collectively consumed the most credits for sessions in the selected time period, and up to the top 10 individual session types that consumed the most credits as well.
Feature comparison of the Legacy and New beta dashboard
| Feature | Legacy dashboard | New beta dashboard |
|---|---|---|
| Category | Storage
Analytics (transactions based) Subscriber Content Published Content Analytics (duration based) |
Storage
Transactions Transactions Transactions Sessions |
| Data availability | From the beginning of the last calendar year | From October 1, 2025 |
| Max data visualization range | From the beginning of the last calendar year | From October 1, 2025 |
| Date time aggregation logic | Excludes the end date (from 12:00 AM on the start date to 12:00 AM on the end date GMT) | Includes the entire end date (from 12:00 AM to 11:59:59 PM GMT) |
| Dashboard data update frequency | Every hour | Once a day, after the end of the GMT day |
| Dashboard reporting level | Organization level only | Organization, item and member level |
Takeaway
Notable improvements in the new beta dashboard include a refreshed user interface, more intuitive navigation, and advanced filtering capabilities, allowing for deeper insights and faster decision-making. We hope you take this opportunity and explore the new beta dashboard and provide feedback to ensure it meets your needs.
Thank you to the following teammates for their contributions to the blog article: Umang Shah, Mike Minami and Shane Eaves.

Article Discussion: