The Organization Status dashboard provides administrators with a centralized experience for monitoring organizational activity, credit consumption, and content usage. Introduced in the February 2026 ArcGIS Online update, the dashboard helps organizations better understand how credits are being consumed into three primary categories – Storage, Transactions, and Sessions. By bringing together both high-level trends and detailed usage insights, administrators can identify which content, members, and workflows are driving resource consumption, monitor credit usage over time, and make more informed decisions about governance and resource management.
Status Dashboard: Now the default experience
In the previous release, access to the Status dashboard required enabling beta features, and the Legacy dashboard remained the primary experience. With the ArcGIS Online June 2026 update, the Status dashboard is moving out of beta and becoming the default experience for all organizations, eliminating the need for special settings or feature enablement. This transition reflects Esri’s continued investment in providing administrators with a more modern, intuitive, and comprehensive way to monitor organizational activity, credit consumption, and subscription usage. Organizations currently using the Legacy dashboard are encouraged to explore the enhanced experience and take advantage of its expanded reporting and analysis capabilities.
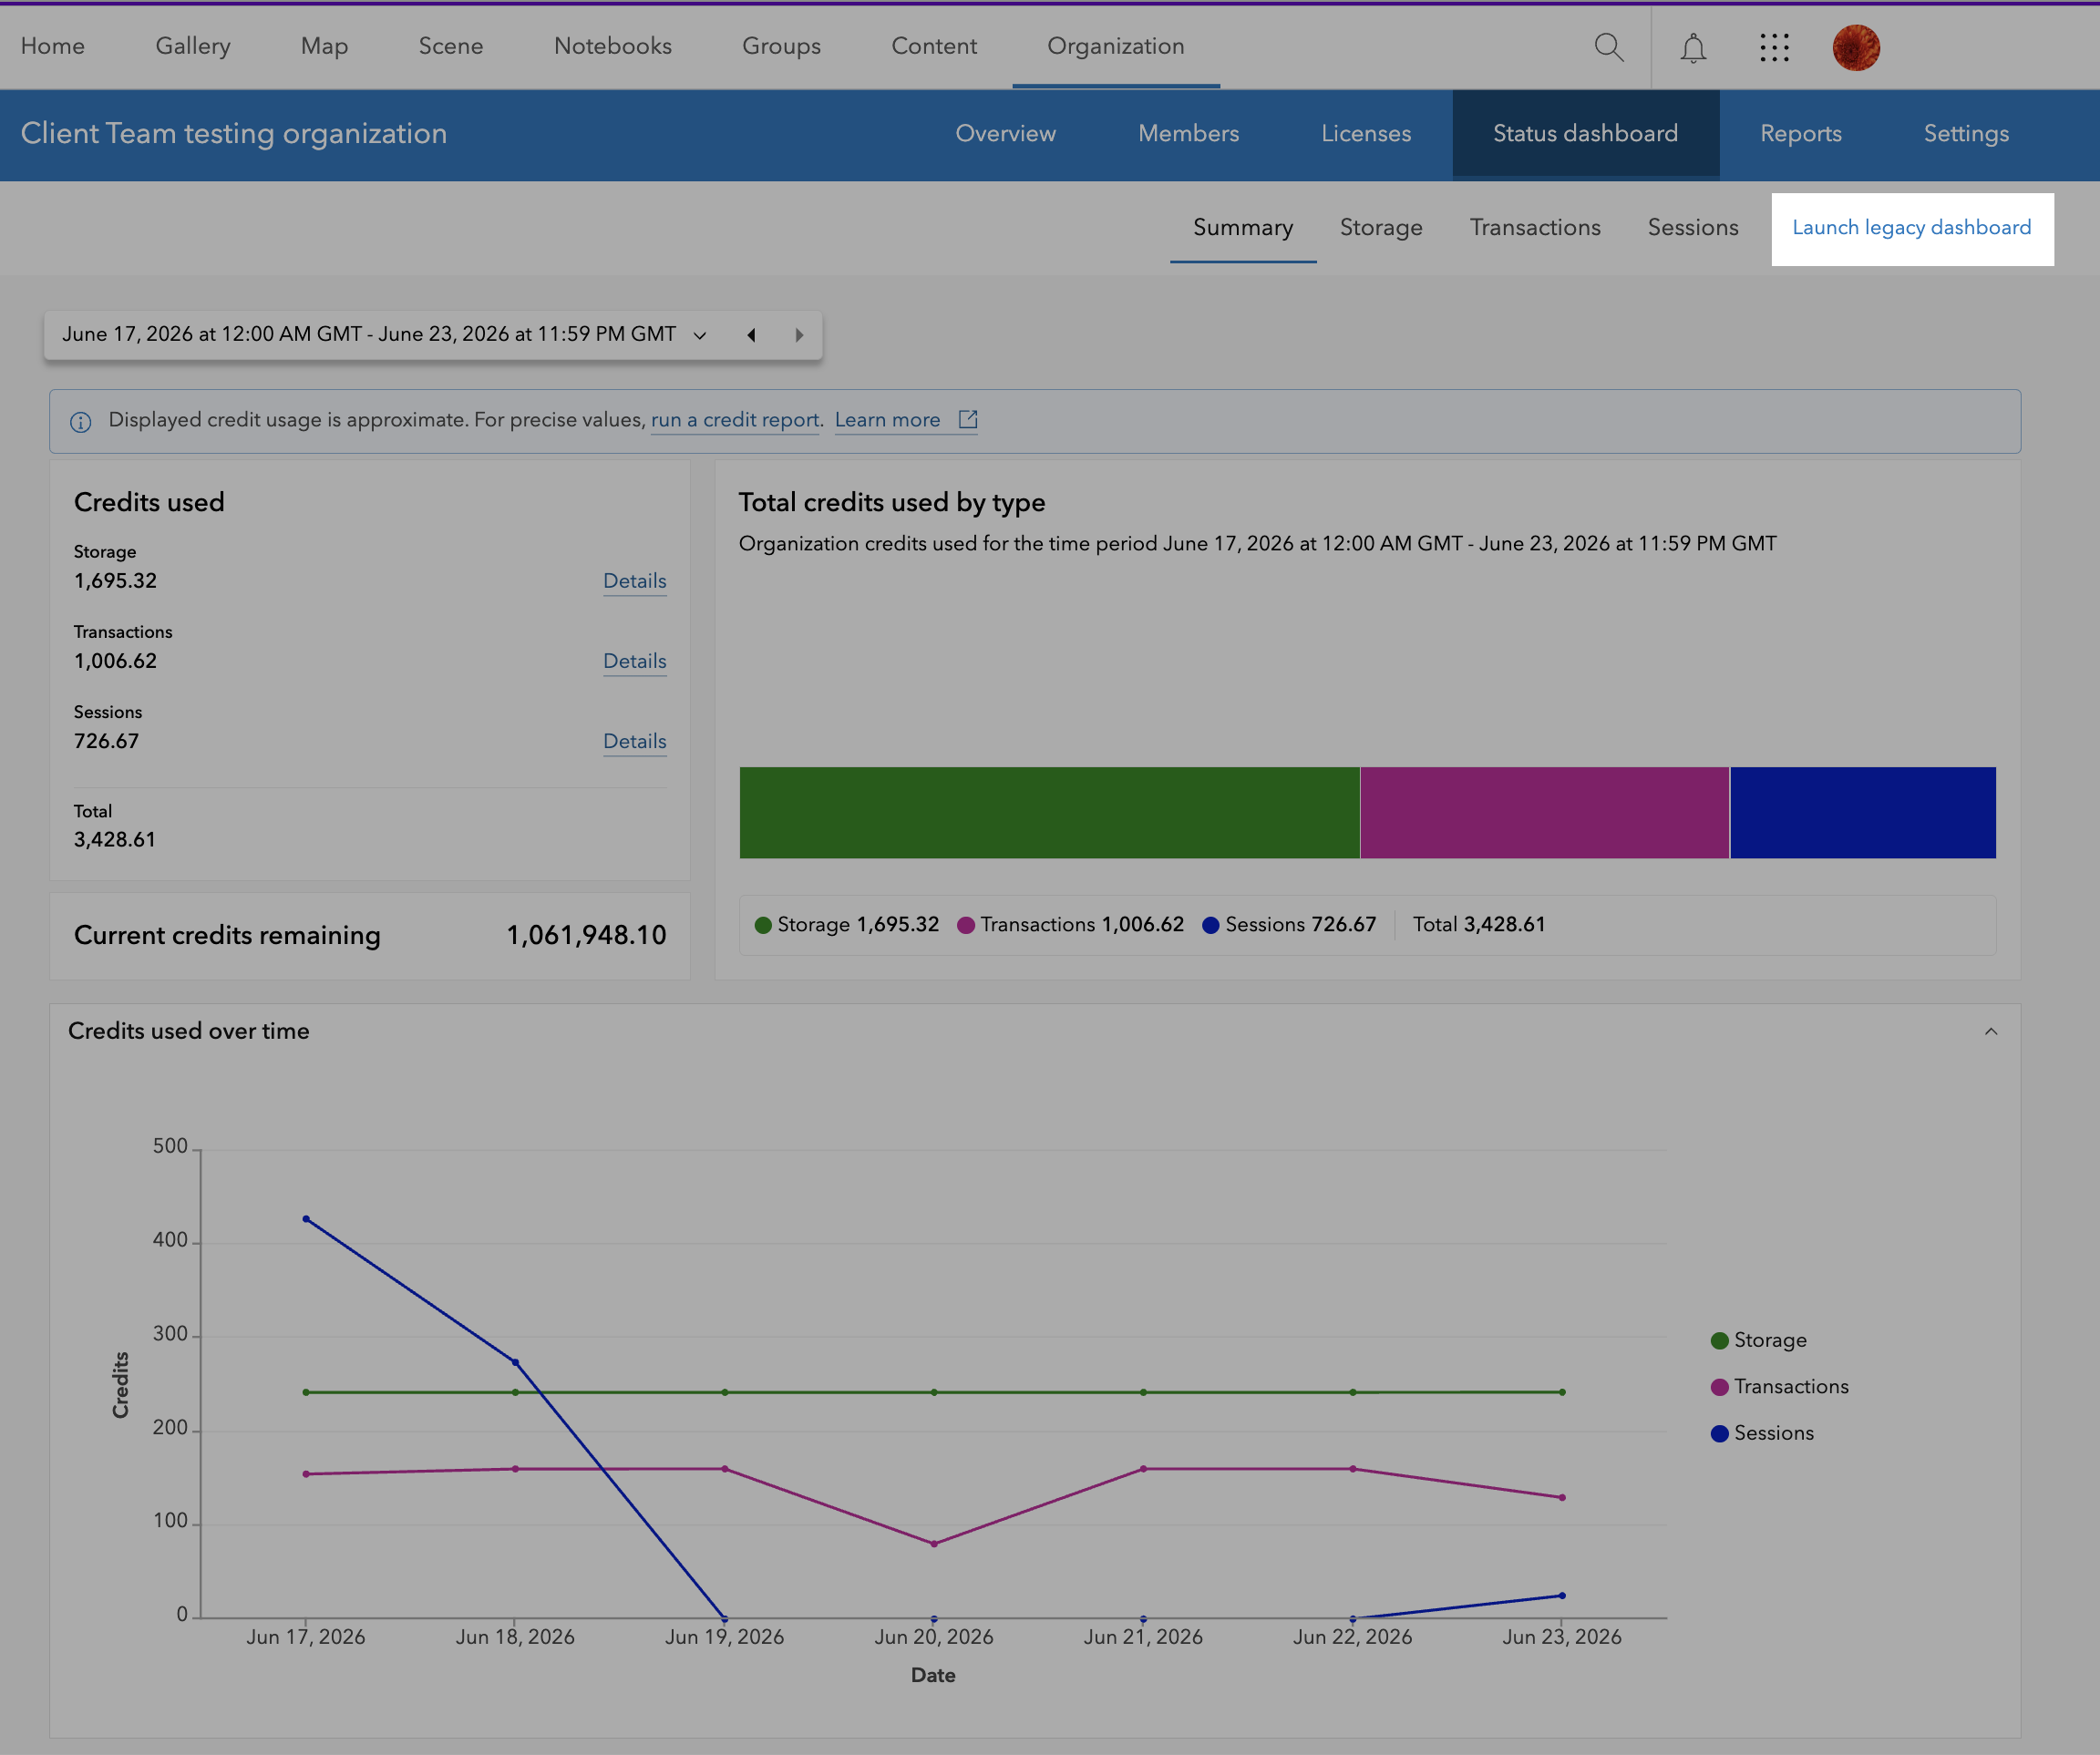
Note: You can switch back to the Legacy dashboard anytime by clicking on “Launch legacy dashboard”, allowing you to transition at your own pace.
A Better Way to Monitor Your Organization
A key goal of this release was to ensure that administrators can confidently transition from the Legacy dashboard without losing access to critical functionality. The new Status dashboard includes the core capabilities available in the Legacy dashboard while introducing several enhancements that provide deeper insights and improved usability.
Enhanced Organization Overview
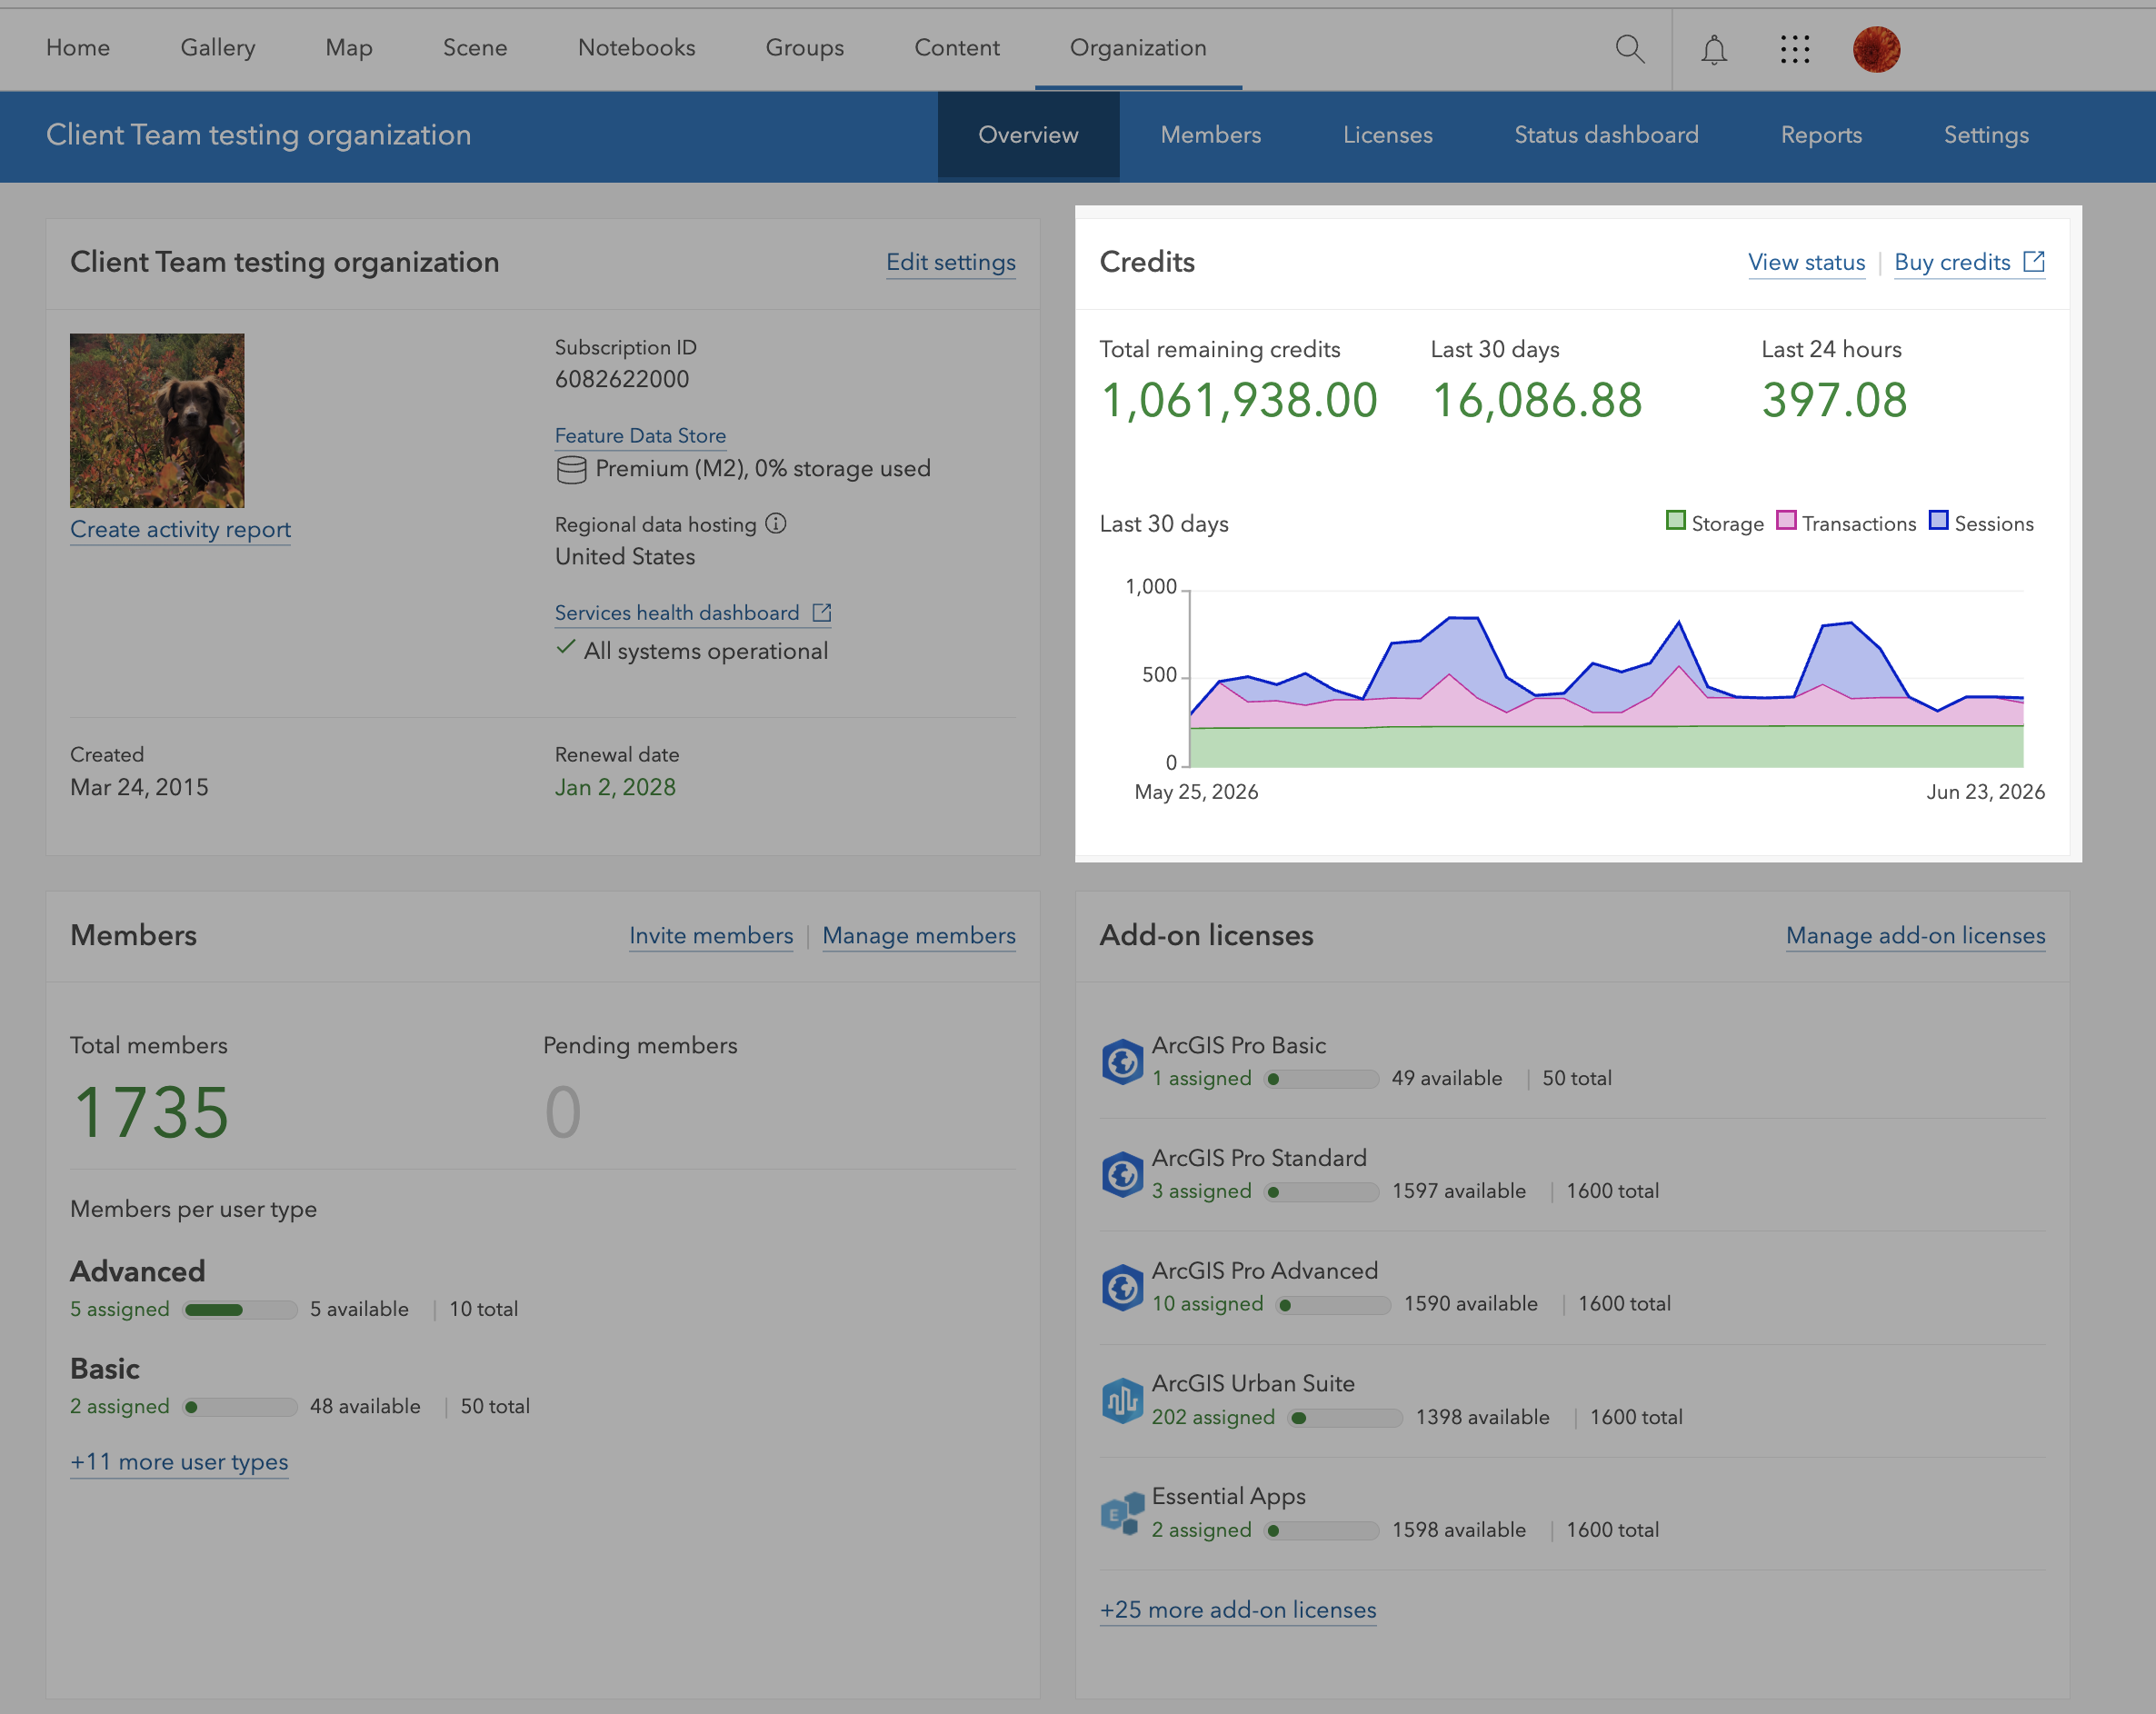
- Credits overview card: Credit usage is now categorized by Storage, Transactions, and Sessions, providing a more detailed view of where credits are being consumed and aligning with the reporting available throughout the Status dashboard.
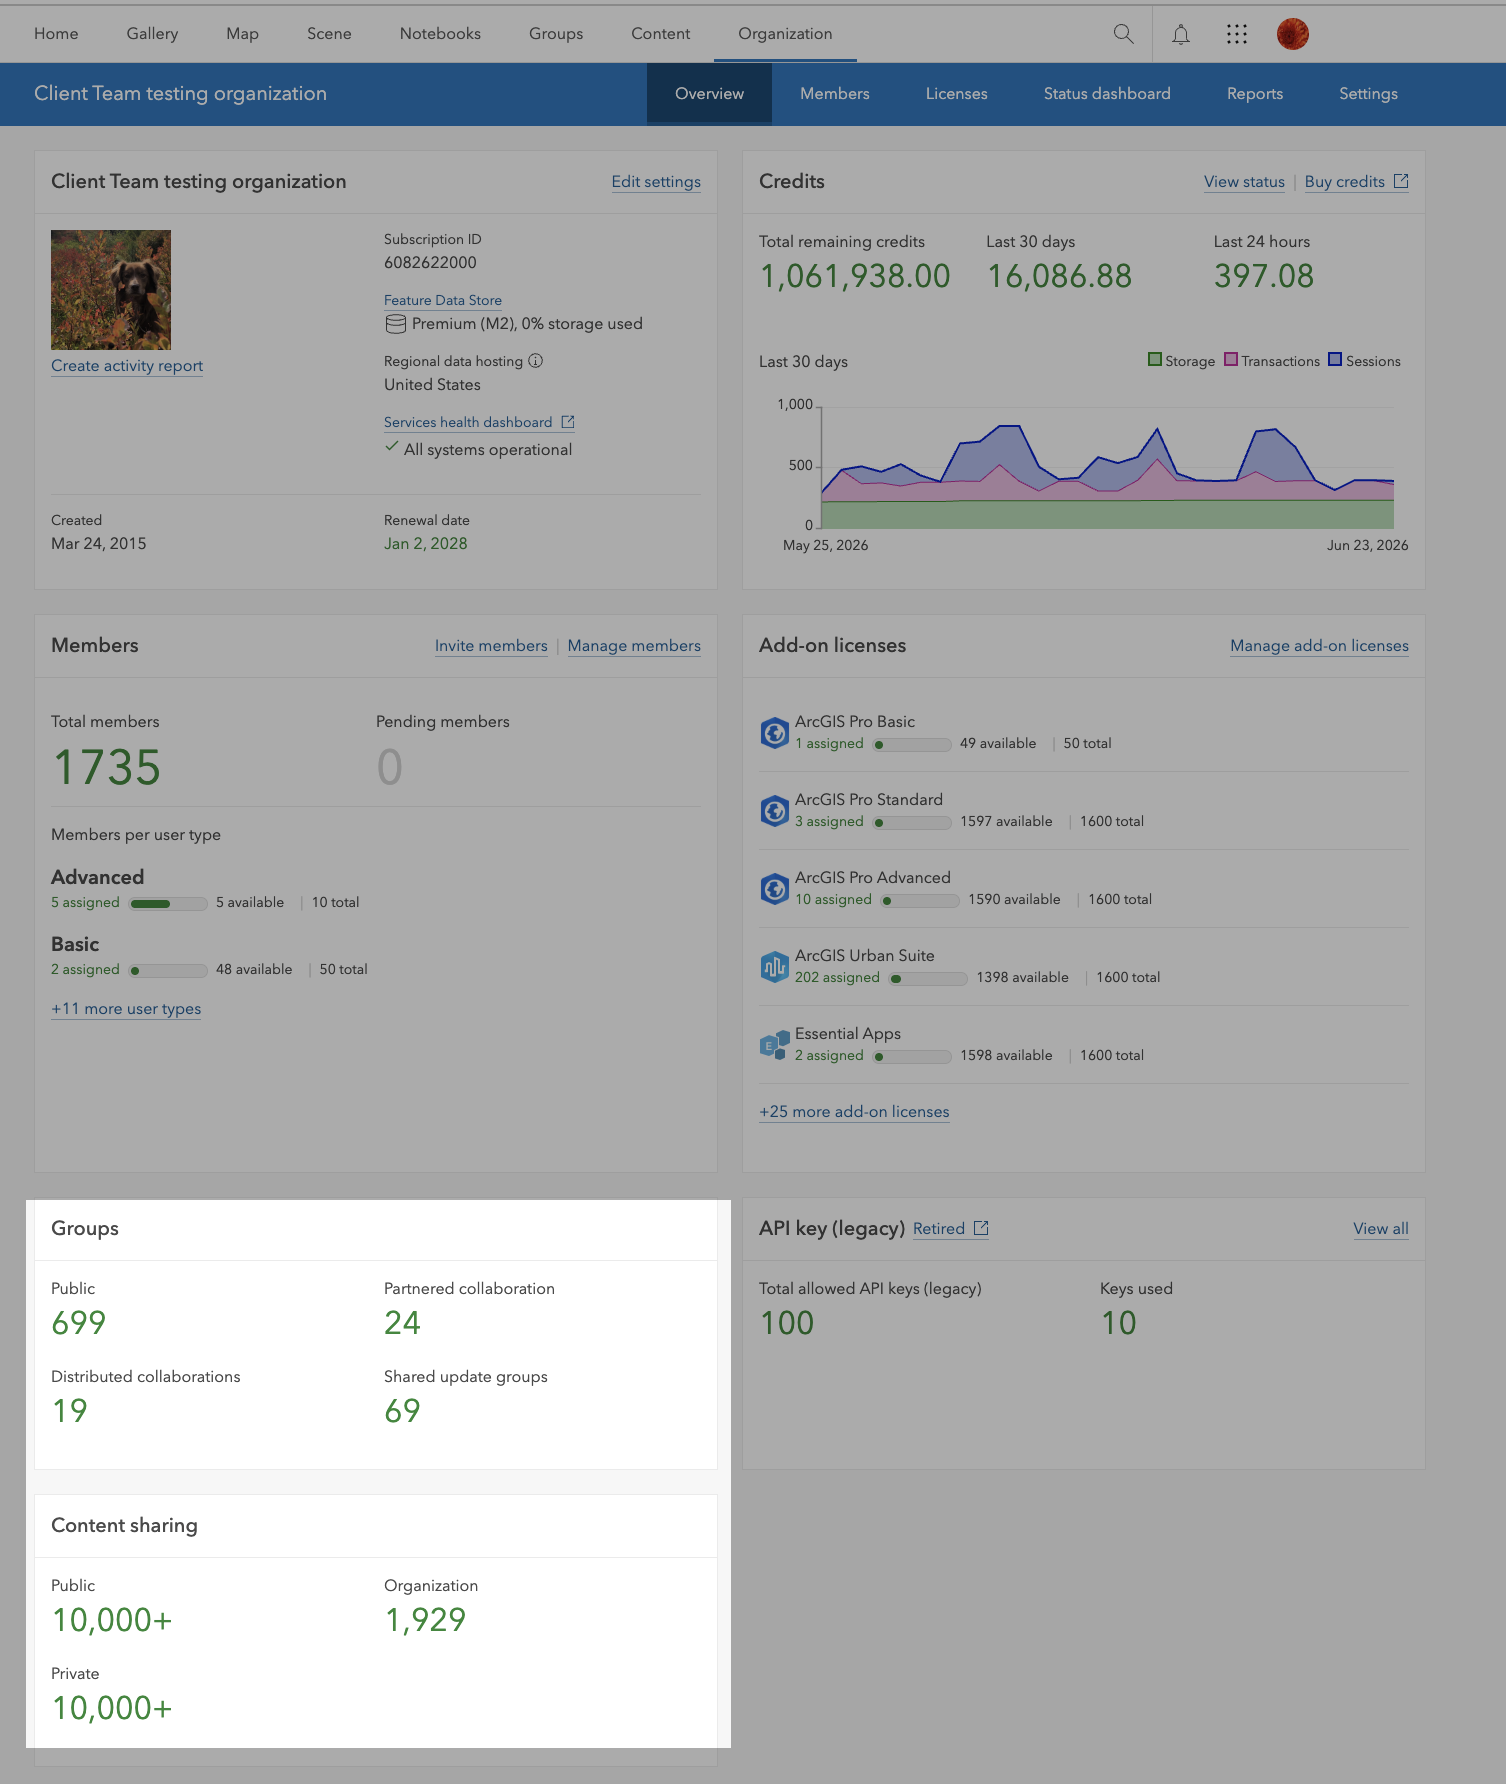
- Group & Content Sharing: Information from the Content and Groups sections in the Legacy dashboard is now integrated into the Overview for a more holistic view.
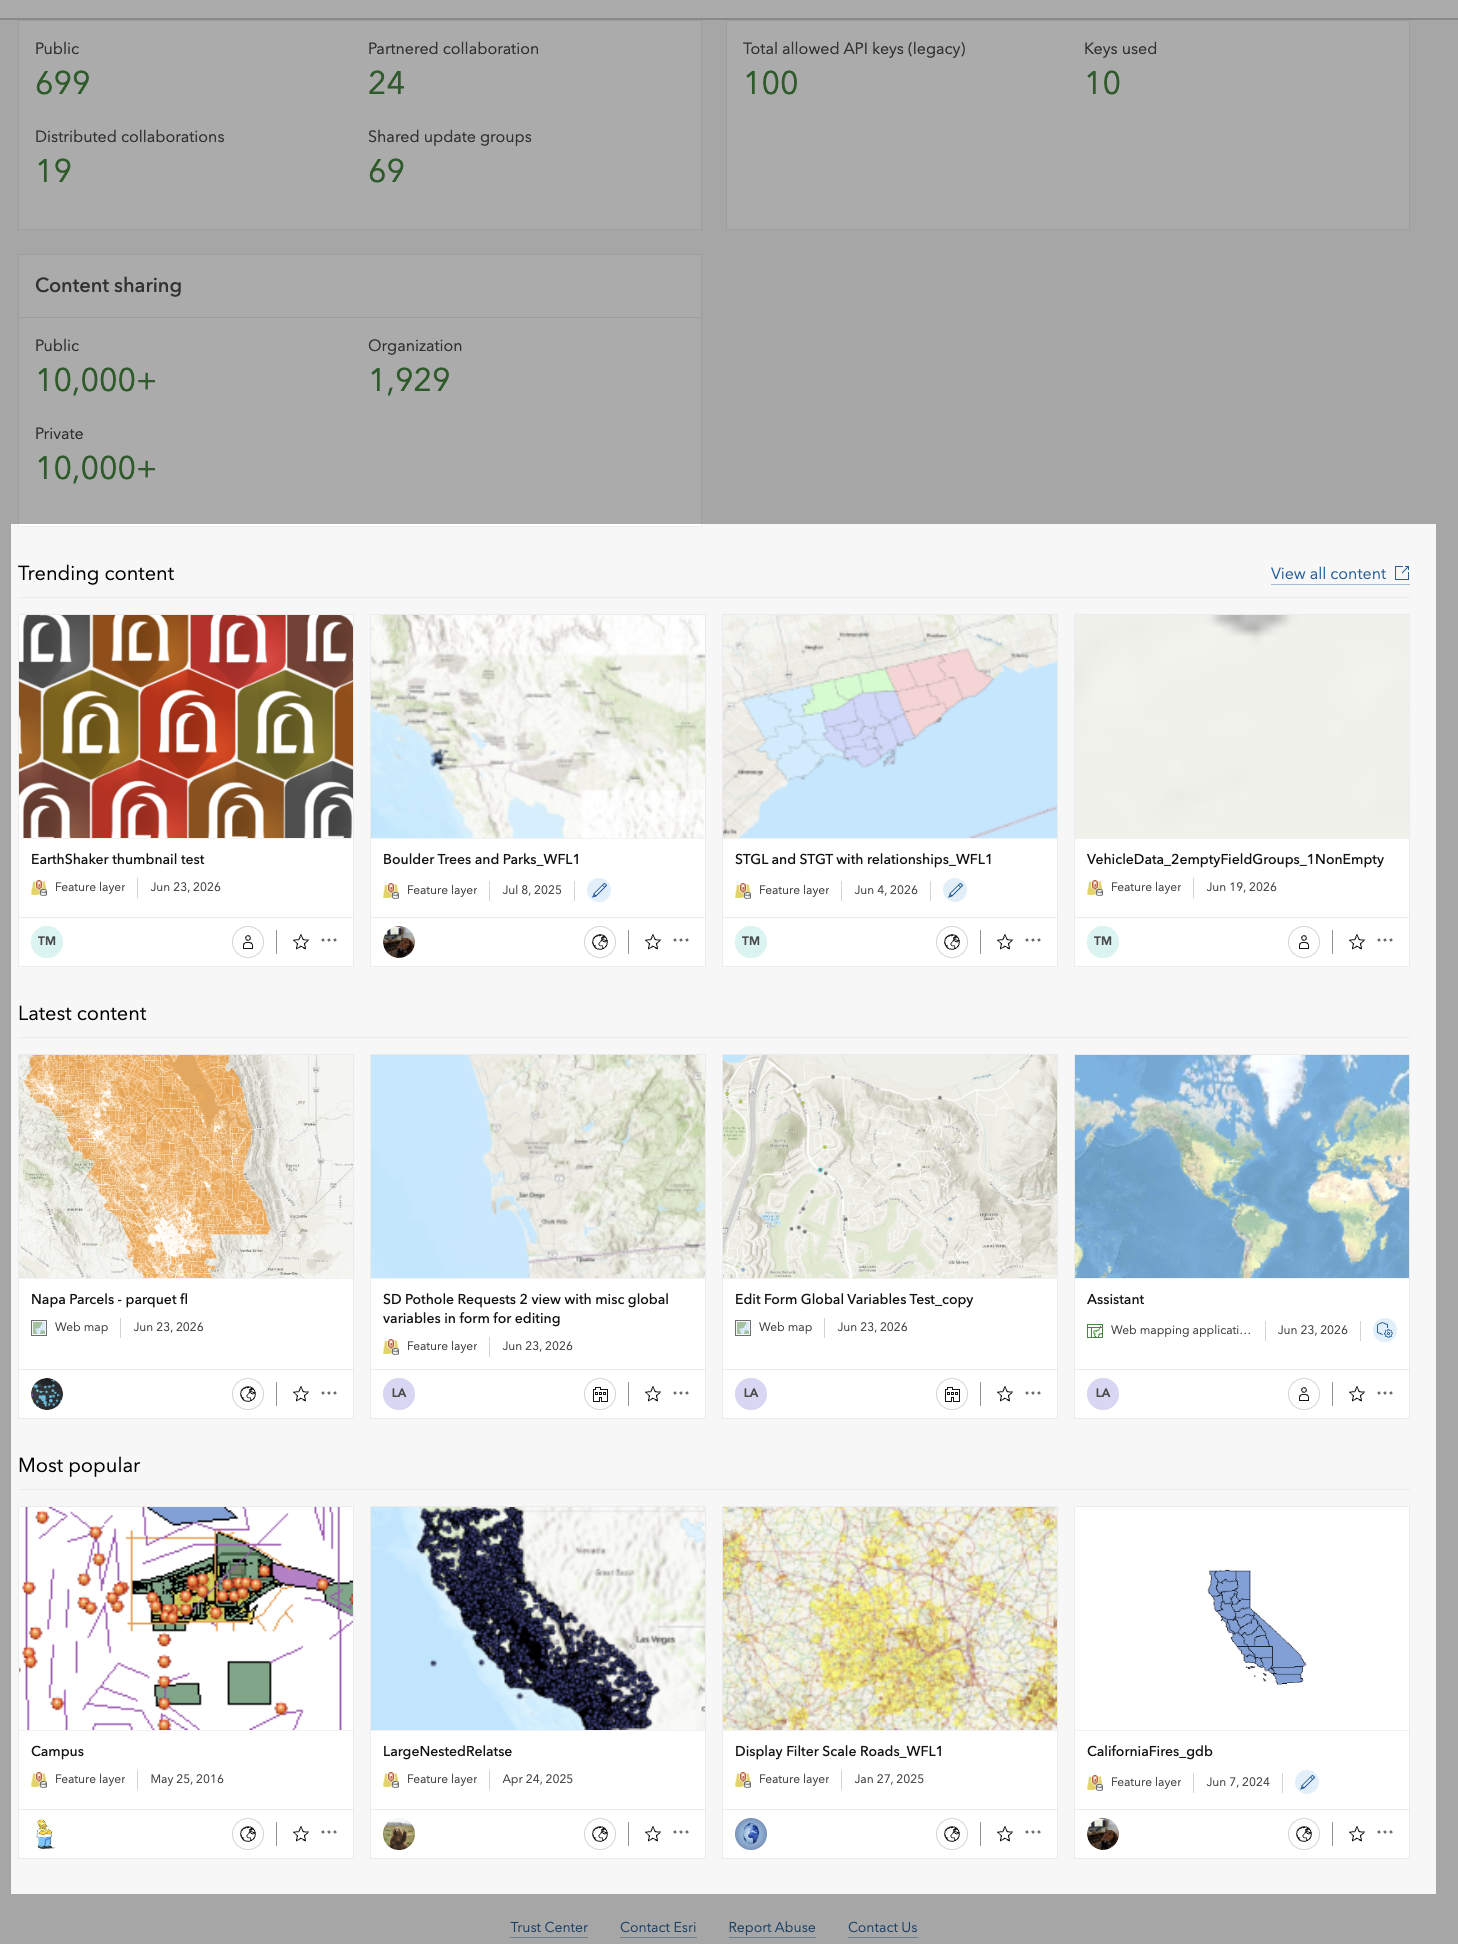
- Trending & Popular Content: Trending and most popular content are now displayed at the bottom of the overview, making it easier to spot high-impact items.
Usability Enhancements
If you’ve already been using the new Status dashboard, you’ll notice several enhancements designed to improve usability, reporting, and overall visibility into organizational activity. For organizations transitioning from the Legacy dashboard, these updates bring the capabilities you rely on today while introducing new tools and insights to help you better monitor and manage your ArcGIS Online environment.
Improved Dashboard Summary Experience
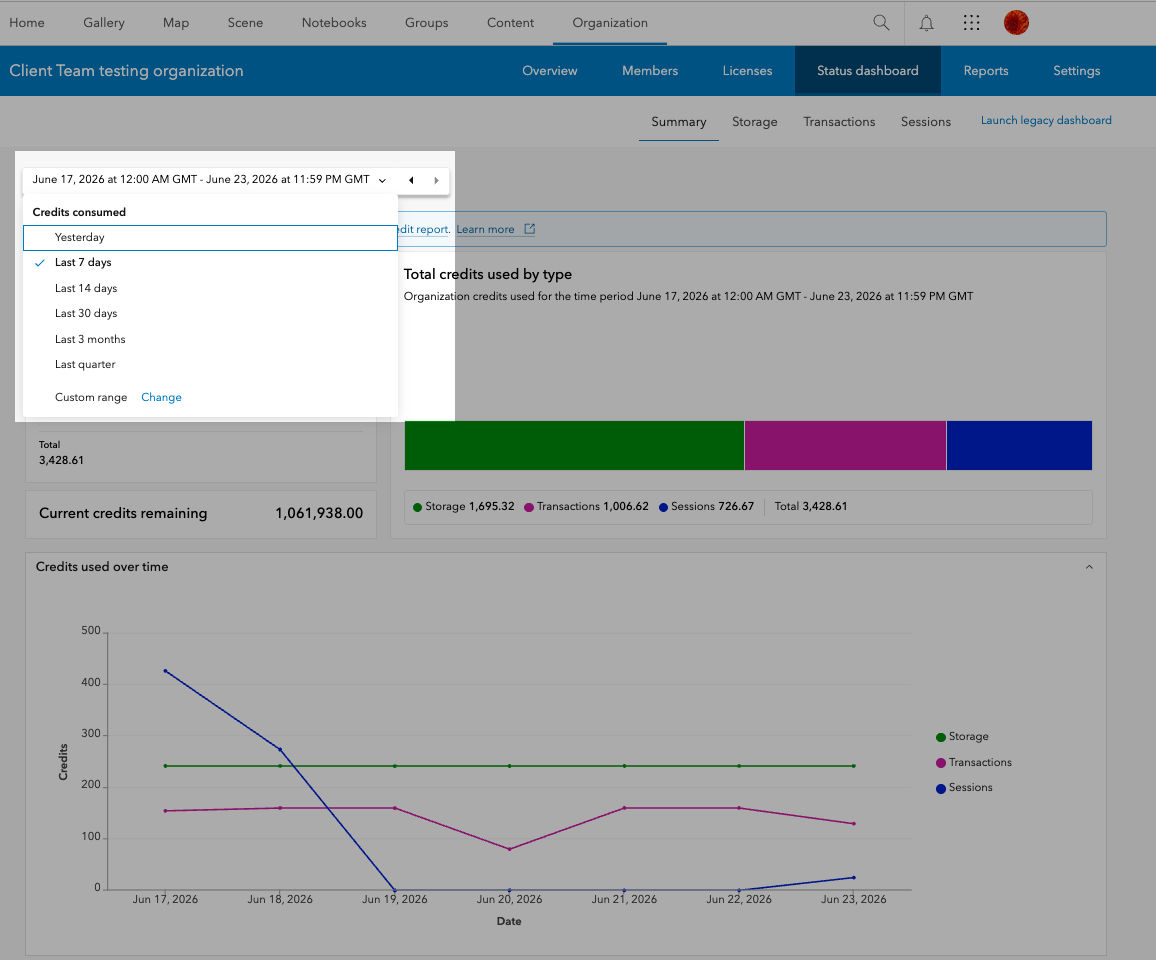
The Summary tab provides a high-level summary of your organization’s total credit consumption for the selected date range with enhanced visuals and breakdowns making it easier to spot trends in credit consumption over time. You’ll also find insights such as:
- Trend of credit consumption for each category (Storage, Transactions, and Sessions)
- Items using the most storage credits
- Members using the most credits for transactions and sessions
Building on these insights, several enhancements have been introduced to improve visibility and usability:
- Improved date picker and navigation: The date picker is now more intuitive and occupies its own line, saving space and improving navigation.
- More visibility: The date picker remains visible as you scroll, making it easier to adjust time ranges on the fly. You can use the listed date ranges like “Last 7 days,” “Last 30 days” or “Last quarter”. You can also select a custom range using the “daily”, “weekly” or “monthly” data aggregation. Once you set the data aggregation by days, weeks or months, the left and right arrows beside the date picker help you navigate the selected date duration forward and back.
More Detailed Storage Reporting
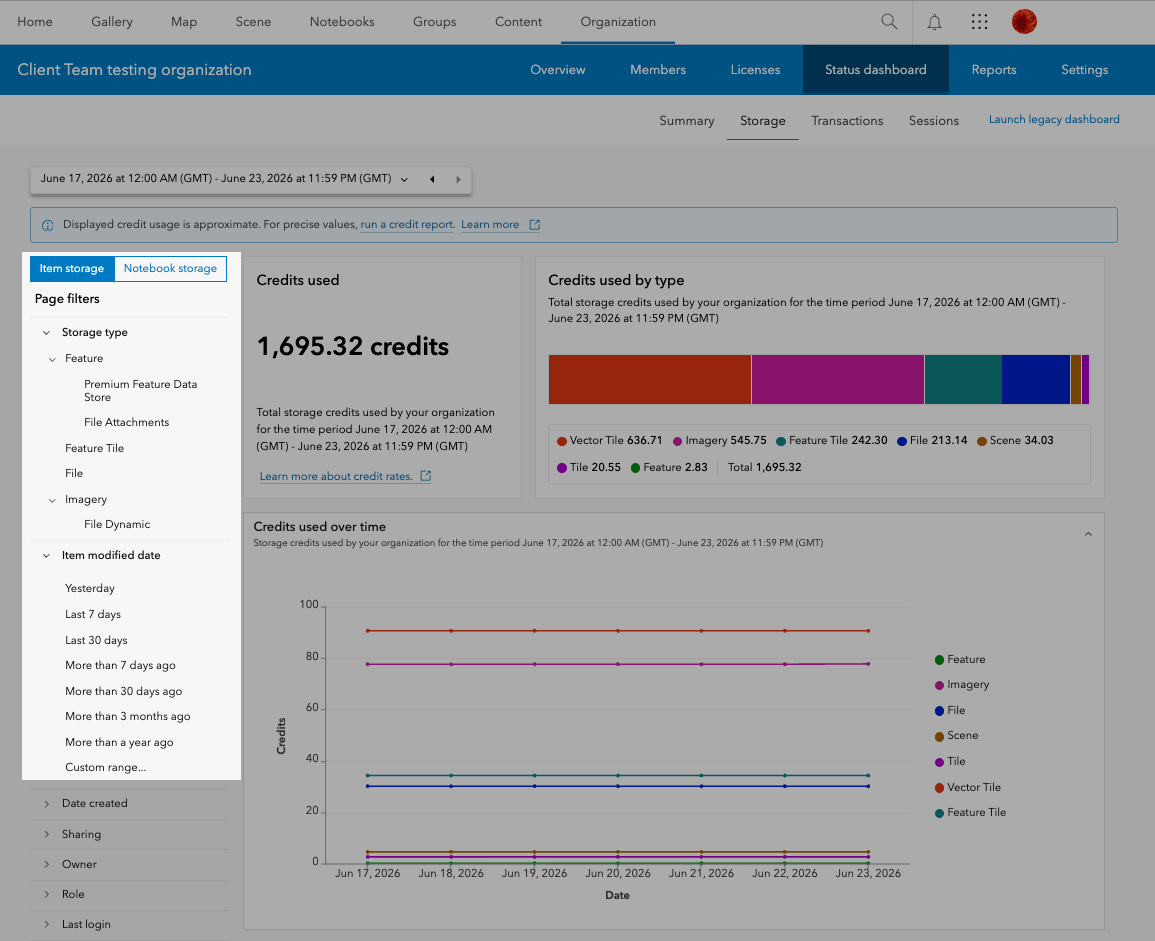
The Storage tab provides insights into how storage credits are consumed across your ArcGIS Online organization. Storage is organized into item storage, such as hosted feature layers and other content, and notebook storage for notebook-specific files and outputs, making it easier to monitor and optimize usage for different workflows. Administrators can view the members and items consuming the most storage credits in the selected time period, helping identify opportunities to optimize storage usage and manage organizational resources more effectively.
This release introduces several enhancements that provide greater visibility into storage credits consumption:
- Fine-grained storage filters – Storage types are further broken down into premium feature data store, file attachments, dynamic imagery, and tiled imagery, allowing for more precise monitoring under Item Storage.
- Modified date filters – Easily identify items that haven’t been updated in more than 7 days to more than a year ago, aiding in content cleanup and management.
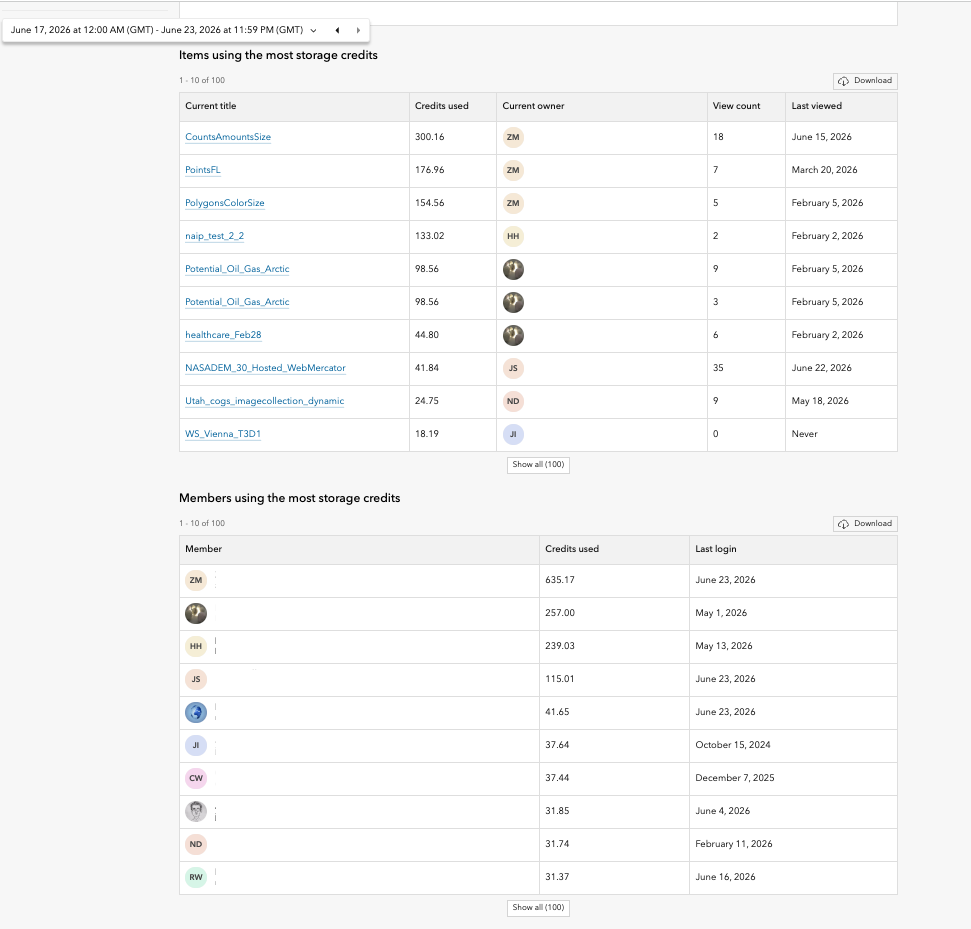
- Expanded top consumers reporting – View up to 100 members whose items collectively consumed the most storage credits during the selected time period, as well as the top 100 individual items consuming the most storage credits.
- Export storage insights – Download the top members and top items tables as CSV files for further analysis, reporting, and record keeping.
Expanded Transaction Analysis
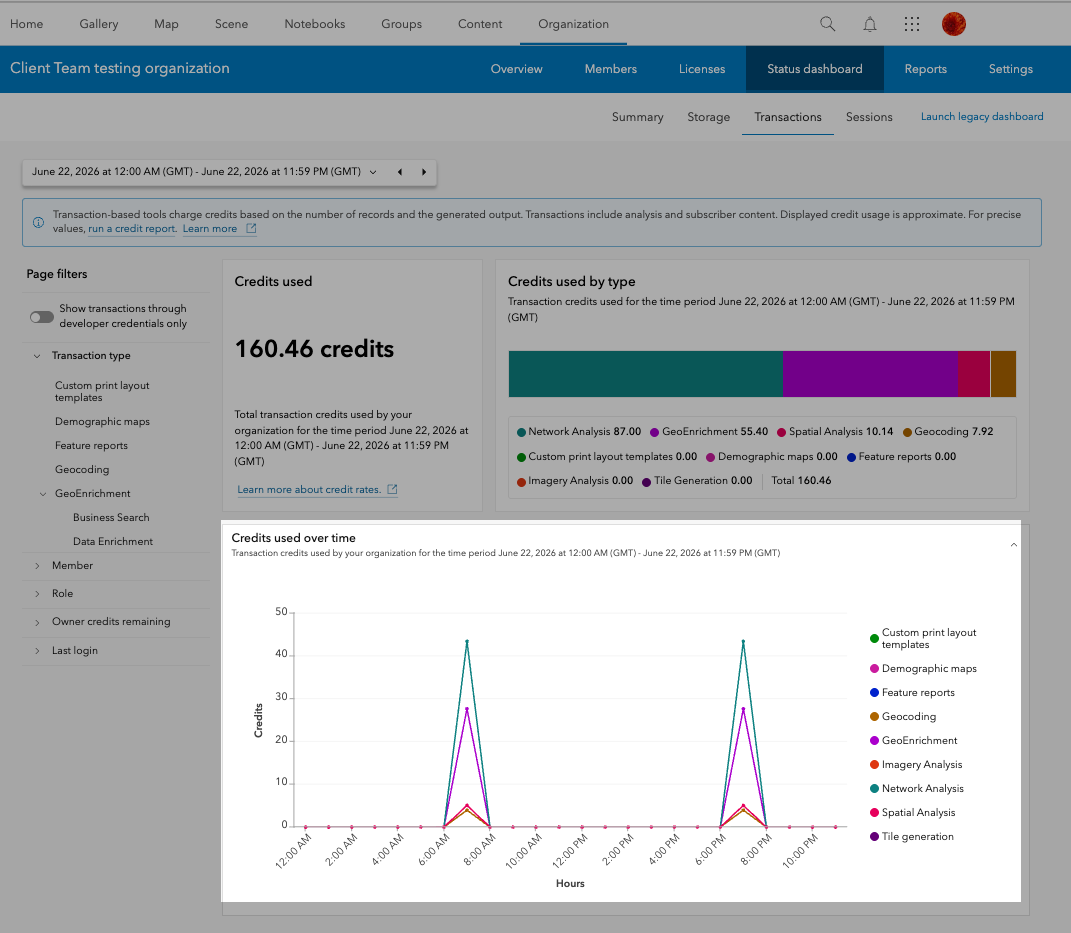
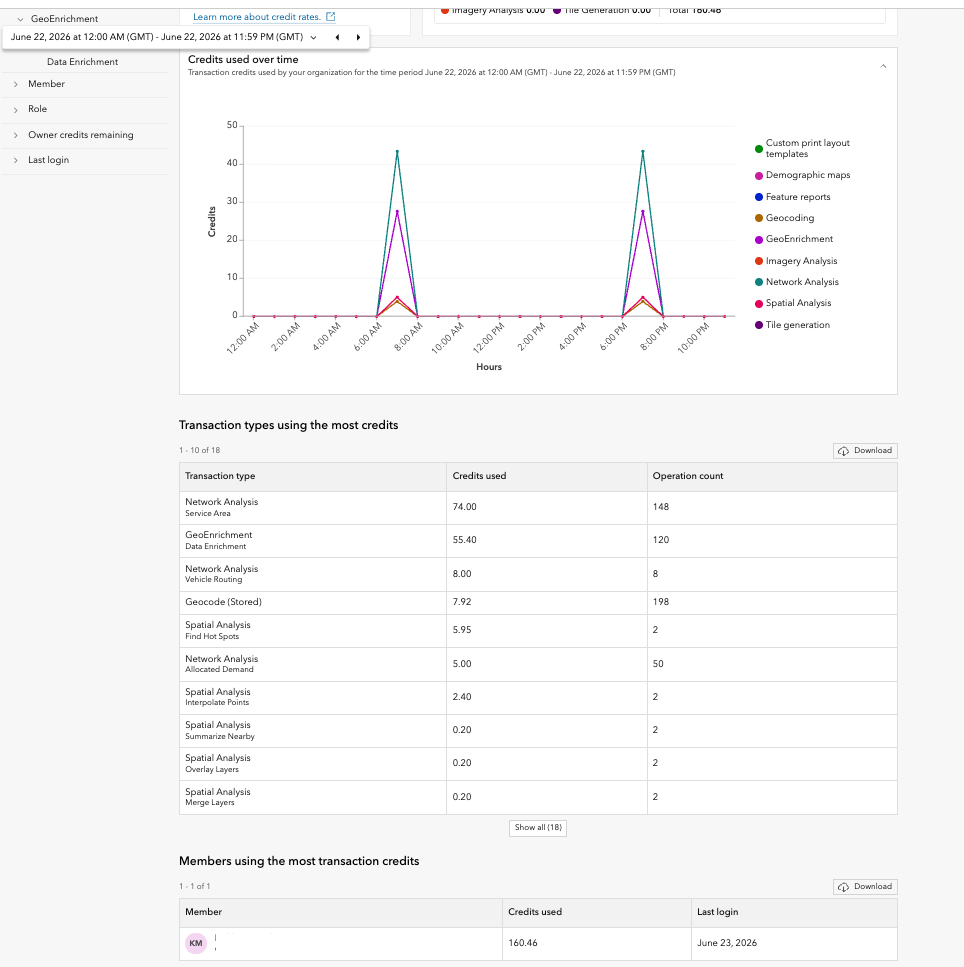
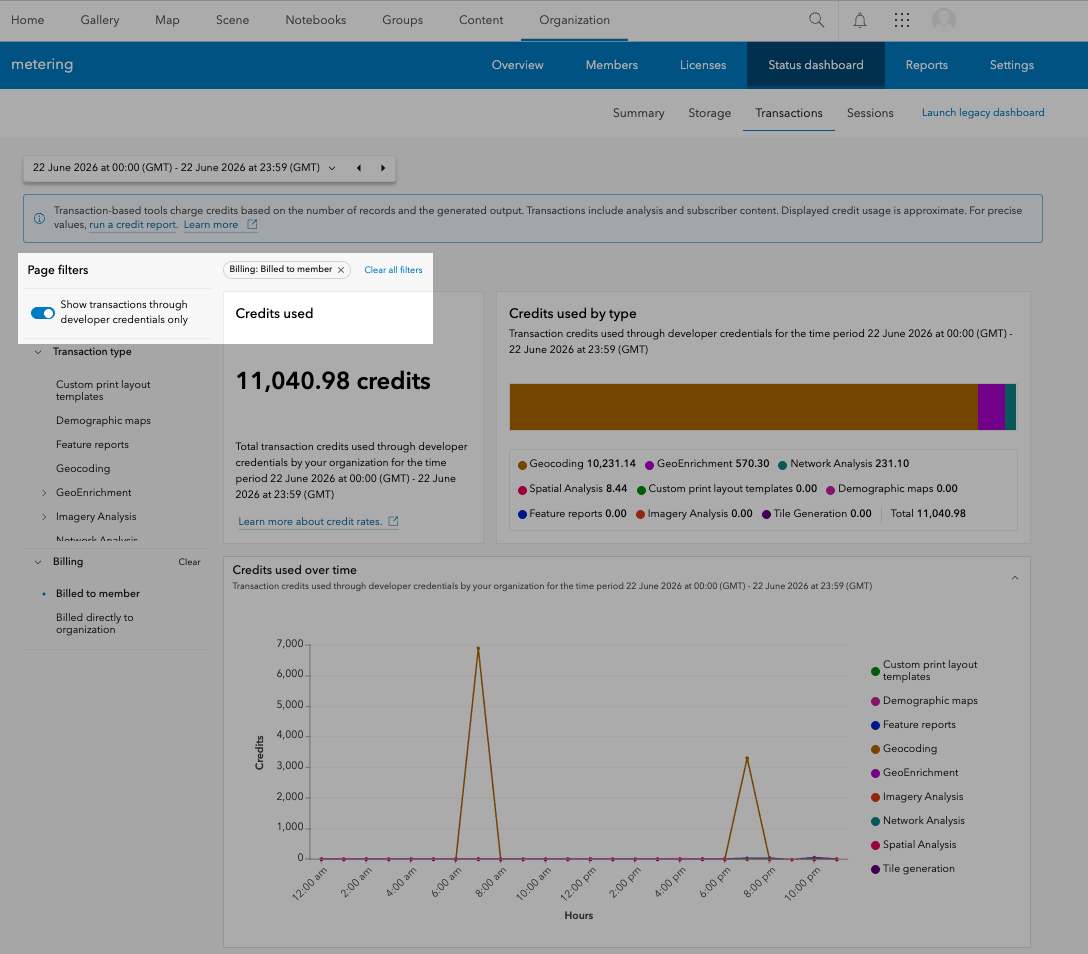
The Transactions tab provides insights into credit consumption from transaction-based services such as Geocoding, GeoEnrichment, Image Analysis, and Spatial Analysis. Administrators can monitor how credits are consumed across different transaction categories and identify the members, applications, and workflows driving usage within their organization. For more information about credit consumption when using analysis tools, check out Understand credits for spatial analysis.
This release introduces several enhancements that provide greater visibility into transaction activity and credit consumption:
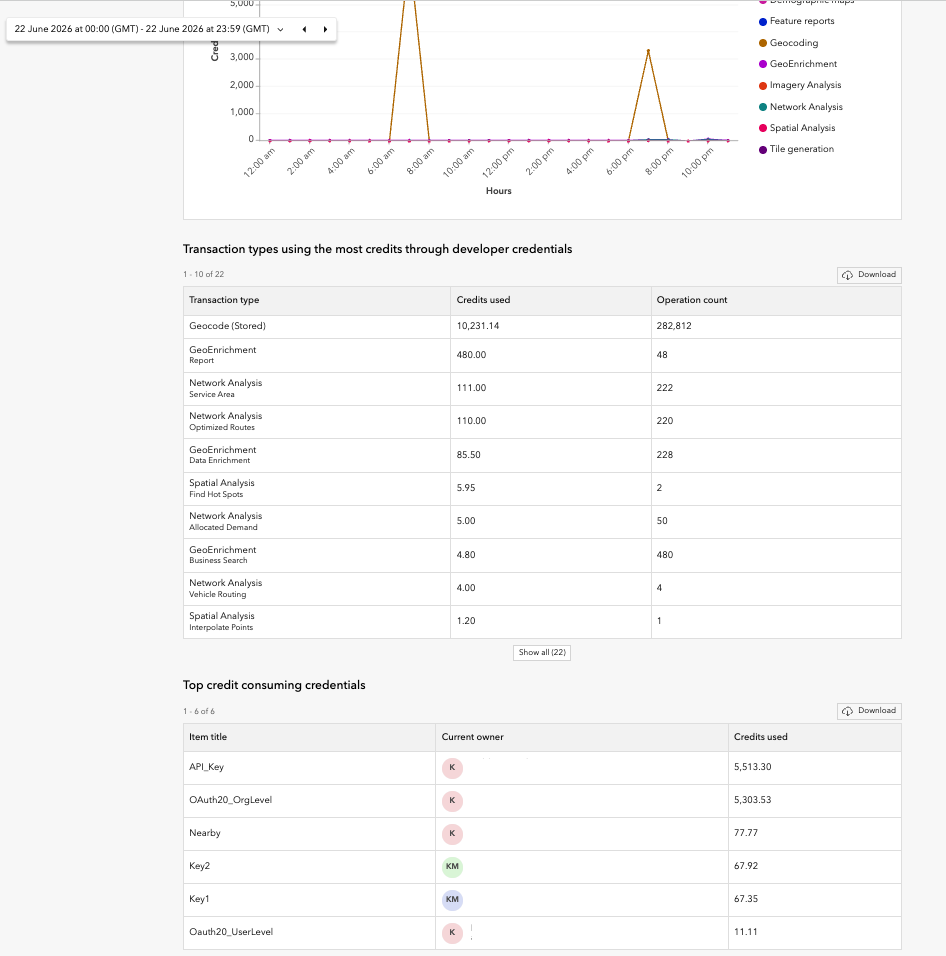
- Developer credential tracking – Analyze credit consumption associated with developer credentials and distinguish between member-billed and organization-billed activity.
- Expanded transaction filters and drill-downs – Explore transaction activity in greater detail across categories such as GeoEnrichment, Imagery Analysis, Spatial Analysis, and other transaction-based services.
- Hourly aggregation for recent activity – Analyze transaction usage by hour for the previous three days, including yesterday and the two preceding days, to better understand recent usage patterns and investigate activity spikes.
- Expanded top consumers reporting – View up to 100 members whose items collectively consumed the most transaction credits during the selected time period, along with the top 100 transaction types consuming the most credits.
- Export transaction insights – Download transaction tables as CSV files for further analysis, reporting, and auditing.
Enhanced Sessions Monitoring
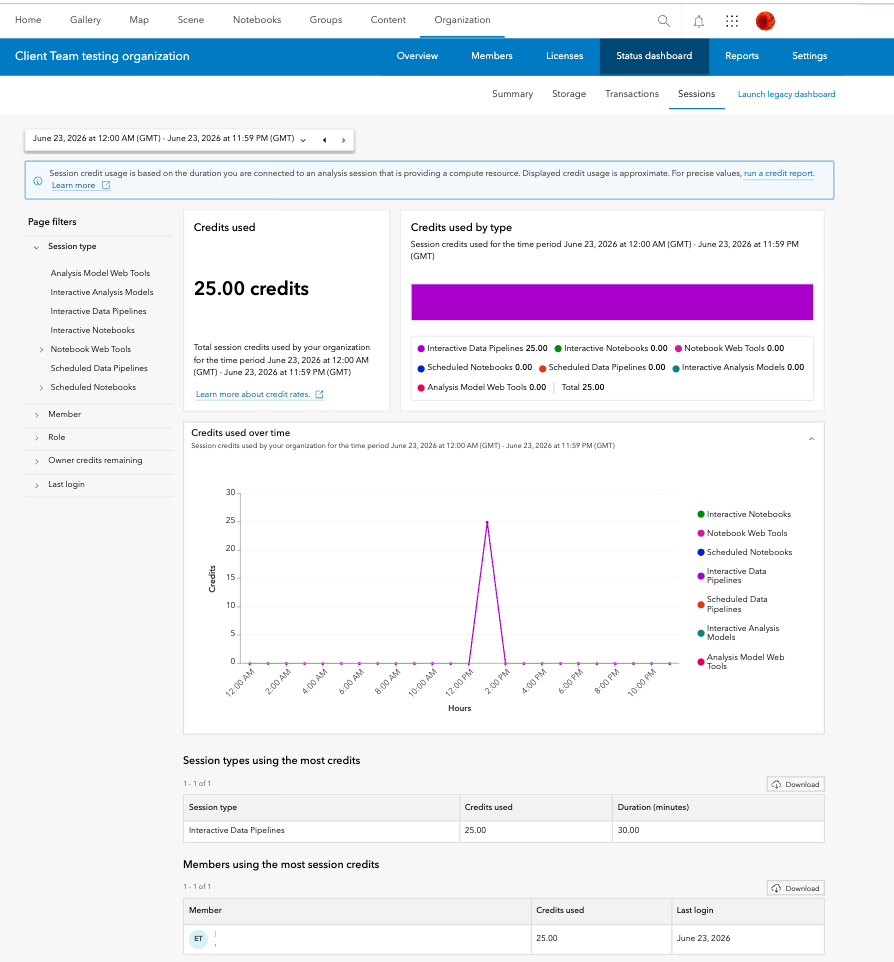
The Sessions tab displays the organization’s credit consumption by sessions. Session credit usage is based on the duration you are connected to an analysis session that is providing a compute resource. Administrators can monitor session activity across their organization and identify the members and session types consuming the most credits.
This release introduces several enhancements that provide greater visibility into session activity and usage patterns:
- Enhanced filtering and drill-down capabilities – Explore session activity in greater detail with additional filtering options and deeper analysis across session types such as Notebook Web Tools and Scheduled Notebooks.
- Hourly aggregation for recent activity – Analyze session usage by hour for the previous three days, including yesterday and the two preceding days, making it easier to investigate usage patterns and activity spikes.
- Expanded top consumers reporting – View up to 100 members whose items collectively consumed the most session credits during the selected time period, along with the top 100 session types consuming the most credits.
- Export session insights – Download session tables as CSV files for further analysis, reporting, and auditing.
Feature comparison of the Legacy and New Status dashboard
| Feature | Legacy dashboard | New Status dashboard |
|---|---|---|
| Category | Storage
Analytics (transactions based) Subscriber Content Published Content Analytics (duration based) |
Storage
Transactions Transactions Transactions Sessions |
| Data availability | From the beginning of the last calendar year | From October 1, 2025 |
| Max data visualization range | From the beginning of the last calendar year | From October 1, 2025 |
| Date time aggregation logic | Excludes the end date (from 12:00 AM on the start date to 12:00 AM on the end date GMT) | Includes the entire end date (from 12:00 AM to 11:59:59 PM GMT) |
| Dashboard data update frequency | Every hour | Once a day, after the end of the GMT day |
| Dashboard reporting level | Organization level only | Organization, item and member level |
Why These Changes Matter
The new Status Dashboard delivers a modern, powerful, and user-friendly experience for monitoring your organization’s activity with expanded access, improved features, and enhanced usability including:
- Better Content Management: Administrators can now easily identify and clean up unused items, optimizing storage and credit usage.
- Improved Monitoring: Granular filters and hourly data provide actionable insights for troubleshooting and planning.
- Seamless Transition: By matching the capabilities of the Legacy dashboard, as well as adding extra enhancements, the new Status dashboard ensures users don’t lose critical functionality as they migrate.
We hope you take this opportunity and explore the new Status dashboard and provide feedback to ensure it meets your needs.
Thank you to the following teammates for their contributions to the blog article: Umang Shah, Mike Minami and Shane Eaves.

Is there a way to view more than the top 100 individual items consuming the most storage credits?
Will the functionality to monitor app usage, as in the legacy dashboard, also be implemented in the new?