The Organization Status Dashboard in ArcGIS Online delivers a modern interface and enhanced features that give organization administrators better tools for tracking organization’s activity, usage, and credit consumption- making it intuitive and efficient to manage and optimize resources. If you’re currently using the Legacy dashboard, this guide will walk you through the transition process, highlight the key differences, and help you make the most of the Status dashboard experience.
Why use the Status Dashboard?
The Legacy dashboard aggregated data hourly, but only at the organization level. This provided high-frequency updates but had limited granular and actionable insights for drilling down into specific items or members. The Status dashboard addresses these limitations by introducing enhanced features like:
- Streamlined User Interface
- Enhanced Data Visualizations
- Additional filtering and data exploration options
- Credits consumed for storing items by top members
- Individual items consuming the most credits
-
Detailed Storage Reporting
-
Member-Level Visibility
Using the Status dashboard ensures your organization benefits from these enhancements and stays aligned with Esri’s evolving platform.
Key Changes and Improvements
Here are some of the areas that have been improved in the Status dashboard:
Streamlined User Interface
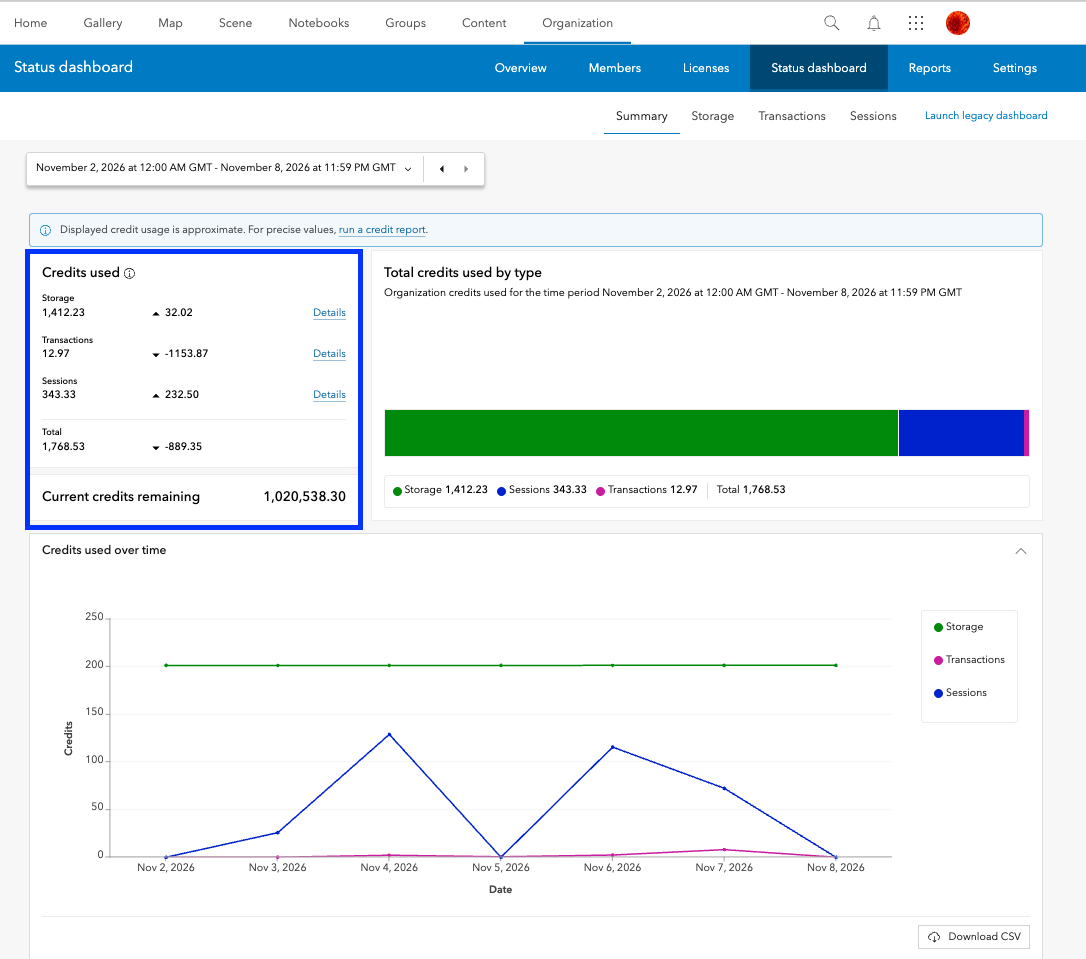
The Status dashboard features a modern interface with improved navigation and easier access to detailed credit usage information.
The Summary tab provides an overview of credit consumption across Storage, Transactions, and Sessions. Now, it also includes a change indicator that shows the increase or decrease in credits consumed compared to the previous equivalent time period. For example, when viewing the last 7 days, administrators can quickly see how credit usage has changed compared to the preceding 7 days. Selecting Details for any category takes you directly to the corresponding tab, where you can explore usage information in greater detail.
Together, these capabilities make it easier to monitor credit usage trends and move from an organization-wide overview to more specific insights without navigating through multiple reporting pages.
Enhanced Data Visualizations
The Summary tab features improved bar chart and line charts, where each chart component corresponds to a specific category – such as Sessions, Transactions, or Storage – displayed as individual tabs. You can simply click on any component of the bar chart to be automatically navigated to the relevant tab for that category. The line chart shows the trend of credit consumption for each category.
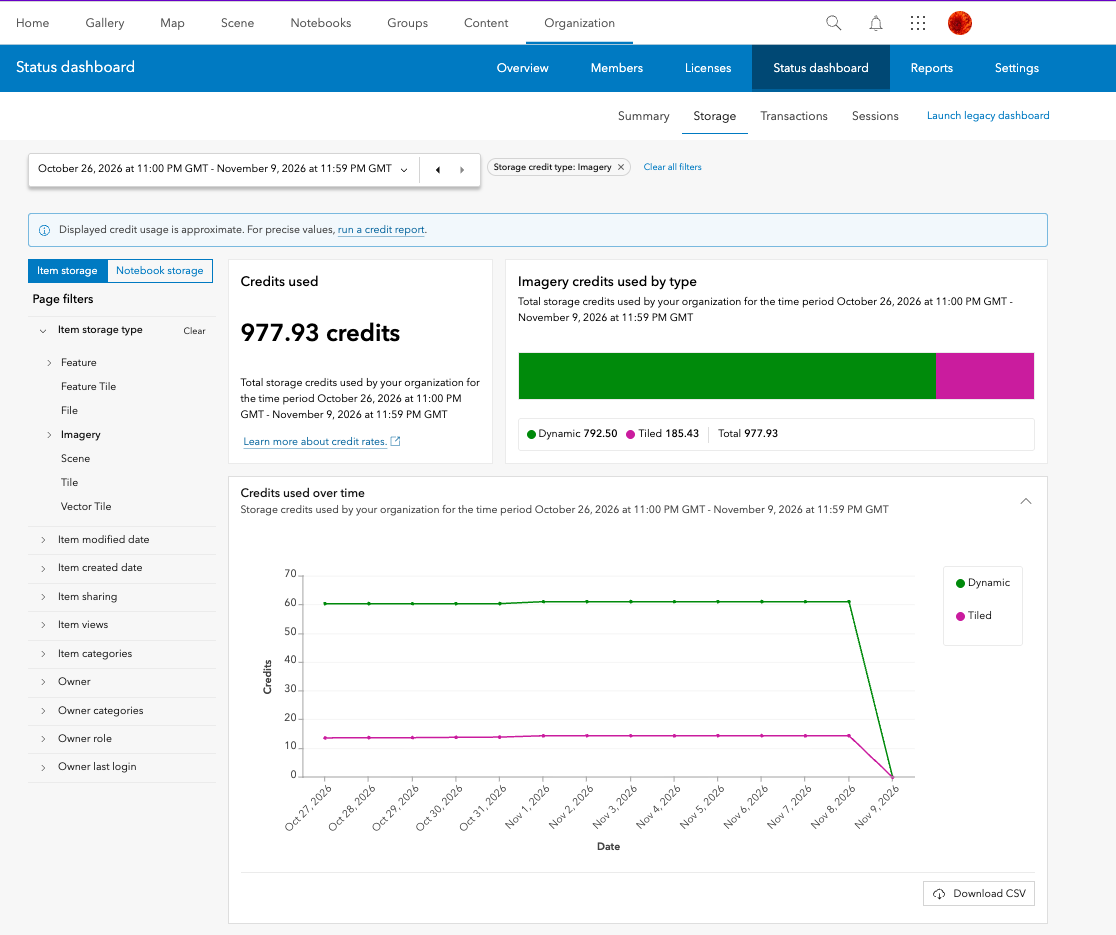
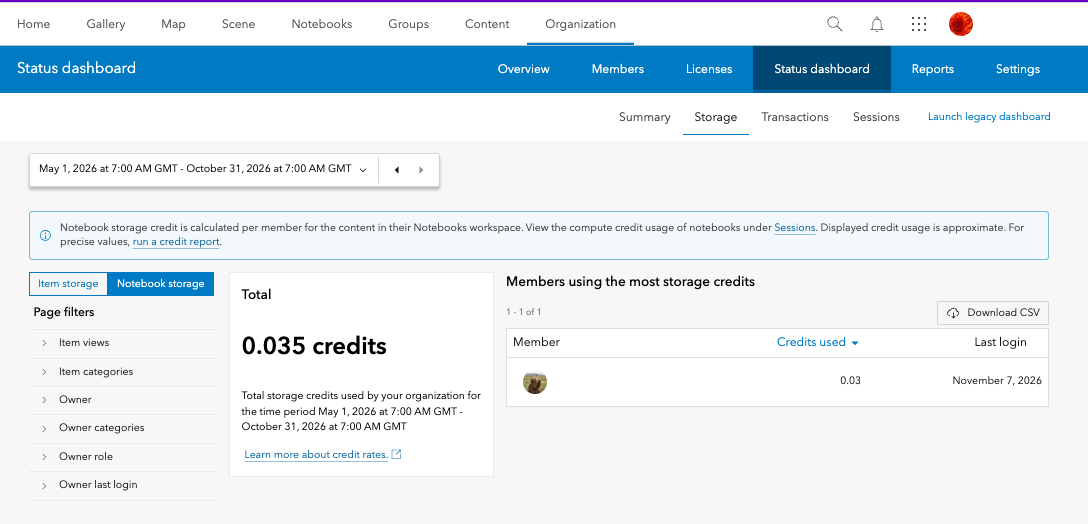
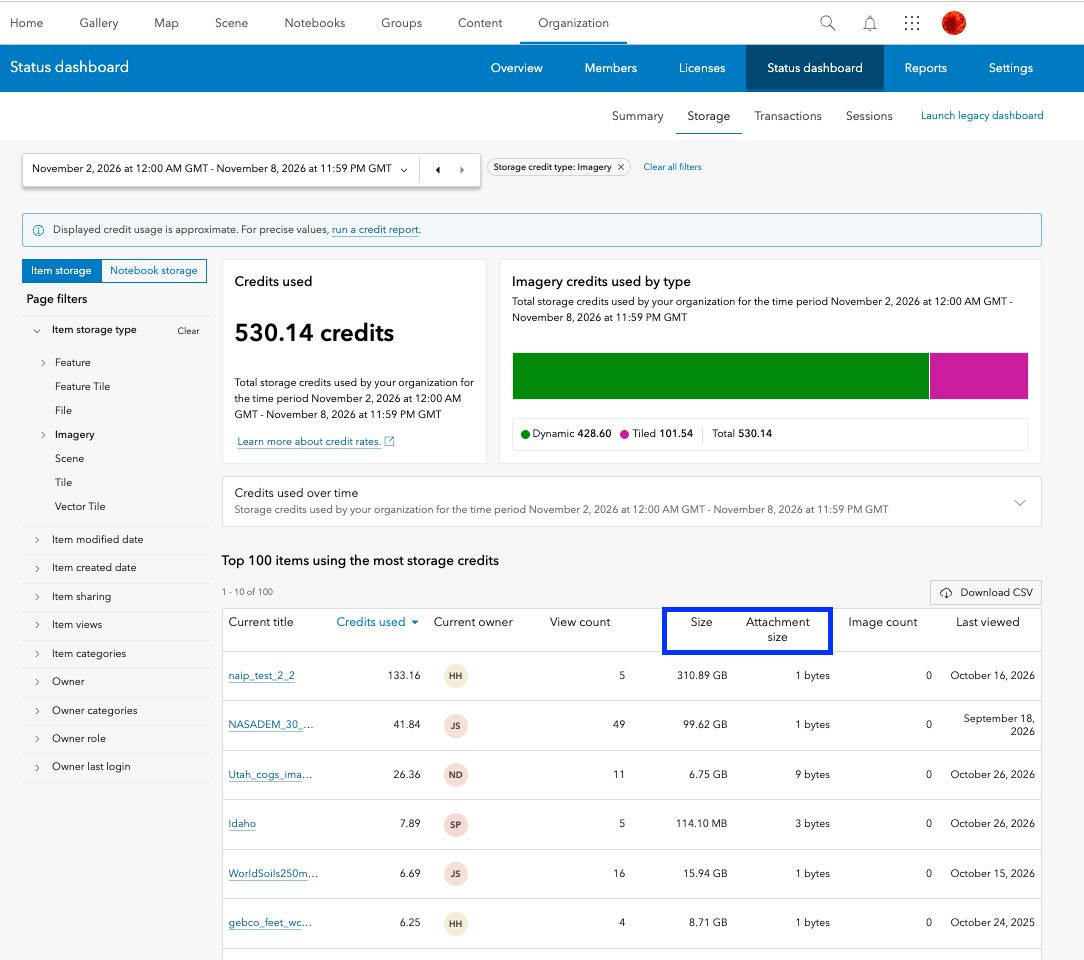
Within the Storage tab, each component of the bar and line charts represent the credits consumed for the storage of items of different types like Feature, Imagery, Tile, etc. Clicking on a type from the side panel or on the chart component filters the table showing top credit consuming items of that type. A table showing top credit consuming members who owned the items of that type are also shown.
Within the Transactions and Sessions tabs, each component of the bar and line charts represent the credit consumption for different types or operations like Imagery Analysis, GeoEnrichment, Spatial Analysis, etc. Clicking on an activity type from the side panel or on the chart component filters the table showing top credit consuming activities within that type. The members who consumed the most credits performing those activities are also shown.
Additionally, you can seamlessly switch between different types of transactions or sessions on the charts and observe trends over time, making the analysis process both streamlined and insightful.
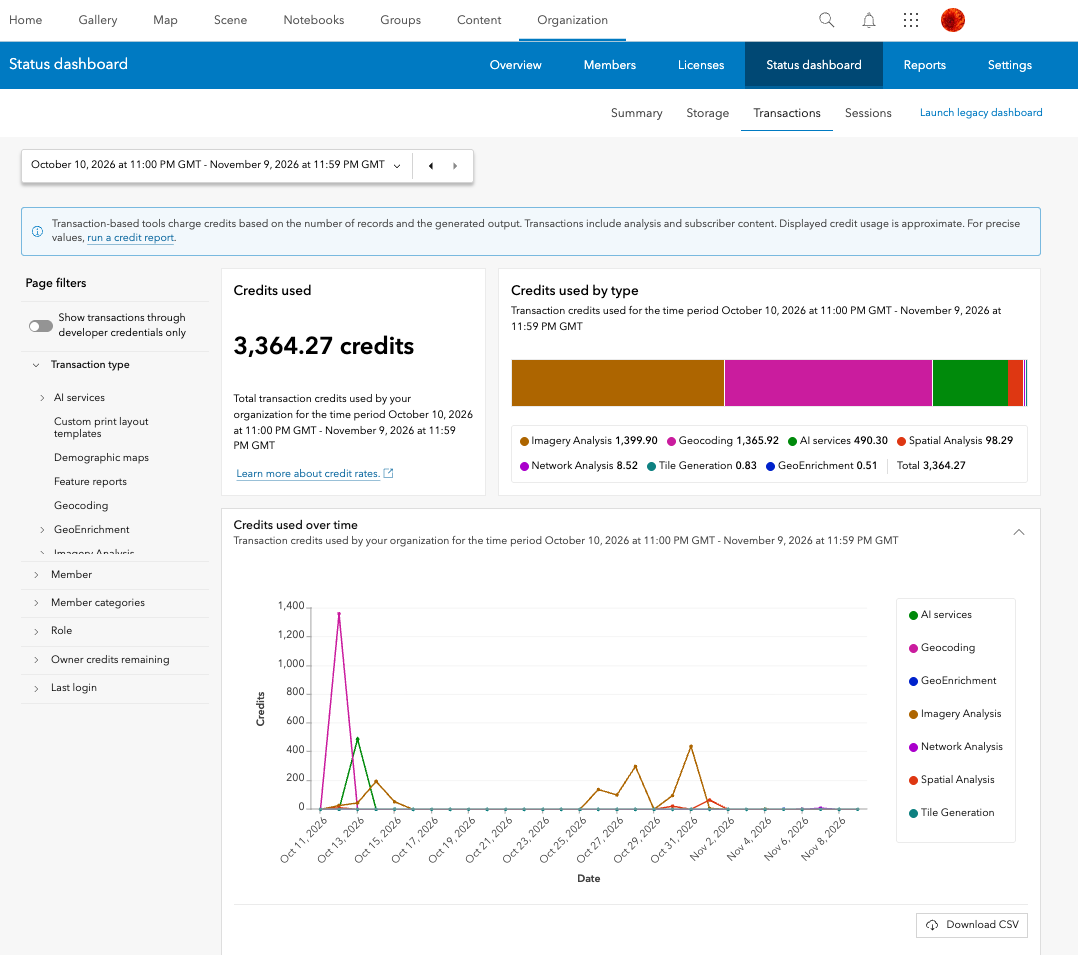
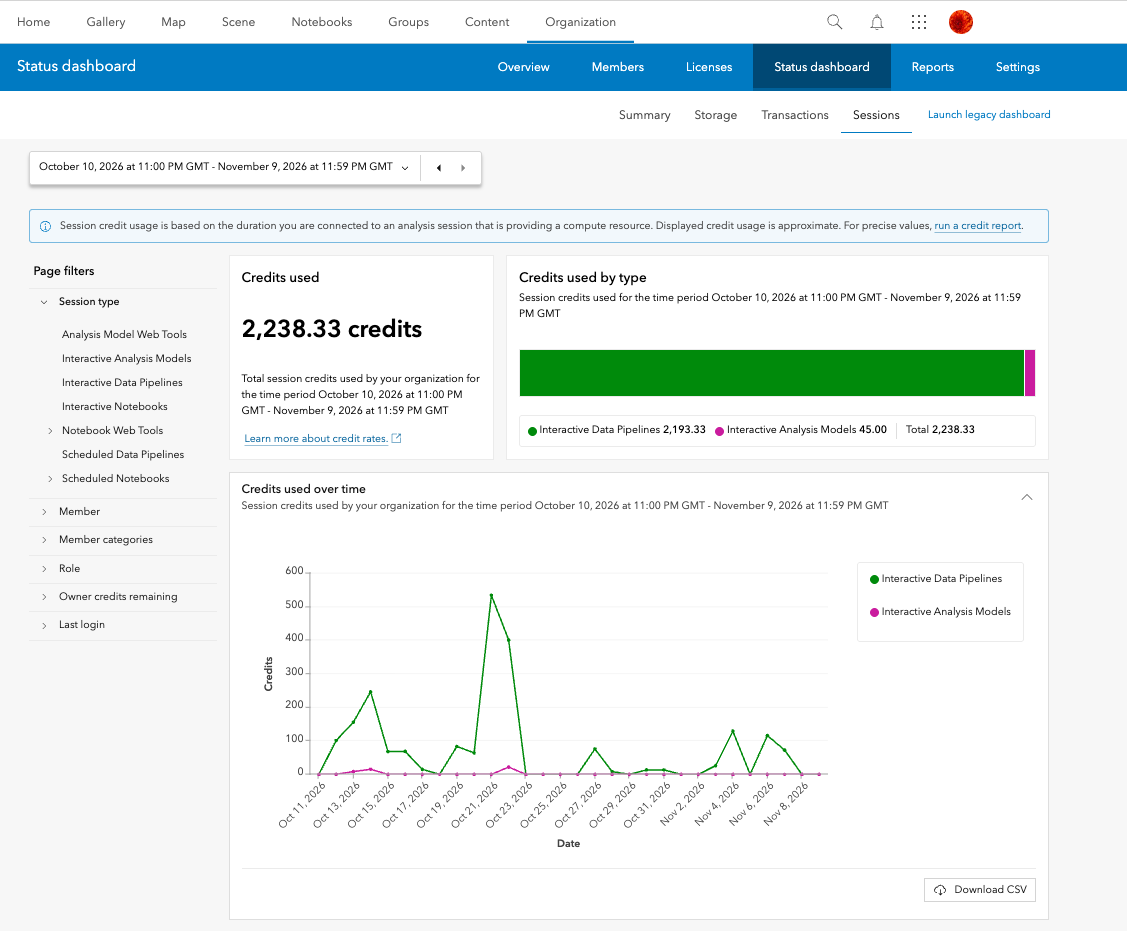
With the latest update, line charts now include a Download CSV option, allowing users to export chart data for further analysis and reporting, separate from administrative reports. Additionally, storage aggregation tables now display item size and attachment size separately, providing greater visibility into storage consumption.
Additional filtering and data exploration options
The Status dashboard provides further drill-down capabilities into the credit consumption for each category:
| Category | Type filters |
|---|---|
| Storage | Item Storage – Storage type like Feature, Imagery, File, etc., Item views, Item categories, Owner categories, and more..
Notebook Storage – Owner, Role, etc., Item views, Item categories, Owner categories, and more.. |
| Transactions | Transaction type like Geocoding, Spatial Analysis, Imagery Analysis, etc., Member categories, and more.. |
| Sessions | Session type like Interactive Data Pipelines, Interactive Notebooks, etc., Member categories, and more.. |
Frequently Asked Questions
Why do I see different credit values between the Legacy and Status dashboard?
As mentioned in this blog, the Legacy and the Status dashboard have different data aggregation methods, so this could cause a slight variation in credit reporting.
The Legacy dashboard lets me view historical credit use for the last year. Why does the Status dashboard only show historical use from October 2025?
The Status dashboard introduces more granular reporting which was not available in the Legacy dashboard before and hence, you can only see the new data from October 2025. The Legacy dashboard will continue to be available as well as the credit reporting tools.
The Legacy dashboard has categories for Analytics, Subscriber Content, and Published Content. Why can’t I see these in the Status dashboard?
As mentioned in this blog, all transaction-based analytics activities along with Subscriber and Published Content usage have been included in the Transactions category, while duration-based analytics activities have been included in the new Sessions category.
The Legacy dashboard contained summaries for Content, Apps, Members, and Groups. Will these eventually be included in the Status dashboard?
The Status dashboard is still evolving. The current version of the Status dashboard focuses on improved credit reporting. Information about Apps, Members, and Groups will be made available either in future versions of the new dashboard or elsewhere in the organization website.
Can individual members access the Status dashboard?
Yes. All ArcGIS Online members can access My Status Dashboard from their profile menu. The dashboard is automatically filtered to display usage associated with the signed-in member, providing a personalized view across Storage, Transactions, and Sessions.
Can I download chart data from the Status dashboard?
Yes. Line charts include a Download CSV option that allows users to export the chart data in a tabular format for further analysis and reporting. This option is separate from administrative reports.
Takeaway
Transitioning to the Status dashboard in ArcGIS Online unlocks a wealth of new features and provides a more intuitive monitoring experience for organization administrators. We hope you take this opportunity to explore and transition to the new Status dashboard.
Thank you to the following teammates for their contributions to the blog article: Umang Shah, Mike Minami and Shane Eaves.

Article Discussion:
2 responses to “Transitioning from the Legacy to the New Organization Status Dashboard in ArcGIS Online”
Leave a Reply
You must be logged in to post a comment.
It would be nice to be able to customize the granularity of the time scale for credit usage across different apps, especially apps and data sets that use live data streams, since credit consumption can be quite high for live data and its associated analytics.
Hi Alexandre,
Thank you for sharing this thoughtful feedback. We appreciate your interest in making the status dashboard more flexible and robust, especially for scenarios involving live data streams and analytics-heavy usage. This is a valuable perspective, and we’ll definitely take it into consideration as we continue improving the platform experience. To better understand your requirement, could you share a bit more about the scenario where you need a higher granularity than hourly (for example, live streaming data or near real-time analytics)? This will help us better evaluate how such flexibility could add value to different workflows.