The Organization Status dashboard introduced in the February 2026 ArcGIS Online update, gives administrators a comprehensive view of organizational activity, credit consumption, and content usage. It organizes credit usage into three key categories: Storage, Transactions, and Sessions, making it easier to track how resources are being used across the organization. With both summary-level trends and detailed usage information in one place, administrators can identify the content, members, and workflows contributing to credit consumption and make better-informed decisions about managing organizational resources.
Building on the improvements introduced in the June 2026 update, the latest enhancements focus on making the Status dashboard more flexible and accessible. Based on customers feedback, these updates introduce additional filtering options, clearer insights into credit usage and storage, CSV downloads for chart data, and a new My Status Dashboard experience that allows individual members to monitor their own usage.
The new Status dashboard is now the default experience for organizations. However, administrators can still access the Legacy dashboard by selecting Launch legacy dashboard, allowing them to explore the new experience while retaining access to familiar reporting tools during the transition.
Let’s take a closer look at the key improvements in the Status dashboard.
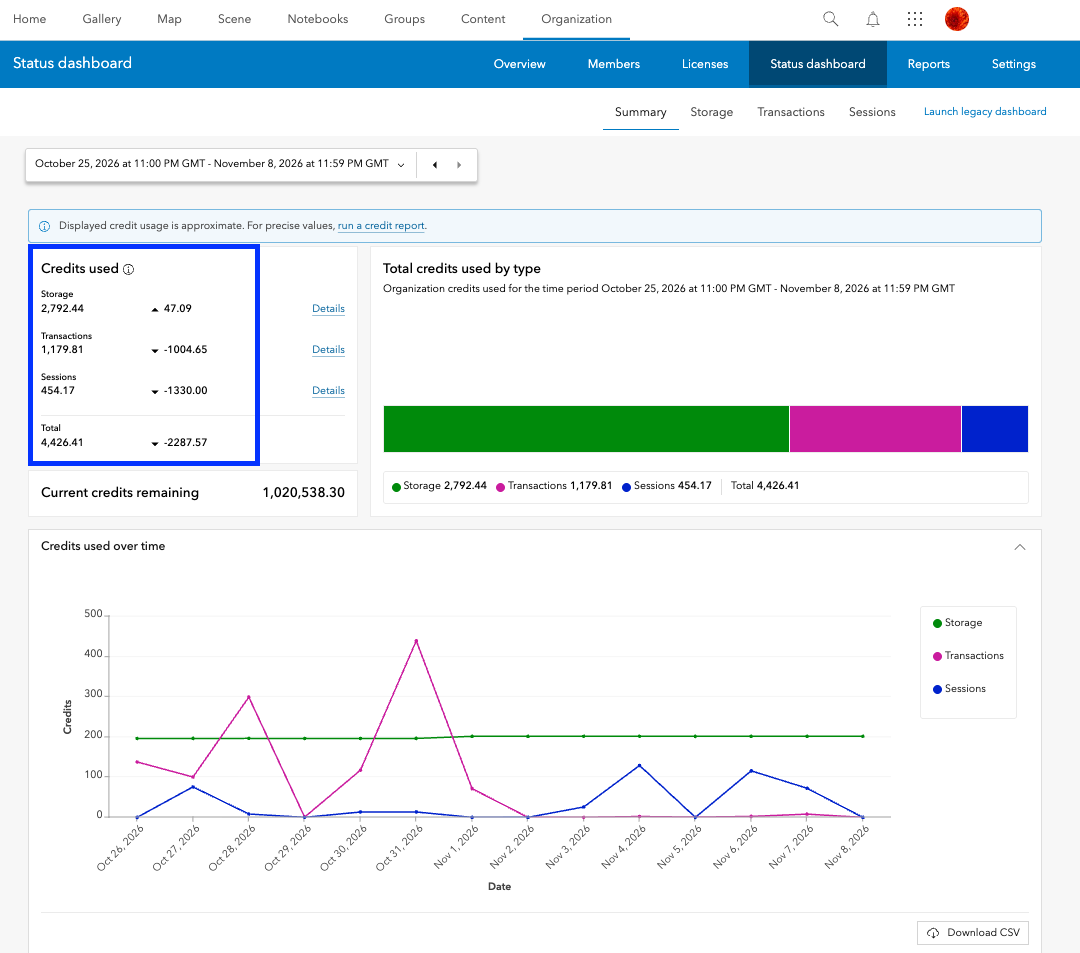
See how credit usage is changing over time
The Summary tab now includes a change indicator that compares credit usage with the previous equivalent time period. For example, if you are viewing the last seven days, the dashboard shows whether more or fewer credits were used compared with the seven days before that. This provides quick context around usage trends without requiring administrators to manually compare different reporting periods.
More ways to track credit consumption with filters
The Status dashboard now includes additional filters that help administrators track credit consumption across specific groups of content and members, providing a more focused view of how organizational resources are being used.
The new item views filter provides another way to evaluate content usage. For example, administrators can identify items that consume significant storage but receive relatively few views, helping them determine which items may need further review or management.
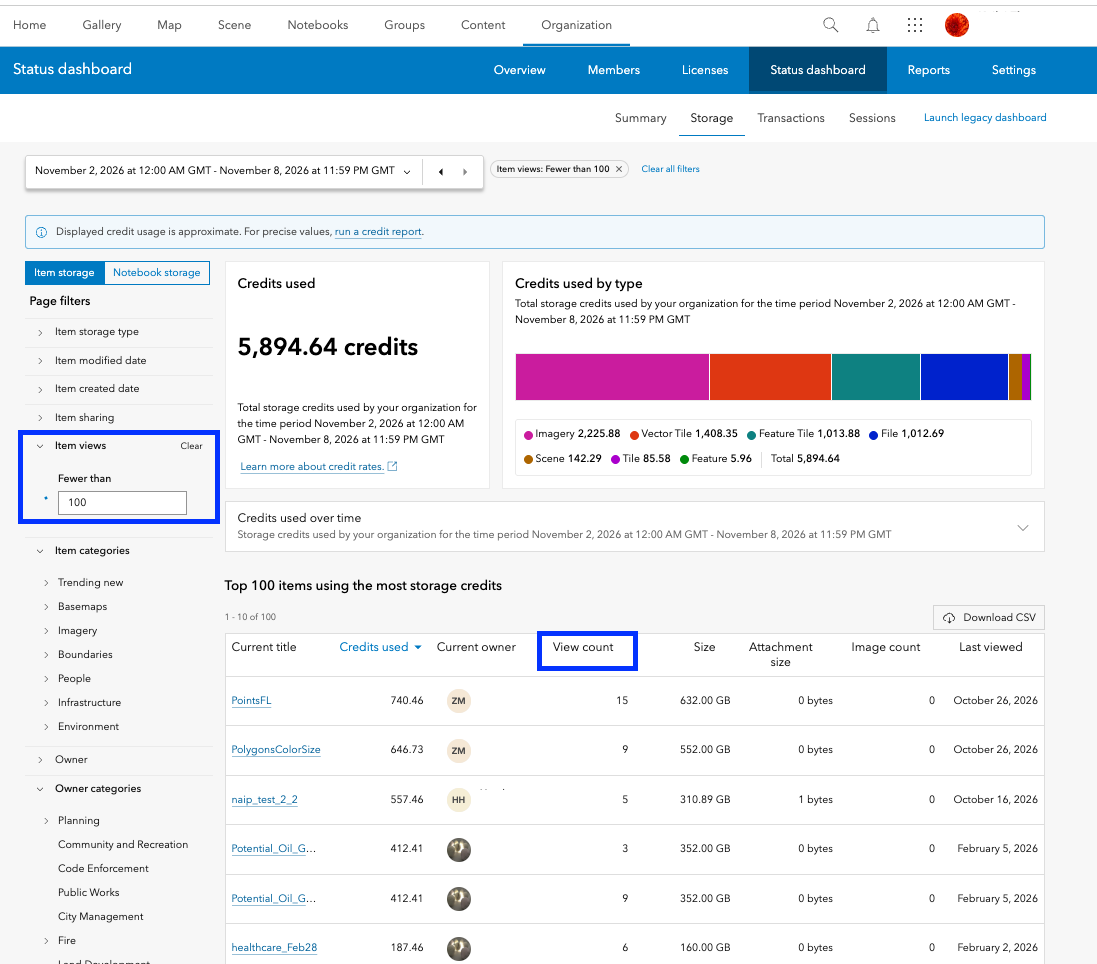
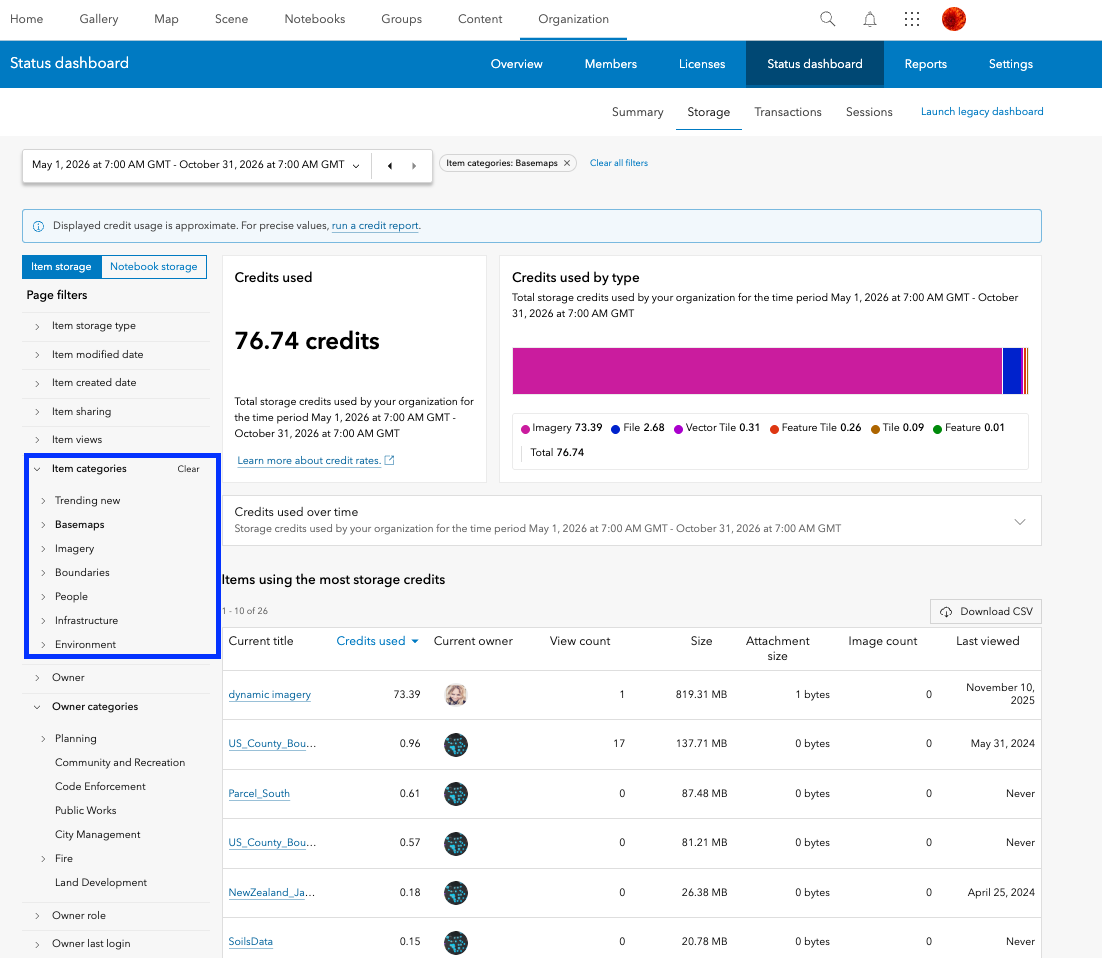
Organizations can use item categories to organize content by type, project, or purpose. In the Storage tab, administrators can filter by these categories to understand storage consumption for a particular collection of items, such as basemaps, imagery, or project-related content.
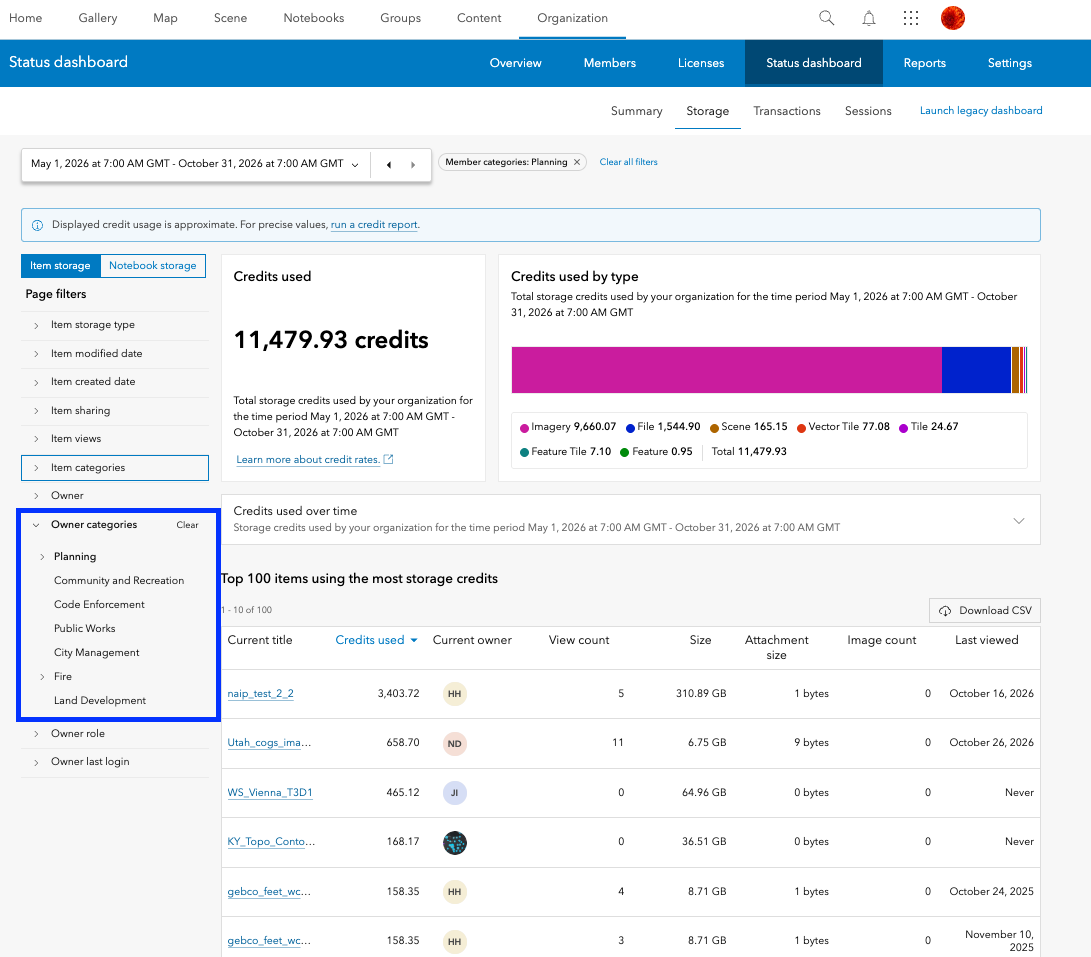
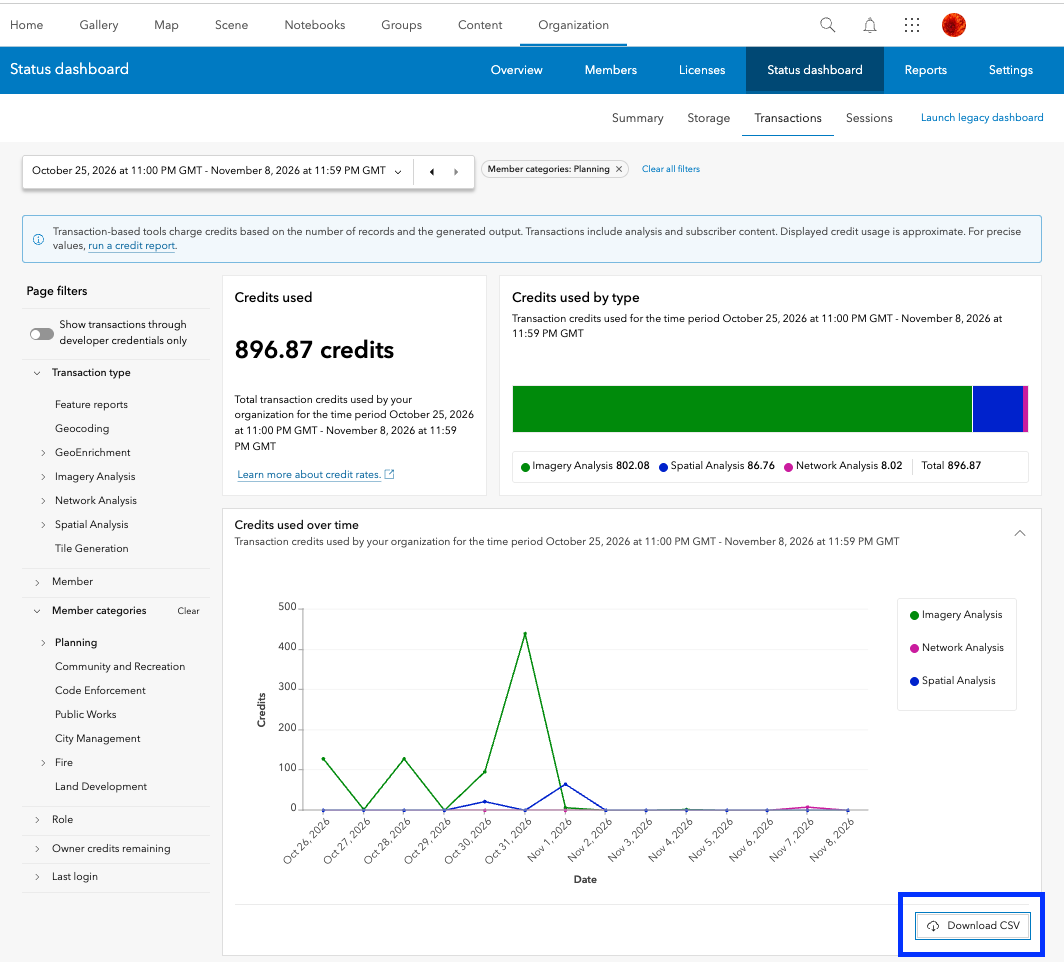
Similarly, member categories allow organizations to group members by department, team, or other organizational structure. Administrators can use these categories to understand and compare credit consumption across groups. For example, an organization with Planning, Community and Recreation, and Code Enforcement departments can track credit usage for each department to better understand how resources are being consumed.
In the Storage tab, this filter appears as Owner Categories, while member-category filtering is also available in the Transactions and Sessions tabs. Together, these filters make it easier to analyze credit consumption across different content collections and organizational groups without reviewing individual items or members separately.
Download chart data as CSV
Line charts in the Status dashboard now include a Download CSV option. The downloaded file contains the data represented in the chart, making it easier to work with the information in a spreadsheet or use it for additional analysis and reporting. This export is separate from administrative reports and is intended as a simple way to access the underlying chart data.
More detail about storage usage
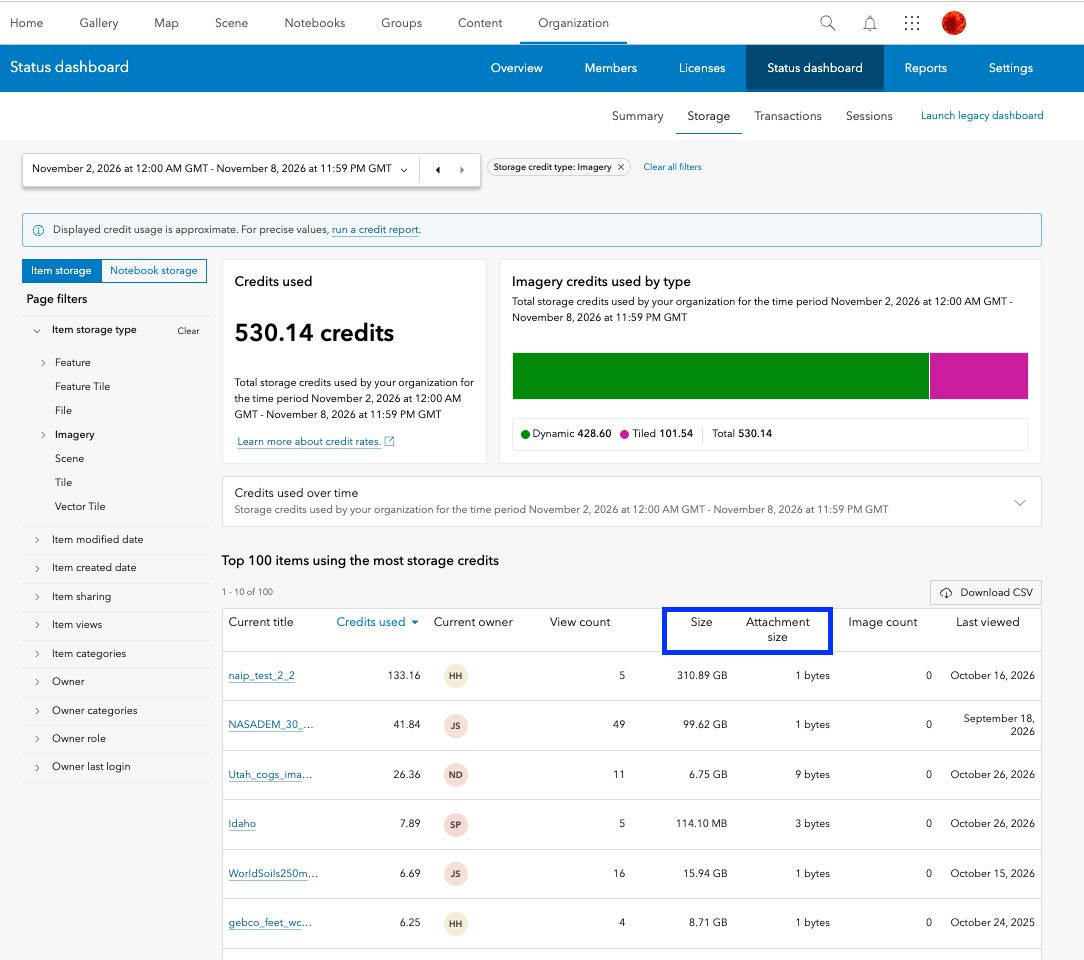
Storage aggregation tables now display item size and attachment size separately, providing a clearer breakdown of storage consumption across different item storage types.
Attachments are additional files, such as photos, documents, and other media, associated with an item. These files can contribute significantly to overall storage usage, particularly when items contain large or numerous attachments.
By displaying attachment sizes separately, administrators can better understand how much storage is consumed by the item itself versus its attachments, helping them identify the factors contributing to storage credit consumption.
View Your Own Credit Usage with My Status Dashboard
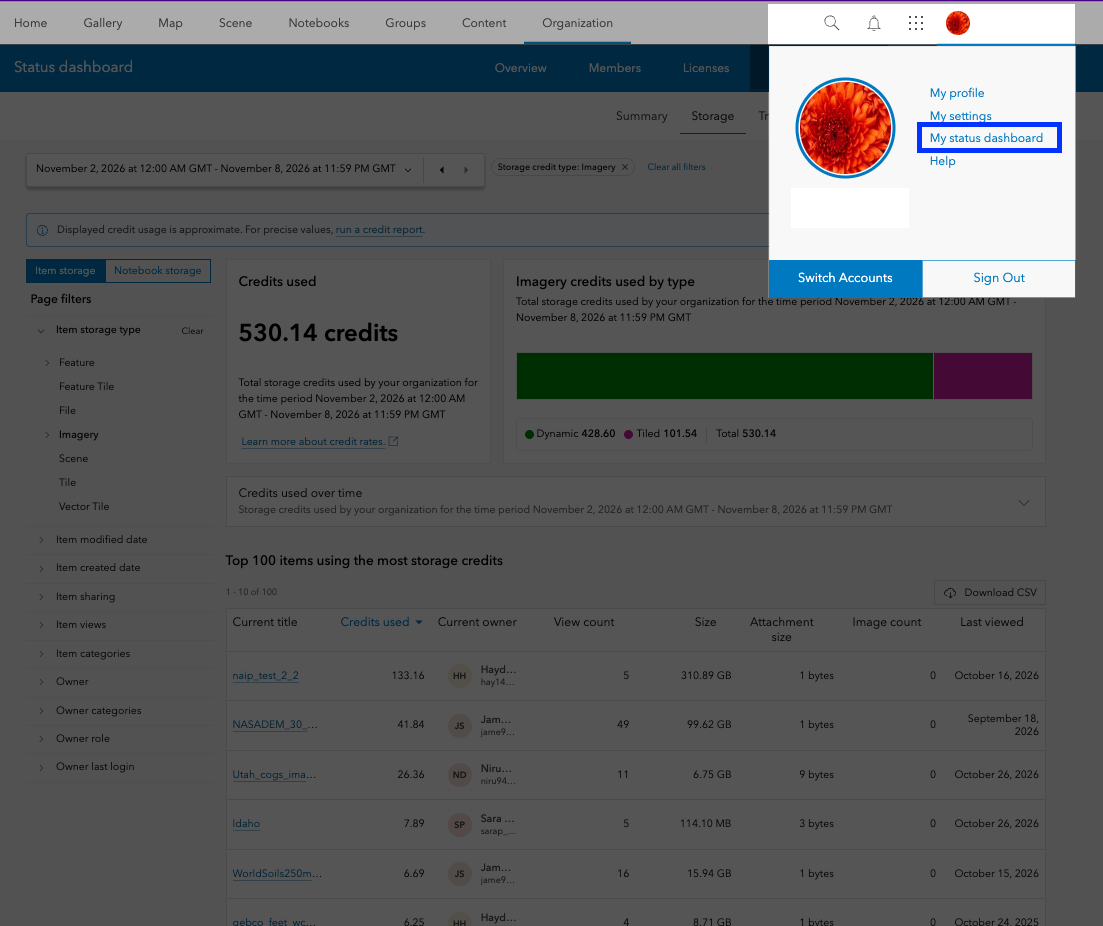
ArcGIS Online members can now review their own credit consumption through My Status Dashboard, available from their profile menu. The dashboard provides a personalized view of usage across Storage, Transactions, and Sessions, automatically filtered to the signed-in member. This eliminates the need to manually apply filters and keeps the member’s information in focus when navigating between dashboard tabs.
Faster member-level review for administrators
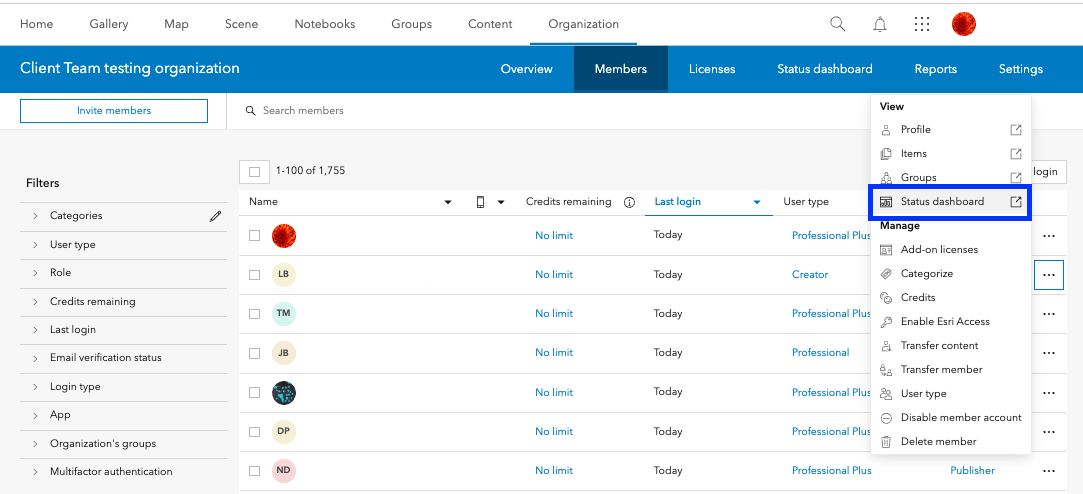
Administrators can also open the Status dashboard for an individual member directly from the Organization Members tab. Although administrators can already filter the organization dashboard by member, those filters may need to be reapplied when moving between tabs. Opening a member-specific dashboard avoids that extra step because the member is automatically selected across the experience. This provides a faster workflow when investigating credit usage, reviewing activity, or helping a member understand how resources are being consumed.
Better visibility into organization usage
Together, these updates make the Status dashboard more useful for day-to-day monitoring and analysis. Administrators now have more ways to narrow the data, better understand changes in credit usage, export chart information, and see what is contributing to storage. At the same time, the new My Status Dashboard gives individual members more visibility into their own activity. These improvements make it easier for organizations to understand how ArcGIS Online resources are being used and identify areas that may need additional attention.
Feature comparison of the Legacy and New Status dashboard
| Feature | Legacy dashboard | New Status dashboard |
|---|---|---|
| Category | Storage
Analytics (transactions based) Subscriber Content Published Content Analytics (duration based) |
Storage
Transactions Transactions Transactions Sessions |
| Data availability | From the beginning of the last calendar year | From October 1, 2025 |
| Max data visualization range | From the beginning of the last calendar year | From October 1, 2025 |
| Date time aggregation logic | Excludes the end date (from 12:00 AM on the start date to 12:00 AM on the end date GMT) | Includes the entire end date (from 12:00 AM to 11:59:59 PM GMT) |
| Dashboard data update frequency | Every hour | Once a day, after the end of the GMT day |
| Dashboard reporting level | Organization level only | Organization, item and member level |
| Advanced filtering | Limited filtering capabilities | Supports additional filters for item categories, item views, and member/owner categories |
| Credit usage comparison | No direct period-over-period comparison indicator | Displays changes in credit consumption compared with the previous equivalent time period |
| Chart data export | No equivalent chart-level CSV download option | Allows users to download line chart data in CSV format |
| Storage size breakdown | No separate display in aggregation tables | Displays item size and attachment size separately for better visibility into storage consumption |
| Member-specific dashboard | No dedicated member-specific dashboard | Provides a personalized dashboard My Status Dashboard automatically filtered to the selected member across all tabs |
Why These Changes Matter
The latest Status dashboard enhancements make it easier for administrators and members to understand how ArcGIS Online resources are being used. With more flexible filtering, detailed storage information, and improved access to usage data, organizations can:
- Make informed content management decisions: Identify items with high storage consumption and low view counts and better understand how attachments contribute to storage usage.
- Monitor credit usage more effectively: Use additional filters and period-over-period comparisons to identify usage trends and investigate changes in credit consumption.
- Simplify reporting and analysis: Download chart data in CSV format for further analysis, reporting, and sharing.
- Improve member-level visibility: Give members direct access to their own usage information while helping administrators review individual member activity more efficiently.
These improvements build on the new Status dashboard experience, providing organizations with greater visibility and control over their ArcGIS Online credits usage.
We encourage you to explore the new Status dashboard and share your feedback as we continue to improve the experience.
Thank you to the following teammates for their contributions to the blog article: Umang Shah, Mike Minami and Shane Eaves.

Is there a way to view more than the top 100 individual items consuming the most storage credits?
Will the functionality to monitor app usage, as in the legacy dashboard, also be implemented in the new?