This article was originally published on June 14, 2023, and has been updated.
Every time you visit the doctor, a familiar routine takes place. Temperature, heart rate, blood pressure—information collected and retained.
Why do we do this? You might be there for a sore pinkie toe. Surely heart rate doesn’t impact that.
I Am Not A Doctor—but I know these measurements are done in part to establish a baseline, a collection of data points representing the range of values considered healthy or normal for your body.
Variation from this baseline can be a more revealing health indicator than the number on its own.
The Feature Data Store resource usage chart displays your feature data store’s key health indicators over time, offering administrators precise insight into its typical range of values. Early awareness of changes in resource use patterns offers administrators the opportunity to take corrective action before problems arise.
In this blog article, we’ll first learn how to access the usage chart, and then we’ll discuss how getting to know your feature data store baseline will help you keep it in good health!
For more information about Standard and Premium Feature Data Store, including pricing and capabilities, please visit our ArcGIS Online FAQ.
Accessing the usage chart
To begin, log into your organization with an Administrator role, then navigate to your Organization Overview page.

From here, you can see the size of feature data store that your organization is using, and the percentage of feature data storage that has already been used.
Click the Feature Data Store hyperlink to access the usage chart.

The usage chart expands the administrator’s insight into the organization’s feature data store and its two key values: feature data storage and feature data compute—which I like to call “horsepower.”

Getting to know your feature data store’s baseline
Our heart rates and blood pressure fluctuate throughout the day, based on exertion, food intake, ambient temperature, and sometimes for no reason we can discern.
Similarly, the storage and computational use of your organization’s feature data store will fluctuate. Healthy systems perform various self-care routines and recycle their processes periodically—these can result in some visible and normal movement in computational resources.
In addition to these minor variations, our organization’s workflows vary. On some days, your data store may be running a marathon and on others, it may be enjoying a lazy Sunday. If 350 mobile workers return from the field and sync their offline edits simultaneously, we’ll likely observe a corresponding increase in computational load. And at night (or lazy Sundays) your feature data store may register little or even no activity.
The key to managing your resources is recognizing what range of data points lie within your Feature Data Store’s normal use patterns, and what to do if you see unusual variation.
Storage

Storage includes three metrics. Your feature data store’s total, or allocated storage space is represented by the horizontal line. Used storage space is shown in dark grey. And remaining storage space, or available storage is shown in light grey.
In the above example, the feature data store is allocated 1 terabyte (TB) of total storage space. Of that space, there are 933.48 gigabytes (GB) remaining. At a glance, I can see my organization has plenty of room available for additional feature data.

This information helps you maintain an awareness of your organization’s storage use. If you observe increasing storage consumption, you can run organization reports to find large items or items you and your team can identify as being stale or otherwise unnecessary. And if you hear widespread user reports of consistently failing attempts to add new features or upload data, check your storage use–these could be symptoms of running out of space.
But if you and your team validate that all of the content is necessary, it may be time to consider upgrading to a larger Feature Data Store.
Upgrade your Standard Feature Data Store to a Premium Feature Data Store online, or move between Premium Feature Data Store levels by contacting your Account Manager. Upgrading and downgrading between ArcGIS Online Feature Data Store levels requires no work from your team, and all content and URLs are unaffected. Upgrading from Standard to Premium or to a higher Premium level can happen at any time with a minimum billing period of 30 days.
Computational resources
Computation is essentially: the work being done by the database engine powering ArcGIS Online Feature Data Store. Think of this like a vehicle—if you need to move a ton of gravel, a pickup truck with a lot of torque will move much more quickly uphill than a passenger car carrying the same weight.
To apply this reasoning to ArcGIS Online, we must understand what work is done by the feature data store. In the graphic below, common workflows are listed in order of most power used to least power used, and some of the “multipliers” that can increase work done at the database level—for example, concurrency, multipart features, and so on.
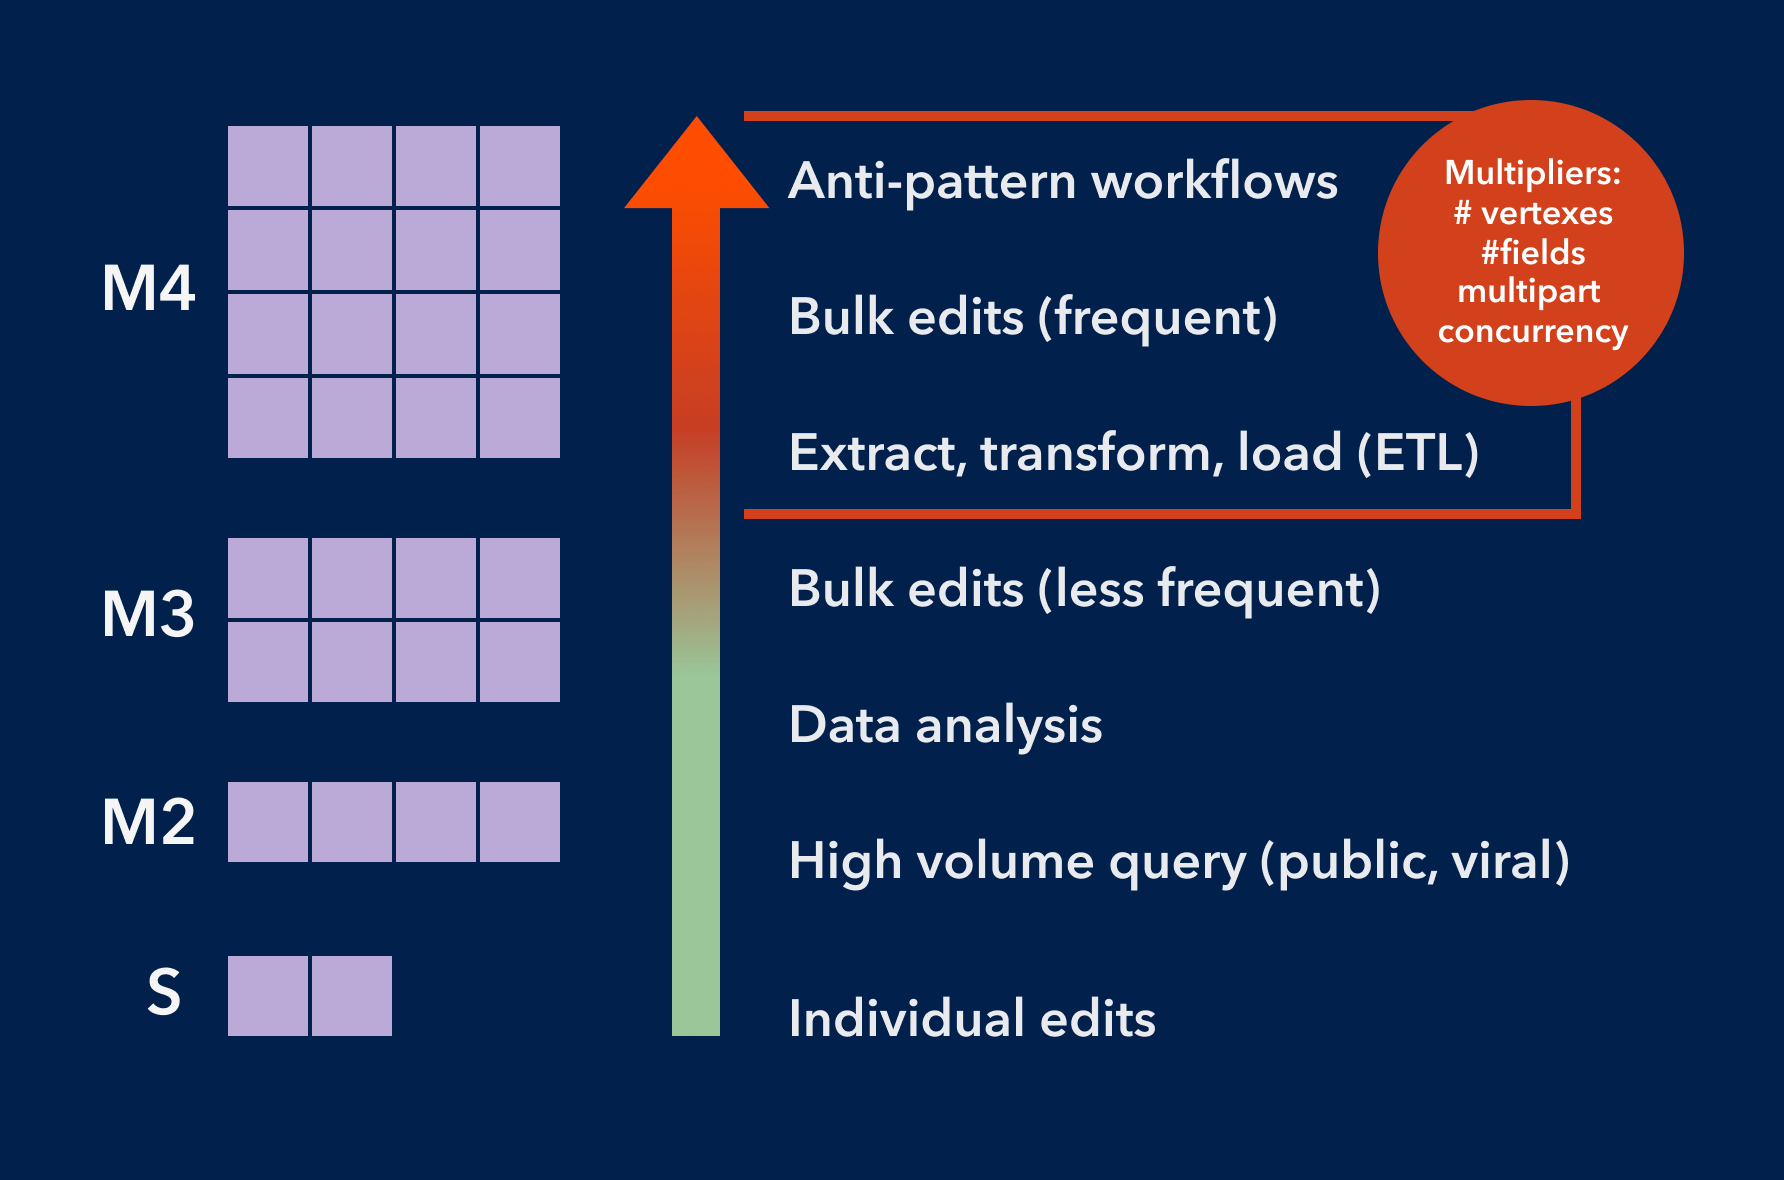
This provides a general idea of which workflows rely on the feature data store—operations performed on hosted feature layers. Anti-pattern workflows are those that do not follow best practices—for example, enabling editing on a public feature layer in a web map. Best practices are blueprints for configurations that use feature data store resources optimally. Without best practices (described later in this article, the feature data store must work harder. Frequent bulk edits and ETL can require more horsepower; I generally consider this effect when getting into 100K record territory and when data is updated more frequently than every 15 minutes. There are no fixed rules—and the multipliers add much potential variation—but these are good ideas to keep in mind as you build awareness of your team’s workflows and your organization behaviors via the usage chart.
The usage chart tracks an aggregate computational metric comprised of the following:
- Percentage of CPU in use
- Input/output (I/O) volume
- Memory use
Your organization’s consumption of these resources is tracked on the vertical (y) axis, and time is represented along the horizontal (x) axis, as shown in the following example.
How can we tell from this chart with lots of spikes and gaps whether or not this feature data store is healthy? First, we need to understand what gaps and spikes are.

Gaps
The gaps in this chart are time periods during which this feature data store used so little of its computational capacity that it did not register on the chart at all. It does not mean that the feature data store is off, sleeping, or locked—your eature data store is always running.
Spikes
A spike is a usage pattern that is pointy at the top and goes up and then down, as indicated in the chart shown above. Spikes indicate rapid increases in effort at the database level, but in this case, they’re brief and not out of the ordinary for this organization or for any others I work with frequently. I expect these are a blend of the afore-mentioned “self-care” routines or any number of more intensive analysis, edit, or query workflows I and my colleagues run continuously. These spikes are not correlated with latency or other unexpected behavior and are part of this organization’s normal routine.
However, the following image tells a different story.

The above image indicates a pattern of sustained maximum usage, a time period during which 100% of available feature data store power was in active use. Unlike a spike, a maximum usage pattern is flat at the top, showing 100% usage for a duration of time. This is not something I see frequently in my organization, and I’m confident it occurred during a period of time in which hosted feature layers were extremely latent. This indicates a bottleneck, resulting in end users waiting for their hosted feature layer requests to get their turn at the database. Some end users, depending on what kind of client they’re using, may even have seen timeout responses.
In this circumstance, the ArcGIS Online administrator must consider their own organization’s needs and values to arrive at the next best action. The role this organization plays in your team’s business will be a factor. If this is a prototype environment for your GIS team, perhaps occasional latency is acceptable and the additional investment in a higher level is not aligned with your business priorities. If this ArcGIS Online organization is the primary vehicle for your high visibility engagement with public stakeholders, your risk assessment may be more conservative, favoring operational consistency over cost. There are many use cases, and the right decision is made by applying knowledge of your organization’s values and needs.
Feature data store resource management analysis & best practices
Understanding baseline behaviors is key to answering common questions about your Feature Data Store, such as:
Sizing
Is our Feature Data Store the correct size for our needs?
Based on the example organization shown earlier, I can see our current storage capacity is sufficient, and we have room to grow. If I notice any significant or sudden increases in storage consumption, I’ll connect with the owners of large or numerous data sets to learn the context around their storage use. Here again, organization reports support the team’s active discovery and evaluation of large, aging, redundant, or forgotten items.
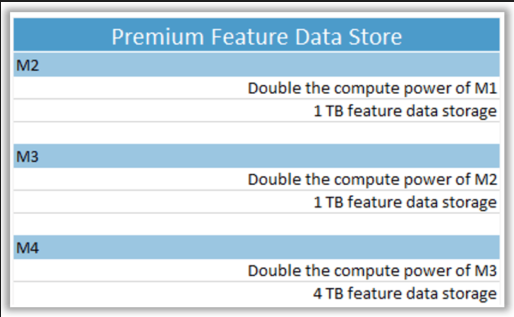
The computational resources, though not under continuous use, comfortably accommodate spikes I know are related to our typical use case: inviting groups to check out and test new capabilities. Looking at the feature data store levels (shown below), I know the next size down offers approximately half my current resources. This would not adequately serve my highest volume use cases, so it seems my organization is properly sized.
Forecasting
What Feature Data Store size will we need next year?
If you administer an organization which serves multiple teams, you’ll want to maintain communication with their leadership to understand future plans. My organization is expected to stay as it is; there are no plans for new data such as statewide parcel data or migrating a new division into my organization. And we do not anticipate adding new members or increasing our reliance on analytical workflows. With this knowledge, I can review our past growth and project a similar rate for the upcoming year.
Best practices
The following best practices will help administrators effectively monitor and manage their organization’s feature data store:
1. Be on the lookout for indications that your organization’s needs may be increasing.
- Is your baseline computation usage increasing over time?
- Is your storage usage increasing over time?
2. Consider the thresholds which require action.
- What are your highest usage activities? Do you have enough capacity to serve them at all times?
- Do you have seasonal usage increases?
3. Conserve energy through adoption of best practices
- Develop a governance plan.
- Remove redundant or extraneous items.
- Use feature tiles for repeatable and scalable queries.
- Minimize or eliminate public editing.
Take a quick look at your feature data store usage chart each day, and you’ll quickly learn its baseline patterns. With this knowledge, you’re well-equipped to keep it in excellent health!
Learn more
This is the first article in a 3-part series about ArcGIS Online data management best practices to support scalable public-facing web maps and apps. Check out the next two resources in the series to learn more:

This is extremely helpful. Kudos to you and the team for rolling this one out!
Nice article!
One of the most important capabilities we need with ArcGIS Online however, is the ability to see which processes are causing the strain on the resources. The answer to high demand of course isn’t always to scale up, there could be some errant / inefficient automation or process that needs to be addressed.
We’re in a situation at the moment where our resource graph is showing continual max consumption, and we have no idea what’s causing it. We’re reliant on ESRI Inc to come back with information, which can take considerable time via the Support Case processes.
@Simon Pellings
Have you received a response from Esri Inc? Have you been able to rule out the problem?