Imagery can be hosted, visualized, analyzed, and shared in ArcGIS Online, which assists organizations in managing and sharing their imagery data without the need for infrastructure. Once you have all your imagery data organized, ArcGIS Online allows for analysis workflows, including deep learning. For this release, there are several upgrades to the user experience for imagery in ArcGIS Online, including:
- Raster analysis with Living Atlas imagery layers
- Registering preset imagery styles in Map Viewer
- Access the new Raster function editor directly from Add New Item dialogue
- Enhanced tools and raster functions
- Enhanced environments
- Display order widget in ArcGIS Experience Builder
- Enhanced Filter tool for Map Viewer
Raster Analysis with ArcGIS Living Atlas Imagery
ArcGIS Living Atlas of the World has included a variety of global Earth observation imagery layers. These layers have empowered users across industries to perform powerful visualization and analysis directly within ArcGIS Online without the need to download large datasets. When users persist the results of analysis, those imagery layers subject to the conditions set by the layer publishers as described here, such as whether analysis is enabled or not, and the request size limit setting.
You can now perform raster analysis more efficiently on select ArcGIS Living Atlas imagery layers, enabling support for significantly larger areas of analysis. This capability is currently available for the following layers:
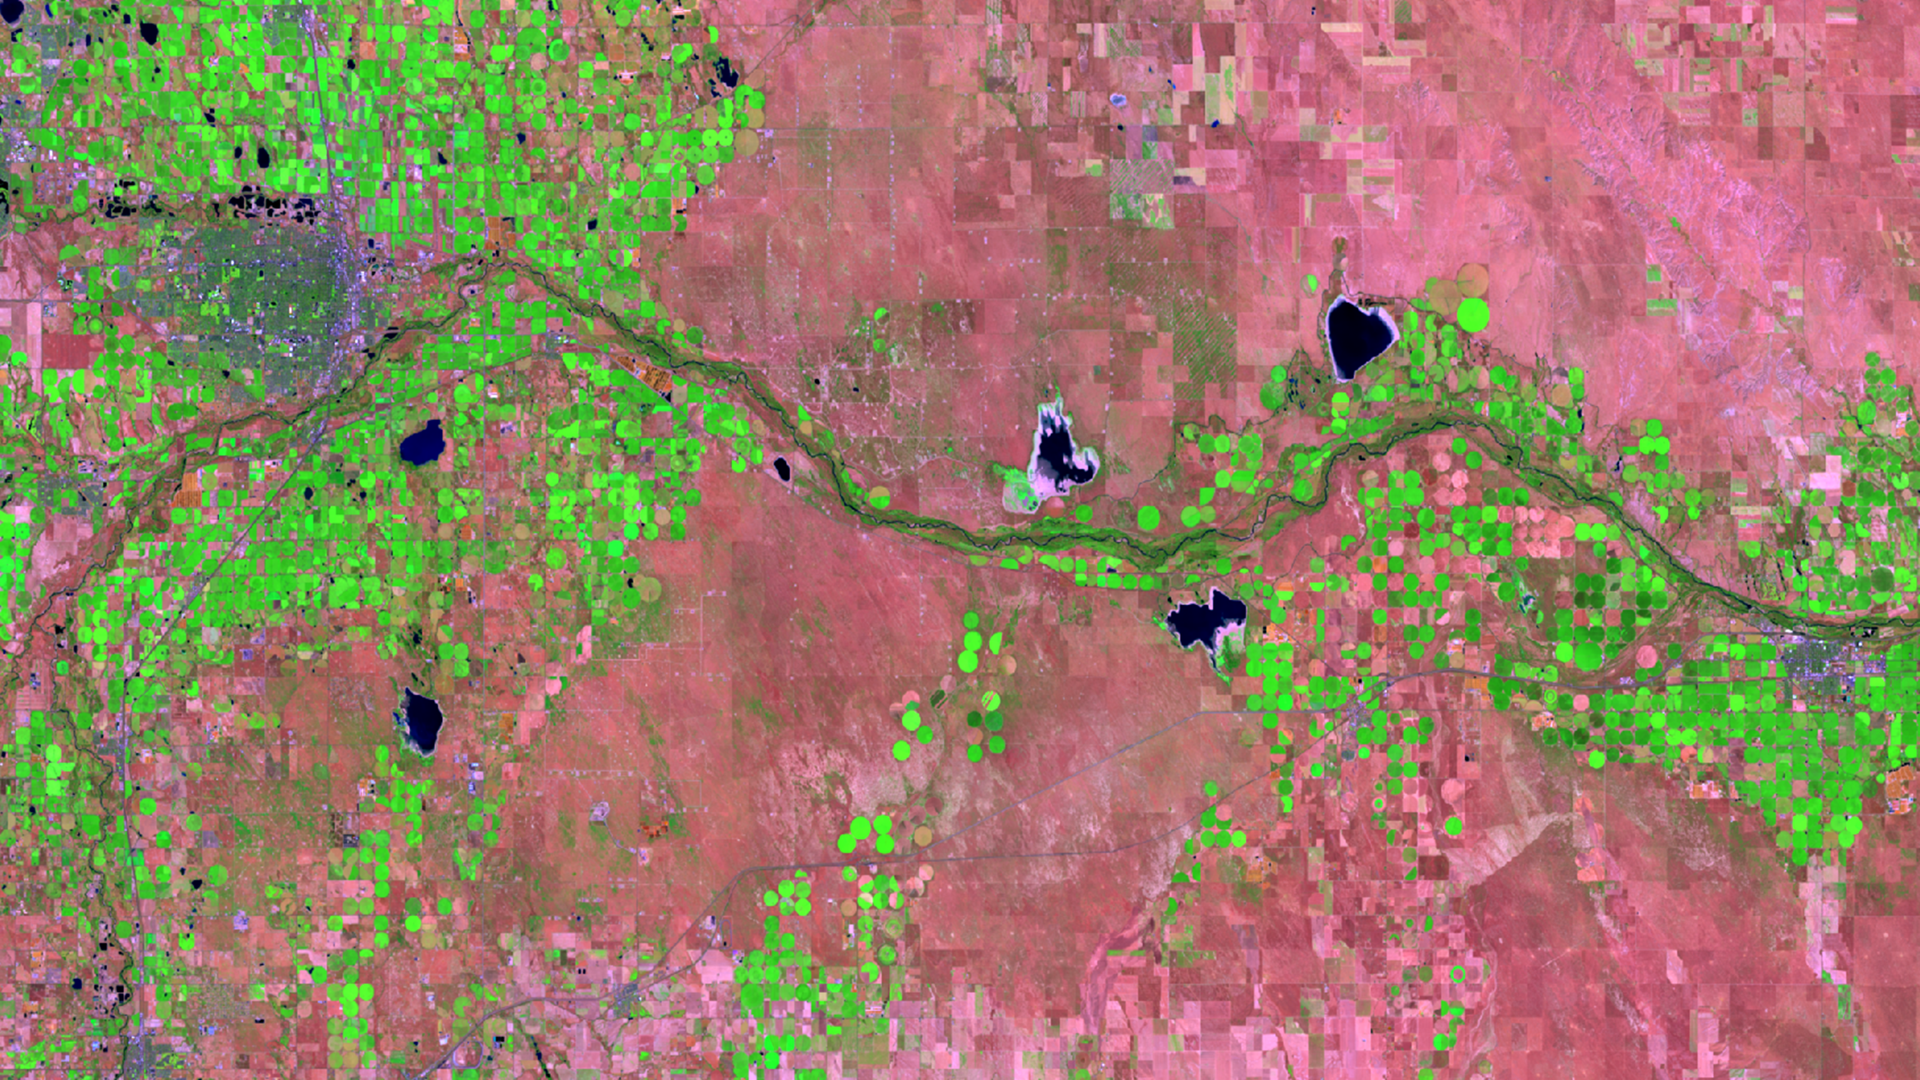
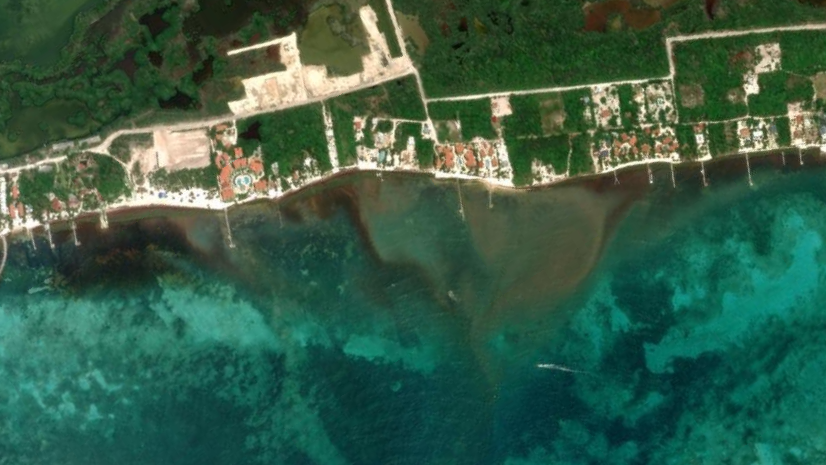
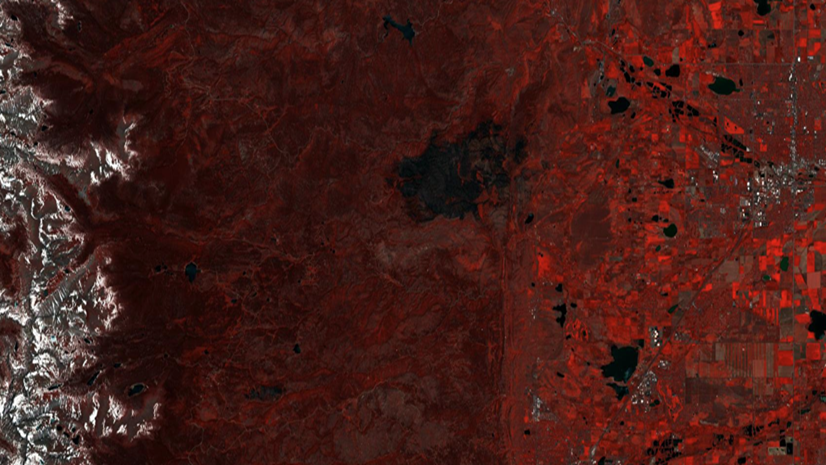
- Landsat Level-2
- NAIP
- Sentinel-1 RTC
- Sentinel-2 10m Land Use / Land Cover Time Series
- Sentinel-2 Level-2A
List of Living Atlas layers that have been optimized. For the definitive announcement for the ArcGIS Living Atlas Ready-To-Use imagery layers, please see the blog here.
When this capability is enabled, the analysis server accesses imagery data directly from cloud storage instead of streaming pixels through the image service. This direct access removes many of the limitations typically associated with remote pixel access, allowing for analysis requests of larger areas.
The analysis is executed in the same cloud region where the imagery is stored, improving performance and scalability. To support this, you must authorize the temporary transfer of your analysis inputs—such as raster function templates or deep learning models—into the region where the imagery resides. Outputs are also temporarily stored in that region before being returned to your organization.
It is disabled by default. Organization administrators can enable it by going to the Security tab on the Organization settings page.
Registering preset imagery styles in Map Viewer
You can now save and reuse custom visualizations for imagery layers in Map Viewer by registering them as preset styles. These new styles appear as selectable options, making it easy to switch between different visualizations without rebuilding them from scratch.
Preset styles support multidimensional variables and raster function templates, automatically applying the correct renderer when selected. Use Save or Save As to lock these presets into the layer, ensuring consistency across maps and users. Link a style to a specific multidimensional variable or raster function template and when the user picks that preset, it automatically switches to the right variable and renderer and vice-versa.
With preset imagery styles, a single layer becomes a gallery of ready-to-use visualizations—perfect for fast analysis and consistent storytelling.

Access the new Raster function editor directly from Add New Item dialogue
The new Raster Function Editor has taken the place of the old editor in existing access points from the Content page. Raster function editor can now be opened directly from the New Item dialogue. Simply choose the option to for Raster function template and you will be prompted to name the new raster function template. Once you save the properties of the new raster function template, you will have the option to open the Raster function editor to begin creating your new raster function template.

Enhanced tools and raster functions:
- Distance Accumulation and Distance Allocation tools and raster functions—Performance was improved when using the Vertical Factor Raster or Horizontal Factor Raster parameters.
- Zonal Statistics tool and raster function, and Zonal Statistics as Table tool—The cell size of the value raster is used as the analysis cell size for both raster and feature zone input by default. This behavior for feature zone input was supported in an earlier release. The update makes the analysis more accurate because the value raster is the primary raster that influences the output results. To modify the default behavior, use the Cell Size environment to specify a number, a raster dataset, or the Maximum of Inputs or Minimum of Inputs options.
- Default behavior change for visibility of parameters—Previously, if none of the parameters in a raster function had the IsPublic toggle button turned on, all parameters were exposed as variables. This default behavior has changed. Now, if a raster function does not contain any parameters with the IsPublic toggle button turned on, no parameters will be exposed as variables when you open the raster function template to run it.
Enhanced environments
Tools that honor the Cell Size environment support an empty option in tool and raster function dialog boxes.
You can accept the default cell size setting or specify different numerical values, a raster dataset, or a keyword setting. Tools that use Maximum of Inputs or another special setting as the default continue to do so.
Display order widget in ArcGIS Experience Builder
The Image display order widget sets the display order for overlapping images within an imagery layer. This widget works with imagery layers that originate from Image Server or are dynamic image collection imagery layers. With this widget, you can alter the order of the display for any overlapping input images.
Enhanced Filter tool for Map Viewer
Filter tool on Settings (light) toolbar has been enhanced for imagery layers. Field names and values are shown in the dropdown, interactive histogram selector and date field value picker are also shown up for supported field types. As the histogram selector is adjusted, the imagery that meets the criteria will be displayed in the map.

Ready to take the next step?
As an ArcGIS Online user, you can start exploring these new imagery capabilities today. The Product Team is interested in your thoughts and ideas as you explore. Influence the direction of future releases when you visit us and leave a comment via the Imagery in ArcGIS Online community on Esri Community.
Are you interested in further exploration of imagery in ArcGIS Online can do for you? Watch a demo and see what others are saying about the product, such as Skytec, LLC, the City of Johns Creek, and the City of Yakima. You can also read a case study from the National Trust from the United Kingdom.


Article Discussion: