Symbol animations have been available for a few releases now in ArcGIS Online. Initial support was introduced for point symbols through the Animation symbol gallery. In the following release, support was expanded to include line and polygon animations. Now, in the February release of ArcGIS Online, Map Viewer allows you to add animations to your own symbols.
Symbol animations are supported across point, line, and polygon vector symbols. These can include default symbols from the provided galleries like points of interest, lines and polygon fill. You can even use your own symbol galleries published as web styles, or SVGs uploaded through the Symbol Styler. Animations work across various mapping styles and are also supported for sketch features.
How to add animations
When you open the Symbol Styler in Map Viewer, make sure the selected symbol is a vector point, line, or polygon. Once a vector symbol is selected, you’ll see a new button beneath it labeled Structure. This is similar to the Structure tab in ArcGIS Pro, where you can add effects to symbols and symbol layers
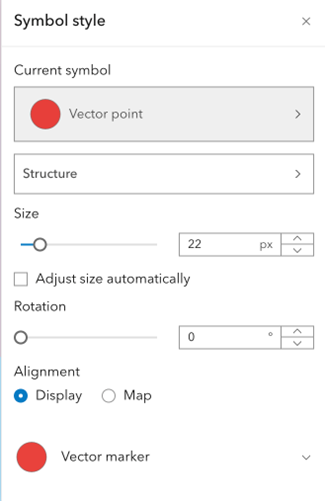
Clicking the Structure button displays the top-level symbol—where you can add animations—as well as the individual symbol layers, which also support animations.
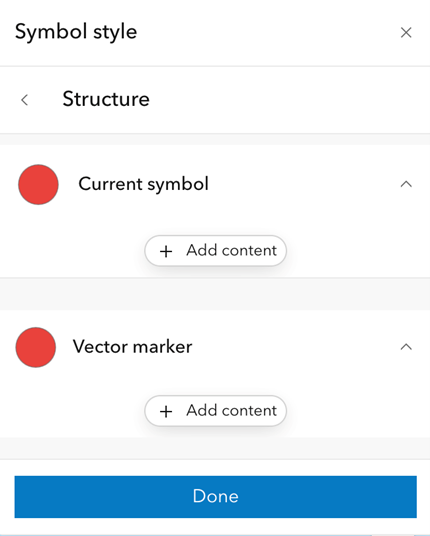
To add an animation, click + Add Content, then choose the animation you want to apply to the symbol or a specific symbol layer. For this initial example, I’m adding a Scale animation. This adjusts the symbol’s size based on the scale factor set with the slider. Scale works particularly well when you anticipate changing symbol sizes, as it adjusts proportionally. In contrast, using Size would change the symbol from one fixed size to another.
Adding animations to a multilayer symbol
In this example, I’m using a multilayer symbol to display beaches in Hawaii and their current rip current strength (high, medium, low). Using the same steps outlined above, you can access the Styler for all values or for a specific value within this style.
After opening the Structure view, I add a color animation to the “High” rip current symbol layer and configure the color transition properties. Next, I return to the Structure panel and add a top-level Scale animation. Because this animation is applied at the top level, it scales all symbol layers using the same scale factor
Adding an animation to a polygon
For the final example, I’ll demonstrate adding an animation to a polygon layer. In the current release, line and polygon symbols support color change and transparency animations.
In this example, I’m working with active wildfire perimeters. The layer is styled with a vector polygon symbol, and I’ve applied a bloom effect to give it a brighter appearance.
The animation controls for lines and polygons are located in the same place as they are for points. In the Structure view, I add a color animation at the top level of the symbol so both the stroke (outline) and the fill transition to the same color. In the animation settings, I experiment with the Random and Manual offset options. The Random effect creates a more dynamic, “alive” appearance, while the Manual offset—where all features animate simultaneously—can produce a hypnotic effect when many features are visible.
This is a quick overview of the animation support added in this release. We’re excited to see how you experiment with animations. I also recommend checking out the accompanying StoryMap blog that explores how to use animations effectively in your stories.

Article Discussion: