Storytelling with maps has always been an exercise in capturing and directing a reader’s attention. To achieve this task, cartographers have long relied on the fundamentals of symbology, visual hierarchy, and composition to guide the eye through spatial narratives.
Animation adds a new dimension to this equation. Motion can short-circuit the brain’s usual patterns; our eyes snap to anything that moves, even the slightest motion, which makes animation a powerful tool.
However, animation isn’t just a decoration. It’s a technique that should be used with intention. When used thoughtfully, animation can do far more than simply grab attention. As our team rebuilt this story about Kīlauea, we looked for moments where Map Viewer’s animated symbols could do real narrative work, not only drawing the eye but also shaping atmosphere, conveying motion, and creating effects that static symbols simply can’t. Those choices became part of the story’s design and helped readers feel the energy contained within Kīlauea.
Note: Click each of the animated samples below to explore a web map with all of the animation and layer configuration.
Look here
Motion is the fastest way to draw the eye. A well-placed animated symbol can instantly highlight a feature. When used sparingly and with intention, they create visual cues that pull readers towards the elements or characters within a story that matter most.
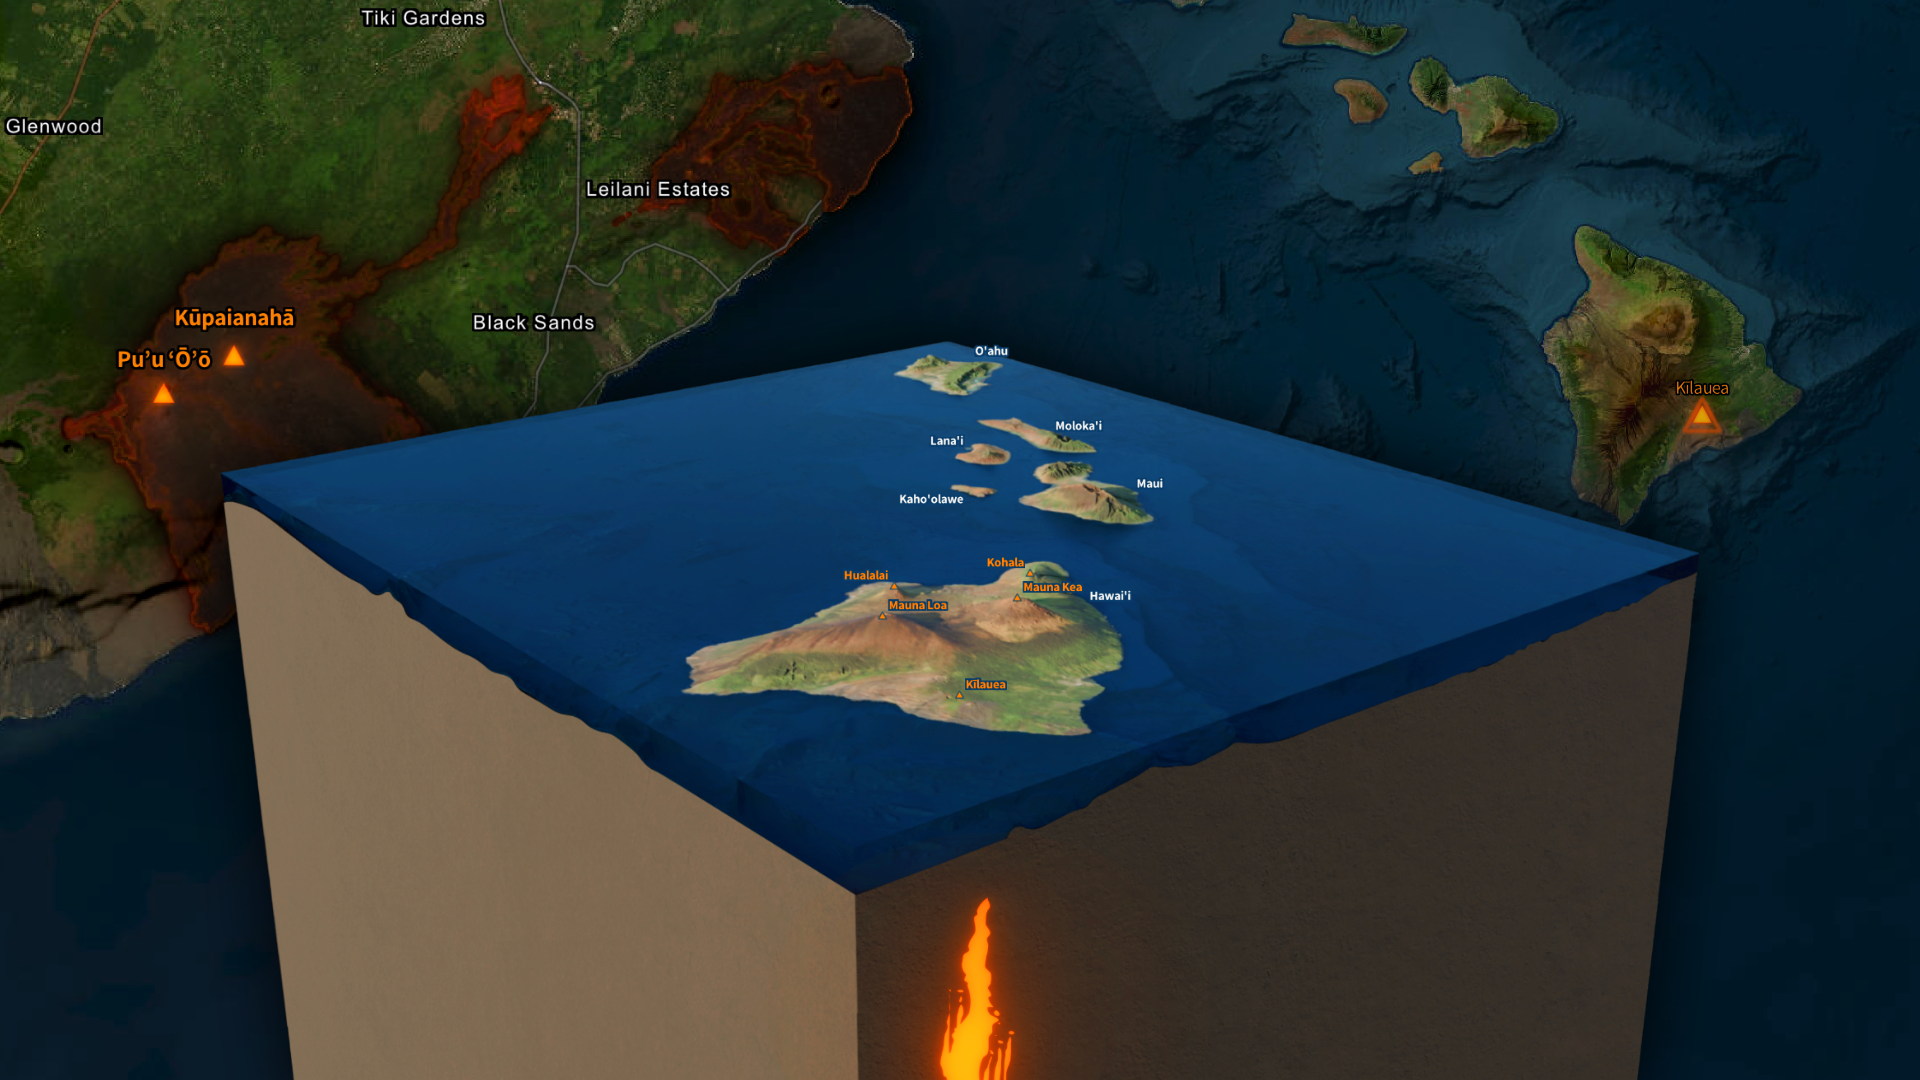
The most obvious application for this effect is within locator maps. As an author, we want to establish the geographic setting for readers early on. Using an animated symbol within a locator map helps readers quickly get their bearings.
In the Kīlauea story, a glowing animated triangle symbol immediately identifies the volcano within the chain of Hawaiian Islands. In addition, as there are only a limited number of volcanoes, or characters, in the story, this effect is maintained throughout the story with the same animated symbol being used throughout to guide the reader’s eyes to the current focal point. Subtle shifts in size help reinforce the emphasis of the most important feature within the map view.

Motion
When storytelling, some phenomena demand more than a static symbol. While a measure of wind gusts and a river’s flow rate can be succinctly encoded in the color or size of a static symbol, an animated representation expedites interpretation. By introducing movement and direction, animation helps readers grasp processes even without the aid of a legend. In storytelling, this means the reader can remain immersed in the map’s narrative.
Motion isn’t just useful for data with quantitative measurements of speed or volumes. Animated symbols can also convey a sense of motion to support the story’s narrative. For instance, when mapping the lava flow extents from Kīlauea’s vents, the sense of movement described in the narrative was absent from the map. To visualize the creep of these flows over the landscape, a combination of animated symbols and blend modes was used to create a series of “cascading heat waves” within these boundaries.

Effects
Beyond attention and motion, animation opens the door to creative techniques. In a storytelling capacity, these novel effects can reinforce the story’s atmosphere and elevate the reading experience with dynamism and visual delight.
These creative effects were subtly employed throughout the Kīlauea story, from glowing plate boundaries and rift zones that pulsed with heat, conveying the energy below, to the shifting plumes of steam and sulfur dioxide rising from the caldera.


Animate your stories
Effective use of animated symbols depends on more than creativity. As with any cartographic technique, animation works best when it’s grounded in clear intent and supported by thoughtful design choices.
Keeping this balance in mind while incorporating animation into the Kīlauea story helped ensure it never overwhelmed the reader and served the narrative rather than becoming a distracting decoration.

This is truly awesome – not just from a geological perspective. Thanks for sharing!