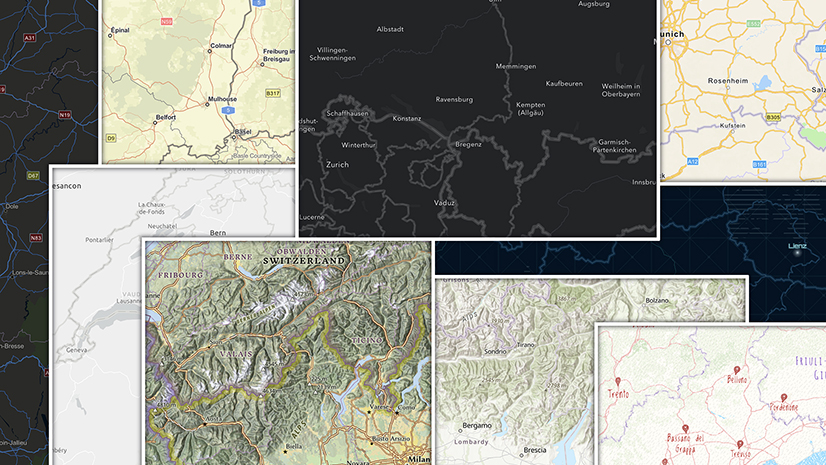
Did you know you can edit basemap labels? This changes everything right?
What was a dream is now a reality thanks to the developers of the Vector Tile Style Editor (VTSE). With label editing they’ve given us keys to the library and access to the heart of Esri’s core collection of Living Atlas Basemaps. Apps like this restructure the way you think of and execute a map or plan a project. The Style Editor can be a place to retrieve global base data which can be filtered by roads, hydrology, contours, populated places, points of interest, or really any combination of what exists. The final piece was being able to customize the labels and now we have that.
It’s this combination of Vector Basemaps with the ArcGIS Online Map Viewer and Vector Tile Style Editor that is really changing the way that you combine basemaps into your work, to the point where you may begin to question whether it is still a Basemap! Let’s go through the process, then talk about the implications with an example.
We’ll start with the exciting enhancement of how to isolate specific labels, remove them, or change their style. The work is done in the JSON code, but the incorporation of a JSON editor into the VTSE makes this a relatively simple process.
The mechanics of making the change
For this example, I’m using a single-layer version of the Light Gray Canvas Map, so I’ve opened it into the VTSE and saved it. I want to modify just the ‘France’ label. To do this I’ll remove it from the existing layer, then duplicate that layer and adjust the code to bring it back on its own. Once that is established, I can make my custom modifications.
Step 1:
Clicking on the ‘France’ label in the map selects the relevant layer and opens the label tools. In this example, the layer is ‘Admin0 point/x large’

Step 2:
Keeping the layer selected, open the ‘Edit JSON’ option. It will take you to the relevant section of code. Find this:

Variations
Most of our label filters use the ‘label class’ format, but there are some variations. You may see: “filter”: [“==”,”_symbol”…
Occasionally the filter may look something like this (The “all” instruction allows additional clauses to be added): “filter”: [“all”, [“==”, “_label_class”, 1], [“!in”, “Viz”, 3]],
Regardless, your new instruction should be added to the existing filter.
Step 3:
In my example I’m replacing it with this:

Update the map, and the ‘France’ label has disappeared
No ‘filter’?
Not all label layers will have an existing ‘filter’ (if the layer ID includes ‘/default’ it probably does not). If this is the case, add this line below “source layer”:
“filter”: [“!=”,”text field“, “target label “],
Step 4:
Go back to the ‘edit layer styles’ tool.
With the layer selected, go to ‘Actions’ at the top and duplicate the layer (The new layer has ‘/1’ added to the name). Alternatively, you can copy/paste the relevant section of JSON code for the same effect.

Step 5:
With the new layer selected, go back to the code.
In the second part, change “!=” to “==”
The “==” is the instruction to use only your chosen label. The ‘France’ label reappears, but it is now on a separate layer.
I’ve also taken this opportunity to change the name of the layer to add ‘France only’, but this is not essential.

Step 6:
The ‘France’ label is now isolated, so I can change its appearance.

Changing Multiple Labels
Removing multiple labels within a layer is straight-forward – Just repeat the “!=” command:

However, re-establishing the label requires duplicating the whole block of code:
.")
Adding Information
It’s also possible to add some extra text to labels, but you need to be aware of the implications:
Here I’ve made the counties the subject of the Light Gray Canvas Map, but I want to enhance it more by adding the word ‘County’.
I’ve found the relevant layers and opened the JSON editor:
‘text field’ identifies the data source for the label (“_name”). By adding ‘County’ immediately after, that will be added as a suffix to the labels…

… but be careful! The suffix will be added to ALL third order (Admin 2) labels, regardless of the context. If the map is to be used worldwide it could be misleading, and potentially insulting. In France ‘Yvelines’ and ‘Hauts-de-Seine are ‘Départements’.

Times have changed…
Now that we know how to modify labels it’s probably a good time to ask when does it cease being a Basemap? At what point do these redesigns, reconfigurations, mixing of tiles, and label editing turn into maps of their own?
Let’s look at this map which is a combination of SIX different vector tiles! Four of the layers were modified in the Style Editor and the last two were enhanced with the Map Viewer’s cartographic tools of Effects, Blend Modes and Transparency. This workflow produces a mix up of digital and reality with near infinite customizations of colors and text with base layers becoming more like active map layers.

This map uses a modified version of this Reference, Detail, Base, with code borrowed from the Topographic Map. Shout out to Andy Skinner on creating the parent layers for this map which are a beta Physical Geography version of Esri’s Human Geography basemap.
The map was designed with these criteria:
- Accentuate the forested areas
- Has World Imagery, but reduced and used more as a contextual layer
- Displays a user created tile layer
- Has customized labels
Let’s zoom into the Central Valley of California and see how it was done.

Accentuate the forested areas
Did you know you can copy code from one basemap to another? In the Vector Tile Style Editor within the World Topographic Map under ‘Natural’ there are two layers in the ‘Vegetation’ category. We can use those to emphasize the forested areas. Open up the JSON Editor and take the code containing the two vegetation layers and copy it out (lines 121-195).

Next paste those lines of code (mind the comma) into the JSON of the Physical Geography Base and you can see the forested areas get tinted green. Next adjust the Color to be a bluer green with Opacity that persists at every scale. See this blog to see a more detailed example of how this is done.

Has World Imagery, but reduced and used more as a contextual layer
To help mute out the imagery the Physical Geography Base layer is tinted white-grey with 30% Opacity. This helps to tone down the saturation and make the imagery more subtle.

Take this layer into the Map Viewer to combine it with Imagery and World Hillshade. Using Blend Modes, ‘Multiply’ the Base Layer with World Hillshade; next ‘Multiply’ World Hillshade with World Imagery and set the Transparency to 50% to further reduce its presence. Such nice and nuanced terrain and imagery now!

Displays a locally produced vector tile styled in the editor
What’s really cool is you can publish your own vector tiles from Pro and use the Style Editor for the cartography. Vector Tiles are cached and extremely performant especially for complex polygons with thousands of vertices. Here’s a lake polygon for an area in California known as Tulare Lake that reappeared in the spring of 2023. I’ve broken the single polygon into two so now I have a polyline and a polygon. By selecting both of them I can publish them from Pro as a Vector Tile…

Then in the Style Editor I can do cool things like duplicate the outline and use different stroke sizes, colors, and opacity levels to achieve a faded or glowing effect.

Lastly ‘Multiply’ the lake in the Map Viewer which gives it a more fluid look and integrates it into the landscape.

Has customized labels
Andy’s already detailed out the steps above for how to isolate and manipulate a label. Let’s take it a step further and make the label really fit our map by moving it more in alignment with the lake outline. Using the reference layer, I have isolated the label for “Tulare Lake” and made it its own layer. Then I changed the font, color, size and increased the Line Height, Text Anchor, and Offset so that the label is moved and perfectly centered within my lake polygon.

Nice and neat in the center!

Like Andy also showed, let’s add the word “County” to our Administrative 2 layer by adding it in the JSON “text-field”.

Not a just a ‘basemap’ anymore.

If you would like to see these steps in action, please check out this video.
So what’s the answer? Basemap… or Map?
Well, that’s up to you! We’ll continue to provide and update basemaps as we always have, but it’s a starting point. Don’t think of the basemap as that separate item floating somewhere behind your information. With these tools it can be, and should be, an integral part of your presentation.
Please feel free to reach out to us with comments or questions.


Article Discussion: