Time is an integral piece to data collection, management, and visualization. To streamline working with time-aware data, three new field types, Time only, Date only, and Timestamp offset, were introduced into ArcGIS Online. Arcade is a key component to leveraging dates and times to produce impactful and informative maps.
New and updated functions
Several Arcade functions were updated and added to complement the arrival of these field types, providing you with an easy way to build maps around temporally significant data. A full list of these functions can be found in the Arcade release notes.
In the next section, we’ll walk through some practical examples that showcase how you can use Arcade to get the most out of your temporal data. Within each example, we’ll focus on a new field type – Time only, Date only, or Timestamp offset – and highlight how Arcade can be used in conjunction with these fields to produce informative pop-ups, visualizations, and labels in your web map.
Practical examples
1. Time only
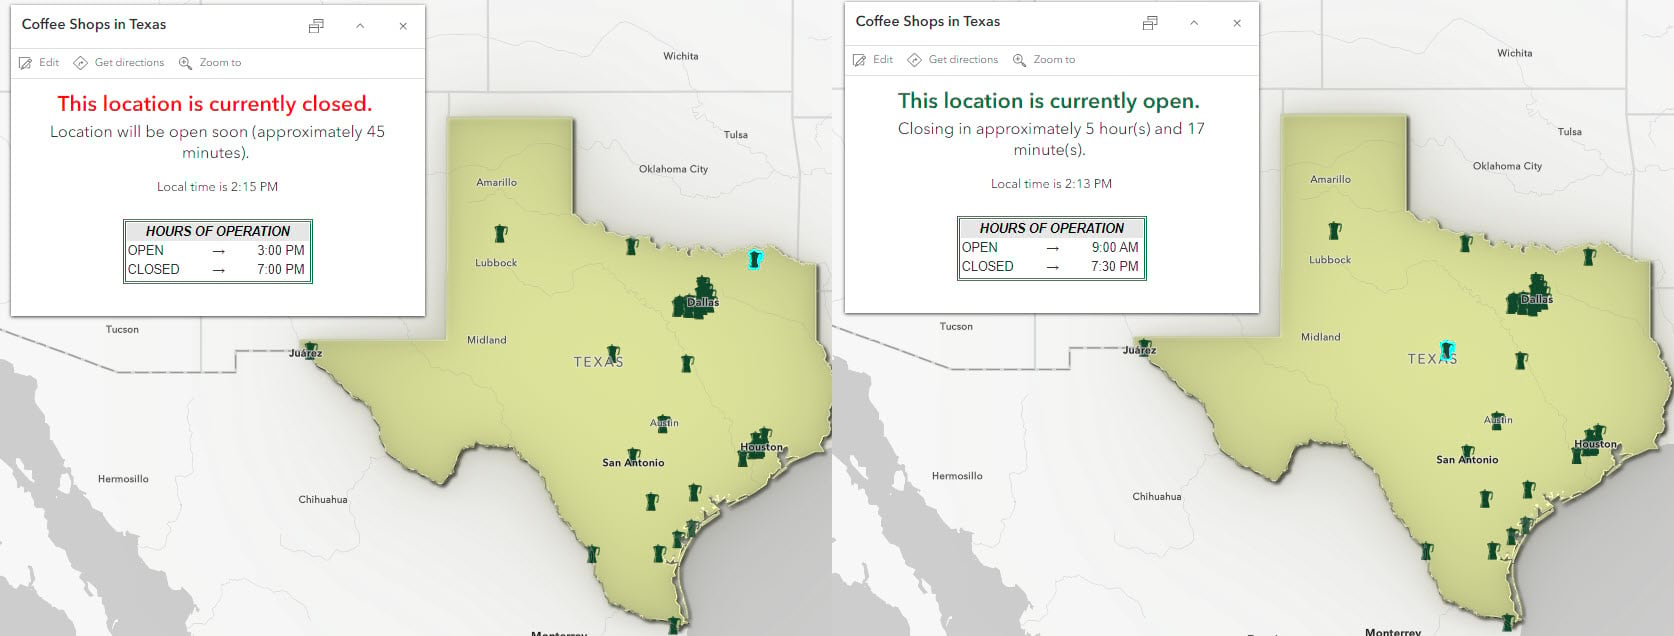
In this example, we have a point feature layer indicating locations of coffee shops throughout Texas, USA. Within the feature layer are two Time only fields which indicate the time of day each store opens and closes. Using these feature attributes with Arcade, we can author an expression for our pop-up that will dynamically display the time until a location opens or closes depending on the store’s operating hours and the current local time in Texas.
// get local Texas time
var cst = Time()

// get store opening and closing hours
var open = $feature.store_open
var close = $feature.store_close

// if the store is open...
if (cst >= open && cst < close) {
  // find the difference between the store closing time and current time
  var hrToClose = DateDiff(close, cst)

  // convert milliseconds to hh:mm:ss.sss format
  hrToClose = Time(hrToClose)

  // get hour(s) and minute(s) until store closes
  var hh = Hour(hrToClose)
  var mm = Minute(hrToClose) + 1 // round up to next minute to account for no seconds in estimate

  // if the store will be open for > 1 hour,
  if (hh >= 1) {
    return `Closing in approximately ${hh} hour(s) and ${mm} minute(s).` // provide estimate in hours and minutes
  }
  // if the store is closing in less than an hour
  if (hh == 0) {
    return `Closing soon (approximately ${mm} minutes).` // provide estimate in minutes only
  }
}

// if the store is opening soon
if (cst < open) {
  var hrToOpen = DateDiff(open, cst) // get time until it opens in hh and mm
  hrToOpen = Time(hrToOpen)
  var hh = Hour(hrToOpen)
  var mm = Minute(hrToOpen) + 1 // round up to account for no seconds in estimate
  // if the store is opening in > 1 hour
  if (hh >= 1) {
    return `Location will open in approximately ${hh} hour(s) and ${mm} minute(s).` // provide estimate in hours and minutes
  }
  // if the store is opening in < 1 hour
  if (hh == 0){
    return `Location will be open soon (approximately ${mm} minutes).` // provide estimate in minutes only
  }
}
// if the store is closed for the day
if (cst >= close) {
  return `This location has closed for today. Please check back tomorrow.`
}
In the above expression, Time() is used to create a variable indicating the current local time in Texas. When no parameters are provided, this function returns the current time in the time zone of the profile’s execution context. By default, this will be the time zone of your local device, or the web map time zone (if set). Because the web map time zone has already been set to Texas’ time zone (America/Chicago), the returned Time value doesn’t require any additional conversion. If the web map didn’t have a time zone specified, you would need to use the ChangeTimeZone() function to convert the time value from local time to the desired time zone.
Once we know the store’s operating hours, we can create a series of logical statements to determine if the store hasn’t opened yet, is currently open, or has closed for the day based on the current local time. Using the DateDiff() function we can determine the difference between the current time and the store’s operating hours and convert that result to an estimate in hours and minutes. Then, this value can be returned in a formatted string to display in our feature pop-ups, as seen below.

2. Date only
A similar method to the Time only example can be used to visualize layers with Date only fields, so let’s dig in.
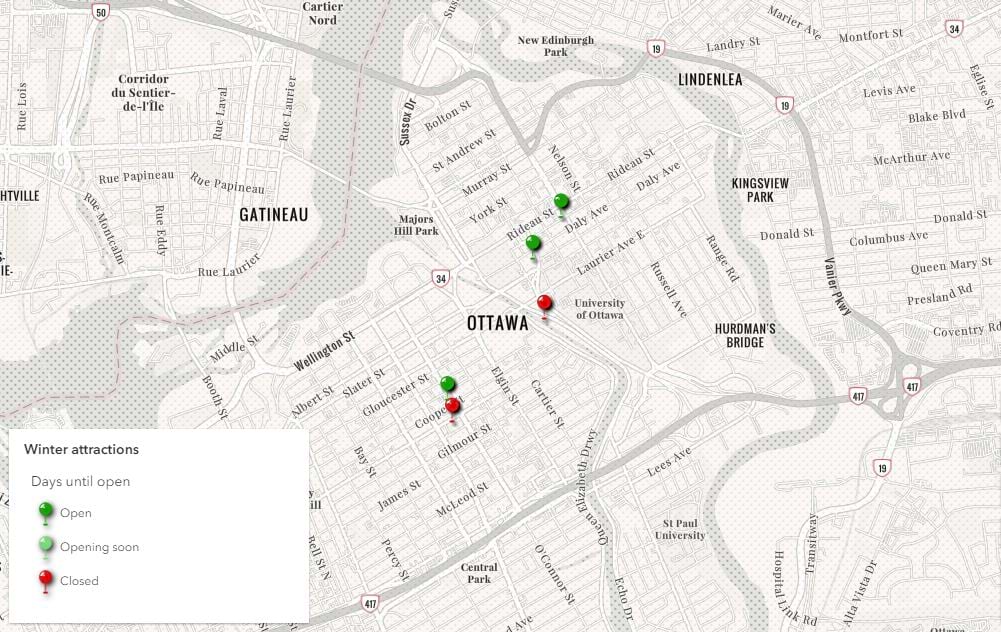
As the weather cools and snow starts to fly in Canada’s capital, residents and visitors look for some winter fun. Luckily, we’ve made a map of winter attractions found across Ottawa. The winter attractions layer has Date only fields containing opening and closing dates for each attraction. A Date only field is used because some attractions, once open, are available 24/7 so they have no associated time value. As you can see from the legend, the pins are colored based on these dates. The Arcade expression driving the layer style utilizes the DateOnly() and DateDiff() functions to compare the current date to those stored for each attraction and logically determines if the attraction is closed, opening soon, or open. This method gives viewers instant feedback on the availability of each attraction, providing them with more time (pun intended) for their next winter adventure.

// Variables containing the opening and closing days of the attraction
var openingDay = $feature.openDate
var closingDay = $feature.closingDate

// Variable containing today's date in date only format
var todaysDate = DateOnly()

// Calculate the number of days between today and opening day
var difDays = DateDiff(openingDay, todaysDate, 'days')

// Categorize feature based on date comparisons
When(
  difDays >= 15 || todaysDate > closingDay, 'Closed',
  difDays > 0 && difDays < 15,'Opening soon',
  'Open'
  );
3. Timestamp offset
If you’ve leveraged the new Timestamp offset field type in Map Viewer, you may have noticed that the value will display differently when returned in a pop-up or label. This difference is a result of the varying return types supported in different Arcade profiles.
When a Timestamp offset field is used to label features, the datetime value will return by default as unformatted, static text. This means the date and time will not respect the web map time zone, and instead will display in ISO 8601 format with the incident time shown relative to UTC. As a result, when labeling with a Timestamp offset field, we recommend performing some additional formatting to ensure dates appear as expected.
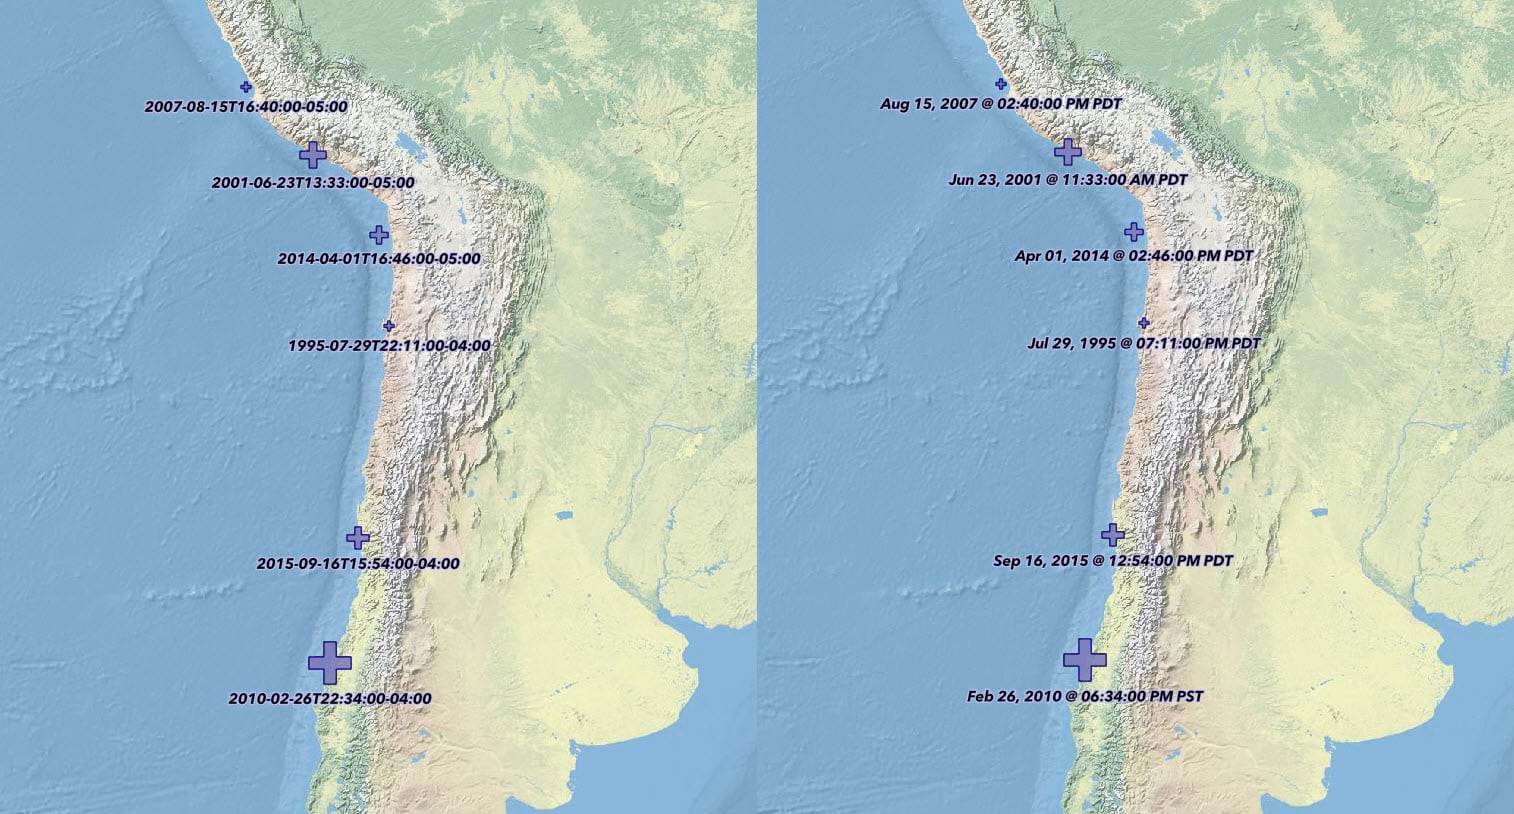
For example, the web map below displays locations of earthquakes with a magnitude equal to or greater than 8 on a global scale. The date and time each earthquake occurred is stored in a Timestamp offset field. Because our team is located on the west coast of the US, we’ve set the web map time zone to America/Los Angeles and have labeled each point with the date and time the earthquake was reported. However, the text returned to the label is hard to read and doesn’t honor the time zone of our web map.

With a few lines of Arcade, this problem is easily remedied! GetEnvironment() and ChangeTimeZone() can be used to determine the web map time zone and convert the earthquake timestamp from UTC. Once the timestamp is set to the correct time zone, Text() can be used to format how the label is returned to ensure it is readable to viewers of our map.
// get the time zone of the web map
var mapTZ = GetEnvironment().timeZone

// get timestamp of earthquake
var quakeTime = $feature.incident_recorded

// Convert earthquake timestamp to the web map time zone (America/Los Angeles)
quakeTime = ChangeTimeZone(quakeTime, mapTZ)

// Format the timestamp to be returned in the label
quakeTime = Text(quakeTime, 'MMM DD, Y @ hh:mm:ss A ZZZZ')
return quakeTime
Final thoughts
We hope this blog has shed light on how you can leverage Arcade to work with and manipulate temporal data. The examples we walked through only scratch the surface of what’s possible, so we encourage you to take what you’ve learned here and run with it. If you’re interested in learning more about managing datetime data, check out Emily’s tips and the Arcade release notes.


Commenting is not enabled for this article.