Configuring and customizing your pop-ups is a key step to authoring an engaging and informative web map. One of the simplest and most effective ways to enhance your pop-ups is by using text elements. The rich text editor in Map Viewer provides a simple interface to input and format how text, attribute expressions, and fields will display in your pop-up. In addition to the provided formatting options, the editor also supports a subset of HTML for further customization.
In the latest update of ArcGIS Online, we’ve made some exciting improvements to the rich text editor to make authoring custom pop-ups easier than ever before. Let’s take a closer look at some of the changes…
Rich text editor enhancements
Insert fields and expressions
If you’ve previously authored pop-ups in Map Viewer, you’ll likely be familiar with how to insert fields or expressions into your rich text elements. Typing an ‘{‘ into the text editor will cause a list of all available fields and expressions in your layer to appear in a dropdown menu.
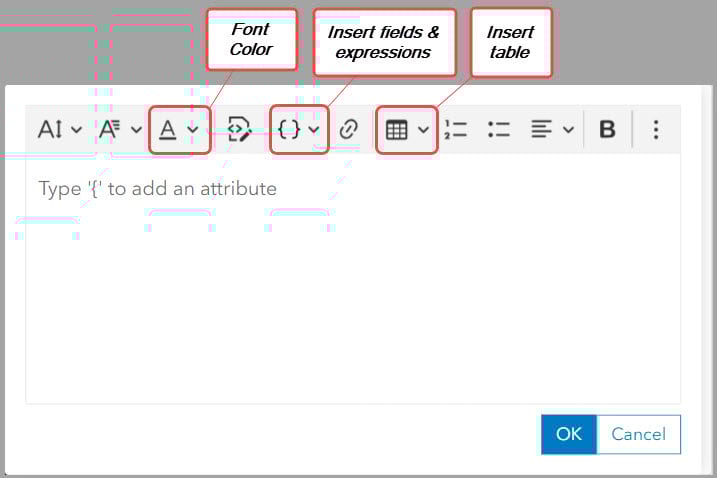
While this method is still supported, there is now a dedicated button on the editor toolbar to provide an alternative way to insert fields or expressions into your pop-up with a single click.
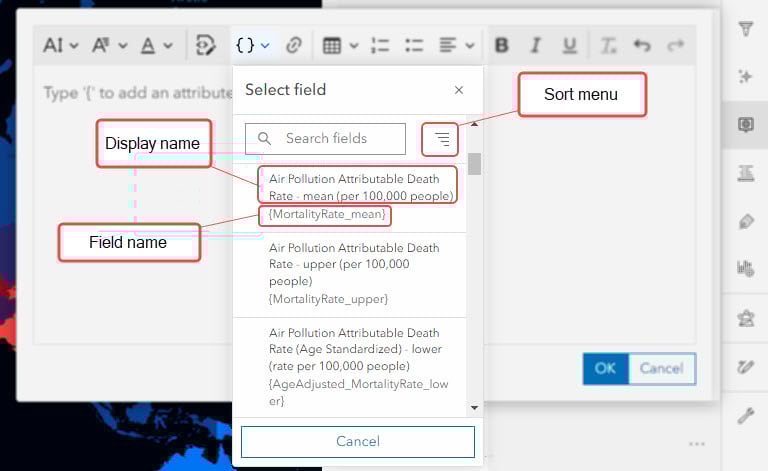
Selecting the felds list button on the editor toolbar will display all fields and expressions in your layer in a single list.
By default, any attribute expressions on the layer will display at the top, followed by the layer fields. If you already know the field or expression you want to insert, you can type in the search bar to filter the available options. Alternatively, sort the entire list by field name or display name using the Sort menu.
Change font color
Color is often used to convey meaning or importance in pop-up text. You may want to highlight a portion of text in a different color to ensure it stands out to your readers, or, match the text color in your pop-up to the feature’s symbology.
The new font color button provides you with two methods to color your text: Static or Data-driven.
Static font color
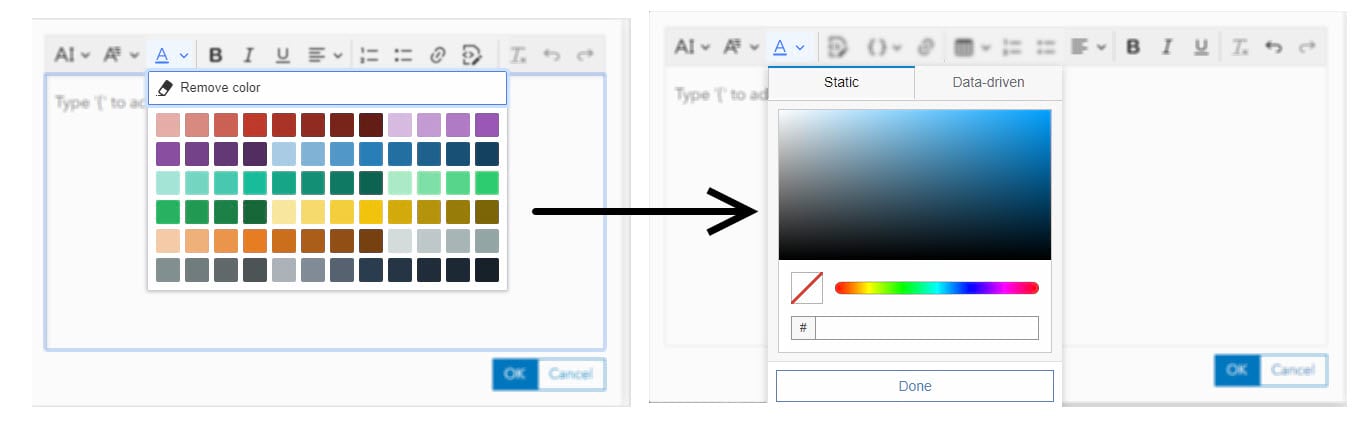
The previous color picker in the rich text editor only provided a small subset of colors to assign to your text. If you wanted to apply a color that wasn’t present in this list, you would have use HTML to assign the color to the respective text elements.
Now, the static color picker provides you with the ability to select any color for your text, no HTML required. Simply highlight the text and use the color swatch and slider to select and assign a custom color, or, directly enter a hexadecimal code corresponding to a known color value. By default, this will be the option that appears when you select the font color button from the editor toolbar.
Data-driven font color
If you’ve read some of our past pop-up blogs, you might already be familiar with how color can be conditionally applied to your pop-up text by leveraging arcade. If you haven’t already, I highly recommend pausing to read Lisa Berry’s blog on the subject here before continuing.
Previously, coloring your pop-up text with an arcade expression required you to open the HTML source view and insert the expression within the relevant style tag. Now, with the introduction of the data-driven color picker, there’s no need to edit the raw HTML.
Let’s look at how it works with an example:
Example: Data-driven font color with Arcade
I have a web map with a layer showing the average concentration of particulate matter smaller than 2.5 micrometers (PM 2.5) in the air on a global scale from 1998-2016.
In my pop-up, I want:
- countries with average PM 2.5 < 10 to display pop-up text in green,
- countries with average PM 2.5 > 10 to display in red,
- and countries with average PM 2.5 = 10 to display in orange
To achieve this, first I have to author an arcade expression that will return a value recognized by HTML, like the example shown below:
After the expression is authored, I can return to the text editor and highlight the text I want to color. Then, in the data-driven font color tab, I’ll select the expression and click Done.
In the rich text editor, you can see that the selected text is now surrounded by a dashed border, indicating that the text color is being driven by the layer’s data. If you open the source code of the pop-up, you can see that the expression reference has been automatically inserted into the pop-up’s HTML.
Now, if I select a feature I can see that the pop-up text color will dynamically change depending on the average PM 2.5 concentration for the country.
Create and format tables
Prior to this update, creating a table in the pop-up required you to open the source view and author the table structure using the applicable HTML tags. Not only is this approach time-consuming, but it requires some familiarity with HTML. Now, Map Viewer can do that work for you with the insert table button!
Select the insert table button from the toolbar and use the provided interface to specify the desired number of rows and columns for the table. Once the table dimensions are selected, it will be automatically added to the text editor.
You can then type text directly into the table, or insert fields and expressions using the new fields list button on the toolbar. Clicking the arrows that display on the top and bottom of the table’s border will insert a new paragraph above or below the table, respectively.
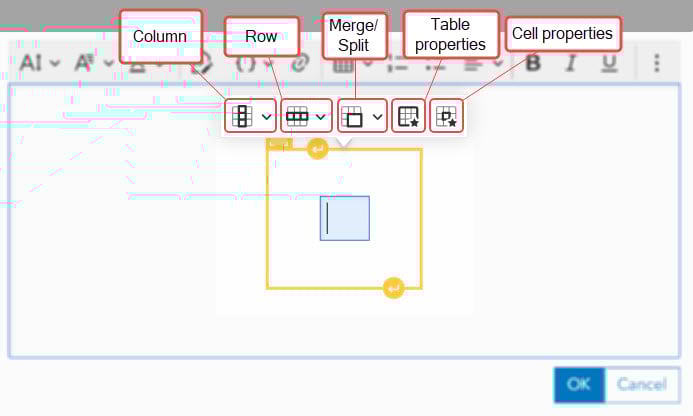
Placing your cursor anywhere inside the table will cause the formatting menu to appear, as seen above. This menu provides additional options to edit the appearance and structure of the entire table or specific cells without having to manually change the table’s HTML.
For an overview of all available formatting options in the menu, see the table below.
| Formatting option | Functionality |
| Column |
|
| Row |
|
| Merge/Split |
|
| Table properties |
|
| Cell properties |
|
**Note: The color picker used in the table formatting menu to set the border and background color provides a subset of color swatches which can be quickly applied to your table. However, hex codes, well-known color names, and RGB values are also recognized as valid inputs.
It is also important to note that you can still author tables directly in the source mode of the rich text editor. Some table formatting options – for example, setting the table width in the pop-up – will still require you to edit the raw HTML.
Conclusion
With this release of ArcGIS Online, we’ve introduced improvements and functionality to give you more control over how your pop-ups can be displayed. Inserting fields, creating tables, and assigning conditional colors to your pop-up text is now easier than ever before.
This blog covers the enhancements made specifically to the rich text editing experience in Map Viewer, but make sure to check out Lauren Ballantyne’s blog Introducing Custom Colors in Pop-up Charts to learn about more exciting new functionality in pop-ups.
What’s Next?
Keep an eye out for future improvements to the pop-up authoring experience in Map Viewer, including:
- A new and improved HTML editing and visualization experience
- Incorporation of Intellisense, autocomplete, and syntax highlighting for authoring pop-ups with HTML
All Adobe Stock images are © 2023 Adobe Stock. All rights reserved.


Hi, your article is very interesting. There’s something close to it that I’m trying to do. I’m working with an imagery layer that gives the elevation in the pop-up. I would like to give a second number with a conversion for a different elevation system (water level related). Is there a way to build an expression or to transform my number with that kind of data? I can’t see where or how to do it.