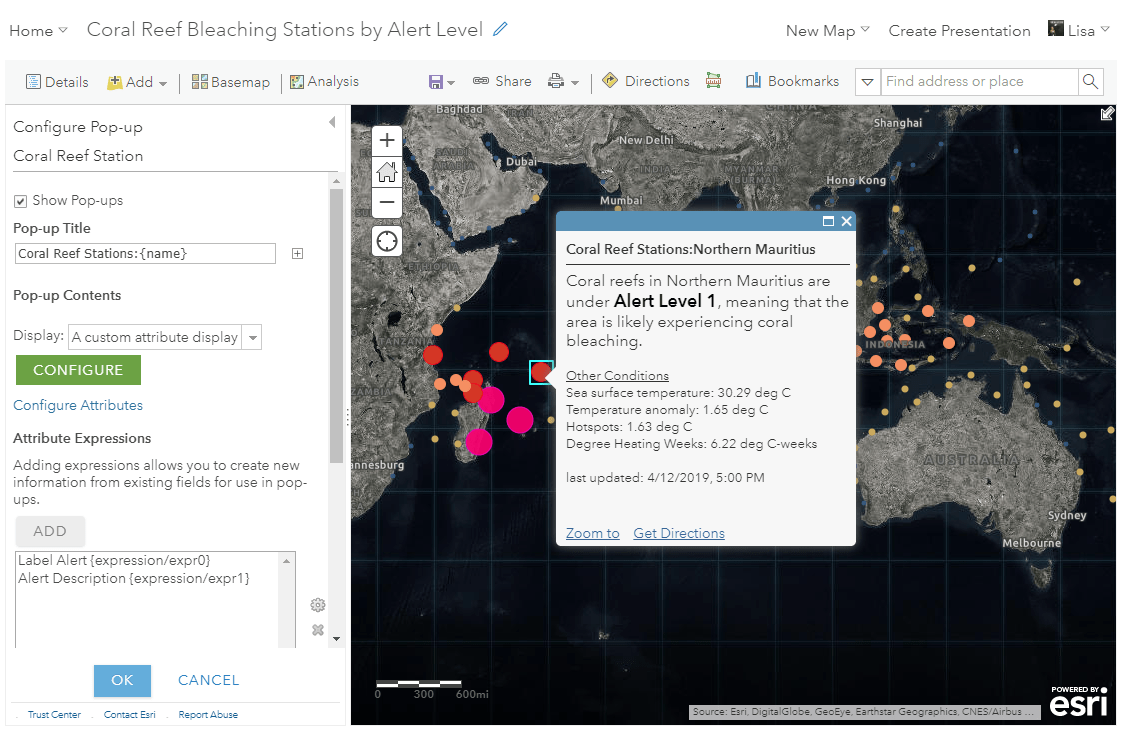
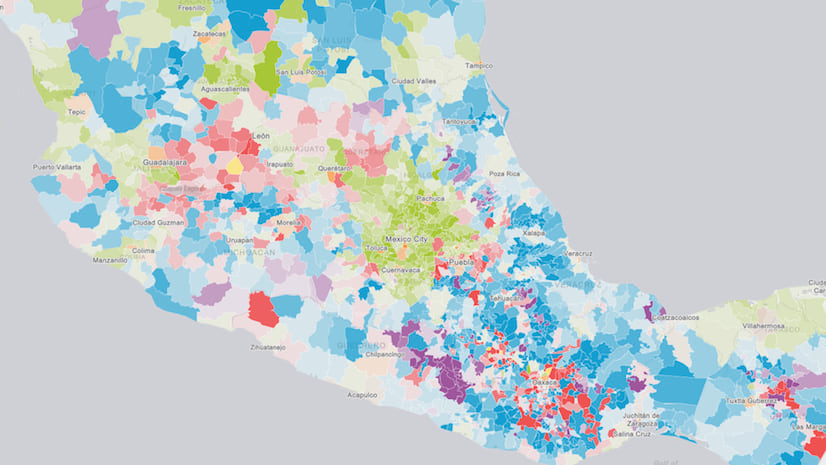
Want to make your maps easier to understand? One way to do this is to bring the colors from your map into your pop-up text. For example, this map uses this technique to show coral reef stations by the level of bleaching that is predicted to occur in different parts of the ocean. Notice how each symbol’s alert color matches the pop-up text when clicking on different stations.
This trick uses an Arcade expression within Map Viewer Classic to mimic the colors from the map into the pop-up text using hexadecimal color values. Arcade sits on top of ArcGIS in order to help you perform on-the-fly calculations in your maps. You don’t need to be a coder to write this expression, and we’ve provided some simplified steps below. It takes a few minutes to accomplish this and can greatly enhance the readability of the pop-ups within your maps and apps. It also helps reduce the necessity of a legend, especially in apps such as Cascade Story Maps.
It can be done in three easy steps:
- Get the hexadecimal color values from the map
- Build the arcade expression
- Use the arcade expression within the pop-up HTML
The map above classifies coral reef bleaching based on five different alert levels. Within the map, each of those alert levels is shown as a different color, which we will imitate in the pop-up. Let’s get started!
Step 1: Get the hexadecimal color values from the map
Hexadecimal (or hex) values specify exact shades of color, making it easy to replicate colors that appear within your map. Once you are done setting the cartography for your map, grab the hex color values from each category in your map. You can do this by going into the symbology options for the layer and getting the hex values from the color picker window.
I like to take a screenshot of my legend with each hex value so that I can easily reference it later. In the coral reef example, I have five hex values. One for each alert level.
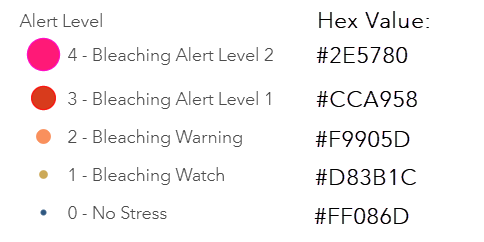
I’ll be using this as my cheat-sheet later on when writing my arcade expression.
Step 2: Build the arcade expression
Within your layer options, configure a custom pop-up calling to the field that is being mapped. This is where you’ll use the matching map color. In the coral reef map, I want to make the alert level text to be colored. This is what my pop-up looks like before I add the color:
Now, write an arcade expression that will return a hex value based on data values from your layer. Within the configure pop-up pane, choose to add a new arcade expression to get started.
In my example, I’ll match each alert level to its color. This can be accomplished using if/else logical statements for each color. Here, we are mimicking the logic that is being accomplished by the map’s symbology. Using my cheat sheet from above, I’ll write a placeholder if(){} statement for each of my five scenarios. This will make it easy for me to fill in each scenario.
Using the same field being mapped (alert level), type in the logic you want the expression to use for each scenario, and return the hex value for each if statement. For example, when my alert level is zero, I want it to return the hex code 2E578. To check if something is equal to something else, the double equal sign (==) is used. For all of the arcade logical operators, check out this part of the documentation.
The gif below shows how I built my first if statement:
Repeat this logic for each if statement until all scenarios are handled. Test the expression to confirm that the expression is returning a hex value as a string. That way it will easily be absorbed in the pop-up configuration.
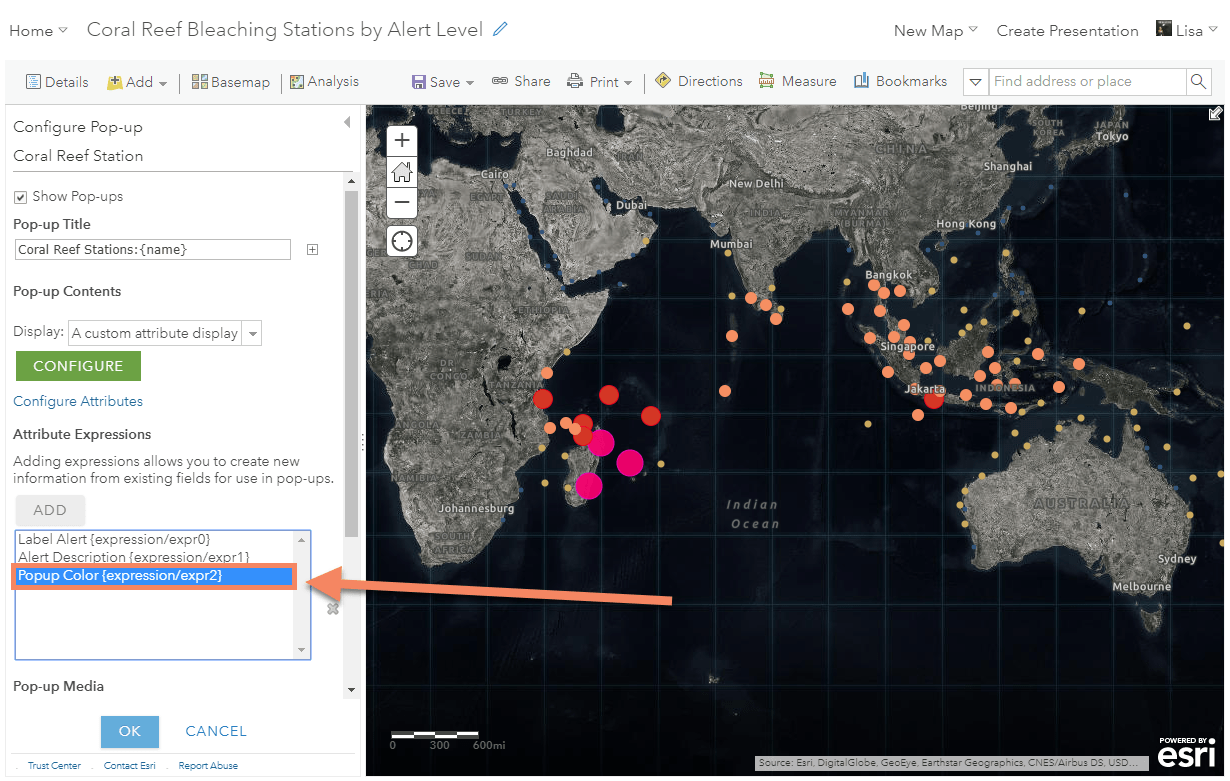
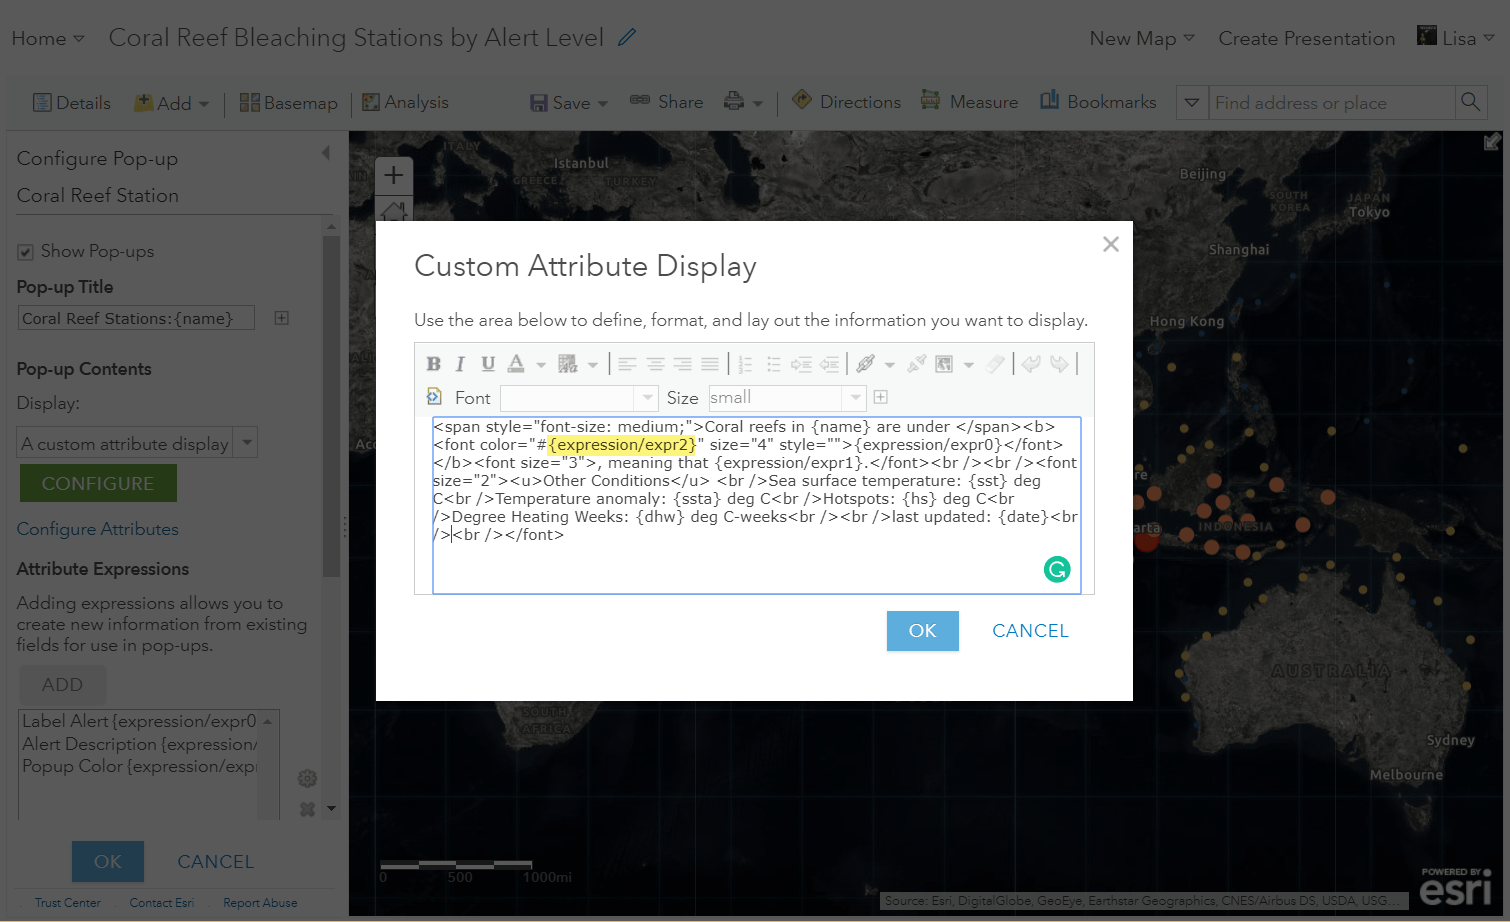
Step 3: Use the arcade expression within the pop-up HTML
Now, use the arcade expression to tell your pop-up which hex colors to use. In the pop-up configuration panel, you’ll be able to see the name of the expression you wrote. You’ll need this in step 3. Mine was called {expression/expr2}.
Now is where the magic happens. Start by going into the custom text configuration of your pop-up.
Select the text you want to be colored, and choose any color from the selector. Now, go into the HTML view of your pop-up and you’ll see where the color is defined within the HTML.
In the HTML, swap the random color hex value to be the expression we wrote. This will assign the text color based on the arcade expression. Save all of your settings and check that the pop-up works as expected.
Now, you’re pop-up is easier to understand (and it looks cool, too). To check out the final map and arcade statements, click here. You can also check out the Living Atlas dashboard and layer that inspired this blog.
Concluding thoughts
- There are alot of ways you can write your arcade expressions. Every dataset is different so every arcade statement will be unique to your data. If your colors fall between a range of data values, you’ll need to use different logical operations (<, >, ||, &&, etc).
- The example in this blog shows a unique category map, but this technique would also work with a classified thematic map, predominance, or even a relationship map. The arcade statements for those styles would be a little different. Check out this map for a predominance example. Within this example, click “Modify Map” at the top right and then view the arcade expressions within the popup configuration of the layers.
- Keep in mind that light colors such as yellow may not work great for text colors.
- To save time, I would suggest waiting to do this step last when creating your web map. That way you won’t have to go back and change the arcade statement if any colors change in your map.
Happy mapping!

Thank you, this was very helpful
Any chance we could get an article on how to do this in arc gis pro
@Lisa – is there any way we can get this functionality into labeling in AGOL? I have arcade expressions all over my source maps for publishing, come to find out that labeling in arcade using HTML tags to change text colors isn’t supported.