Below is a summary from the 2026 Esri Developer & Technology Summit presentation titled ArcGIS Apps: Enhancing Accessibility and Localization, where content examined a squirrel observation workflow. The data collection workflow previously relied on manual translation supporting English and Spanish locales. Over time the project evolved to support continuous squirrel data collection, manual data translations, alternative text validation, and locale‑specific formatting the workflow became cumbersome and unsustainable, while also introducing errors. Automation became necessary to ensure accessibility and internationalization could scale with data collection, enabling a near real‑time experience and shifting these requirements from reactive cleanup to built‑in system behavior.

Building on the techniques outlined in Optimize Your Popups for Accessibility and Internationalization, we’ll highlight strategies and patterns presented from our Enhancing Accessibility and Localization session you can use to consider accessibility and localization including:
- Pop-up formatting techniques using ArcGIS Arcade expressions to support broader access
- Automation processes from ArcGIS Survey123 to accommodate assistive technologies and locales
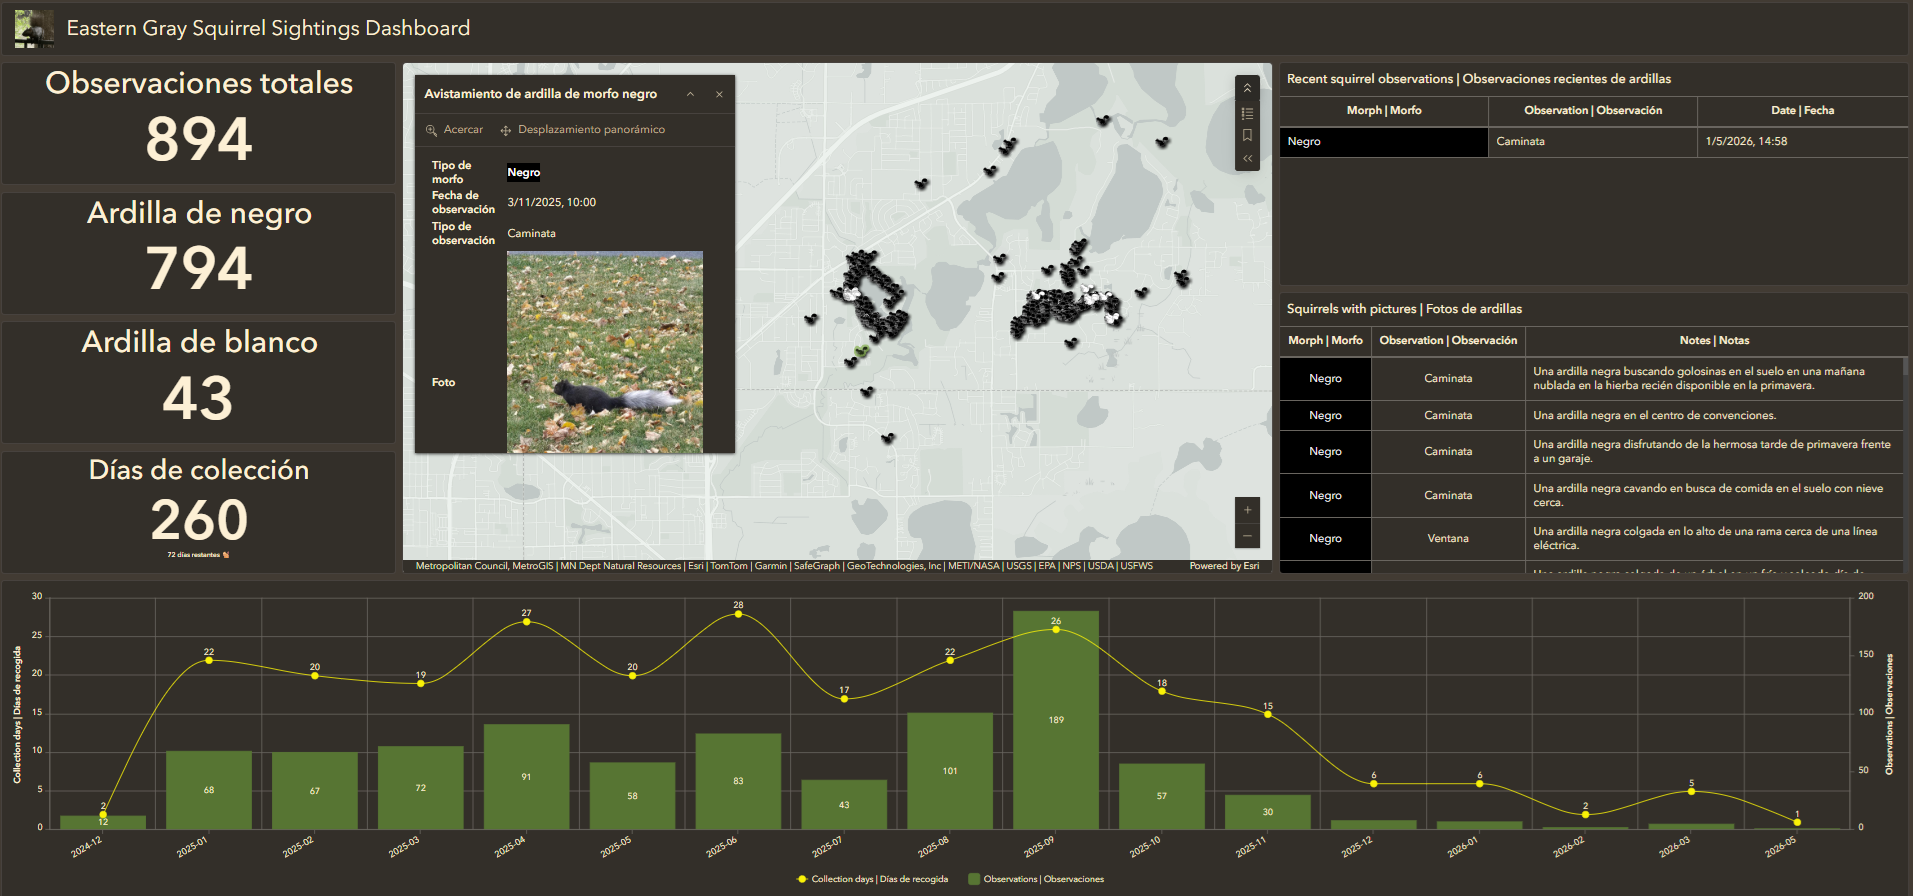
- Configuration of multiple locales using ArcGIS Arcade expressions in an ArcGIS Dashboard
Considerations for accessibility and internationalization
The following foundational principles benefit both accessibility and internationalization:
- Organized structure
- Predictable content order
- Clear formatting to support assistive technologies and locales
- Explicit labels
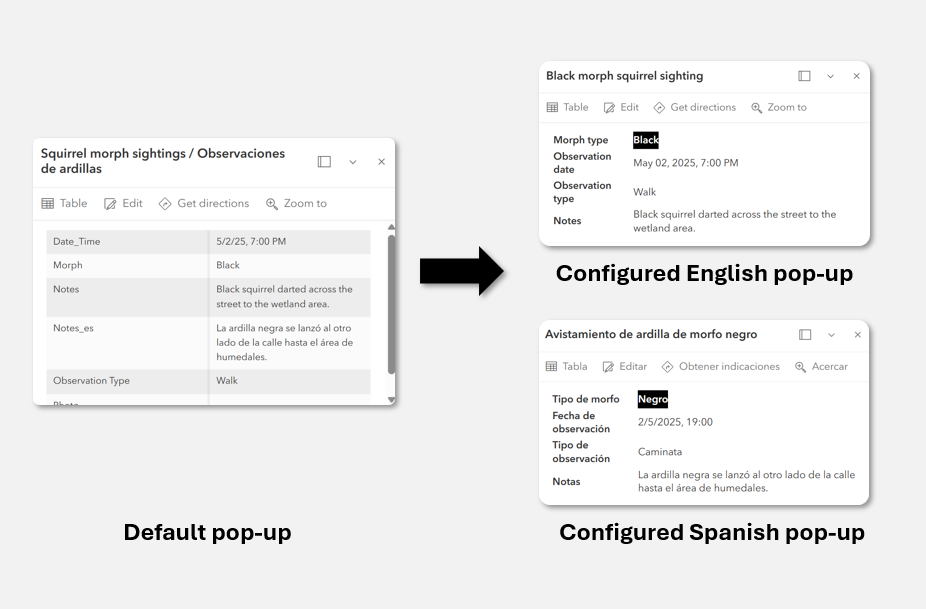
For instance, consider the design of your app’s pop-ups, which sit at the intersection of data, presentation, and interaction. Pop-ups are a natural starting point for designing your content that is accessible and adaptable across locales.
Building better pop-ups with Arcade
A well-designed pop-up provides crucial information and greater access to more individuals. ArcGIS Arcade can help structure and support your content most effectively with the following strategies:
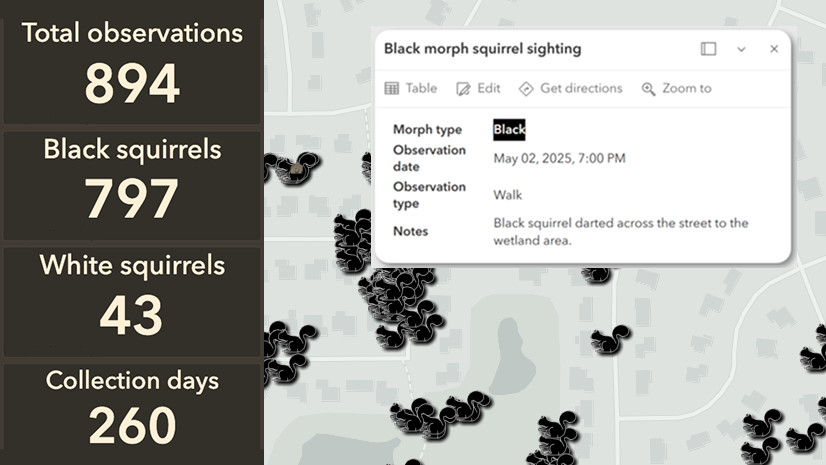
- Pairing labels with values rather than relying on visual formatting
- Using
GetEnvironment("locale")to return language-specific text - Formatting dates and numbers based on locale
- Presenting pop-up content in table structures for assistive technologies
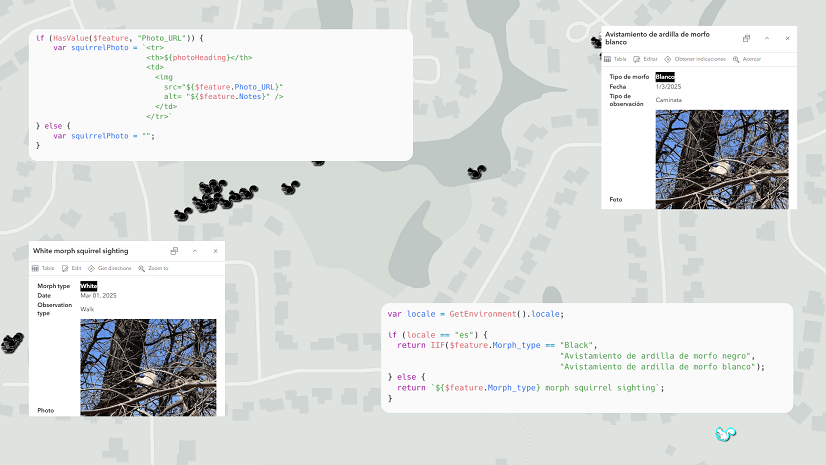
Instead of creating multiple maps or pop-ups, a single configuration on your pop-up can adapt dynamically to the user’s locale.
This approach builds directly on the techniques outlined in Optimize Your Popups for Accessibility and Internationalization, which explores how ArcGIS Arcade can be used to structure pop-up content for assistive technologies, while also supporting locale-aware formatting and multilingual experiences.
Enforcing accessibility at data entry
Accessible apps start with accessible data, and data entry is one of the most important places to design for inclusion. The next generation form of ArcGIS Survey123 improves accessibility support for data entry. The new form strengthens accessibility principles through:
- Clear structure with supporting labels, roles, and values
- Communicating states and displaying required and invalid states
- Displaying input focus and progression through the form
These improvements benefit assistive technologies, keyboard users, and individuals relying on cognitive accessibility cues, while also improving the form’s overall usability. In the form, the presence of an uploaded image can dictate when an optional text field becomes required. This ensures that an individual filling out the form will provide alternative text for their image, which provides important context about the visuals to those using assistive technologies.
Scaling with automation
Manual workflows for accessibility and localization break down quickly as applications grow, which is especially true for crowdsourced data collection where new content is added regularly. Relying on human intervention to translate text, validate alt text, or format content per locale leads to delays, inconsistencies, and missed requirements.
In the automation pattern presented at the 2026 Esri Developer & Technology Summit in the session ArcGIS Apps: Enhancing Accessibility and Localization, we demonstrated how event‑driven workflows can reduce manual effort while consistently enforcing accessibility and localization requirements across the application lifecycle.
Architecture at a glance
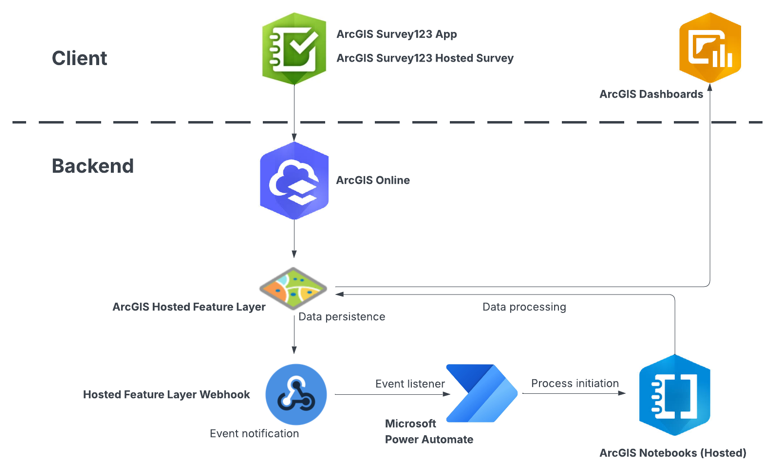
To design an app using an event-driven automation workflow that takes the form submission and sends it to a dashboard, consider the following actions:
- Consider the data entry where a user submits a record through ArcGIS Survey123
- Create an event trigger for the hosted feature layer that fires an on‑create event
- Implement a workflow using a webhook through an event trigger using Microsoft Power Automate
- Provide processing through ArcGIS Notebooks to translate text, validate alternative text, and apply locale‑aware formatting
- Generate an output of localized, accessible attributes written back to the hosted feature layer
- Update the visualizations in the map and dashboard using the same dataset
Triggering the automation
Automation is triggered once a new survey response is recorded and the hosted feature service in ArcGIS Online emits an event. The event is then captured by a webhook, which initiates an automated process using Microsoft Power Automate.
Power Automate acts as the orchestration layer rather than the place where complex logic lives. The payload sent through the webhook is intentionally minimal. It signals that a new survey was submitted without attempting to pass large geometries, attachments, or attribute blobs. This keeps the workflow reliable and avoids failures due to oversized or complex payloads.
Processing and enriching data
Once the automation is triggered through Microsoft Power Automate, ArcGIS Notebooks performs the heavy lifting, where the notebook:
- Retrieves the newly created feature
- Translates relevant text fields to supported languages
- Applies locale-aware formatting for dates and numbers
- Validates the presence of alternative text where images are attached
- Writes the localized attributes back to the hosted feature layer
The custom logic resides in a squirrels automation notebook, where it can be maintained and extended over time. This configuration also allows accessibility and localization rules to change without rewriting the orchestration layer.
The result is a near real-time experience, which consistently produces data optimized for accessible maps, pop-ups, and dashboards. More importantly, automation does not eliminate the need for human oversight. Machine translation still benefits from review, and accessibility requires judgment that cannot always be automated.
Building an inclusive dashboard experience
In Part 2: Increasing Accessibility and Internationalization in your ArcGIS Apps, we’ll take a closer look at how this accessible, localized data is surfaced in ArcGIS Dashboards, and how to use techniques for locale‑aware indicators, tables, and assistive technology support without duplicating a dashboard or your data.


Commenting is not enabled for this article.