The new Time Series Forecasting toolset in ArcGIS Pro 2.6 brings a variety of ways for you to forecast and evaluate your space-time data. During the 2020 User Conference, Lauren Bennett demonstrated using this toolset to analyze the cumulative and daily confirmed cases of COVID-19. The Time Series Forecasting 101 series will help you understand the whole workflow behind the demo and recommend useful approaches to data preparation, model fitting, and interpretation. This first blog article of the series covers the first part for every analysis – data preparation.

Introduction
Forecasts have been key to responding to COVID-19. There are so many ways to model and forecast cases, including the epidemiological models that many of us have leveraged. Most of the models consume not only the daily new confirmed cases or cumulative confirmed cases, but also some explanatory variables like population, hospitalization rate, doubling time, interventions like social distancing, etc. Alternatively, we can use another approach that focuses on modeling patterns and trends in time-series data. More specifically, the data that will be used is a collection of historic records, observations, or measurements taken over a period of equal time intervals.
To use the Time Series Forecasting toolset, we need to convert the raw time-series data into a space-time cube. In this blog, we’ll demonstrate how to use ArcGIS Notebooks in Pro to create a Space-time Cube containing cumulative confirmed cases and daily new confirmed cases of COVID-19 at the US county level.
Data preparation
The raw data we are using are two CSV files downloaded from USAFacts: cumulative confirmed cases and cumulative deaths from COVID-19 for each county in the US. The format of the original table downloaded from the website is shown on the left in Fig 1, and the format of the table we need to use as the Related Table in the Create Space Time Cube From Defined Locations tool is shown on the right in Fig 1.
So how did we prepare this data? We created an ArcGIS Notebook in Pro and use pandas to do the data engineering work. You can download the notebook, features of US county polygons, and a space-time cube sample compacted in the ZIP file, and add both to a new ArcGIS Pro project. Then you can open the notebook from Catalog, modify the workspace if necessary, and reproduce the workflow using the most recent data from the website. Here we highlight the key steps in the data preparation process that the notebook covers:
- Stack the CSV table we downloaded from USAFacts.
- Calculate a new field daily new confirmed cases based on the original cumulative cases, which is the difference of cumulative cases between today and the day before.
- Calculate a 7-day simple moving average to smooth out the data, removing noise caused by spikes in testing results.
Other useful processing tasks that would be possible to achieve by customizing this notebook include:
- Process the death cases following the steps above, the data is available on the USAFacts website as well.
- Create a subset of the data for selected counties or states.
- Create a subset of the data for a selected time period.
- Calculate different types of moving average, like Exponential Moving Average which gives higher weight to more recent data.
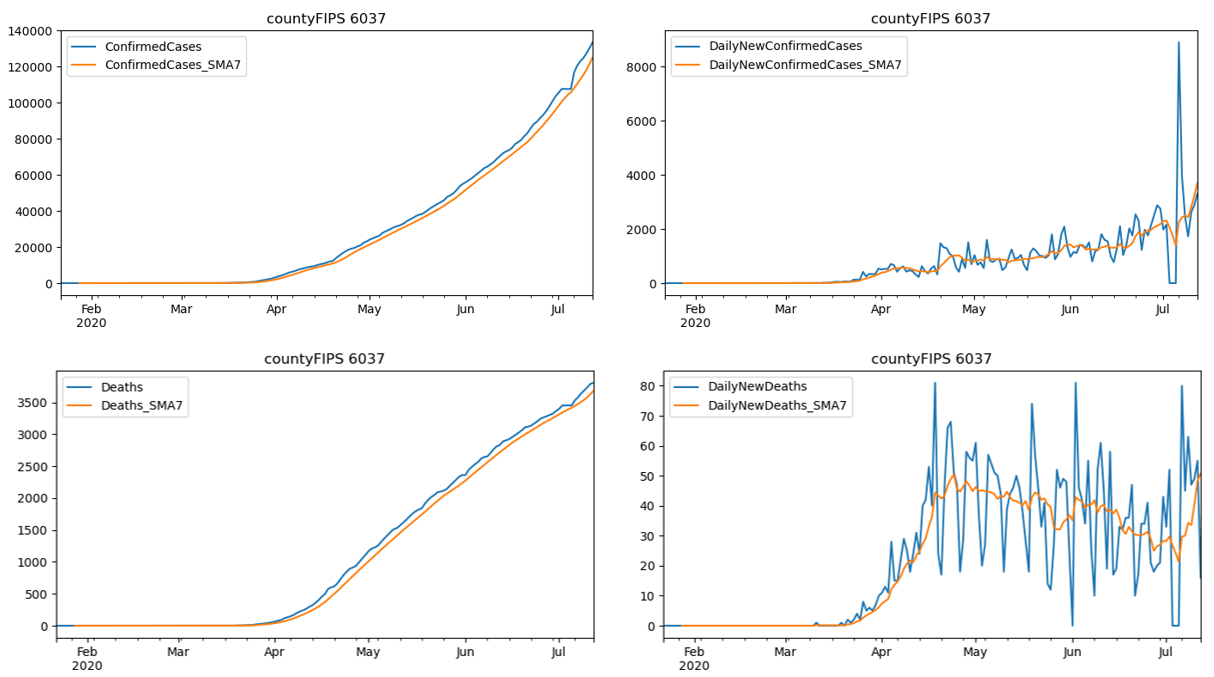
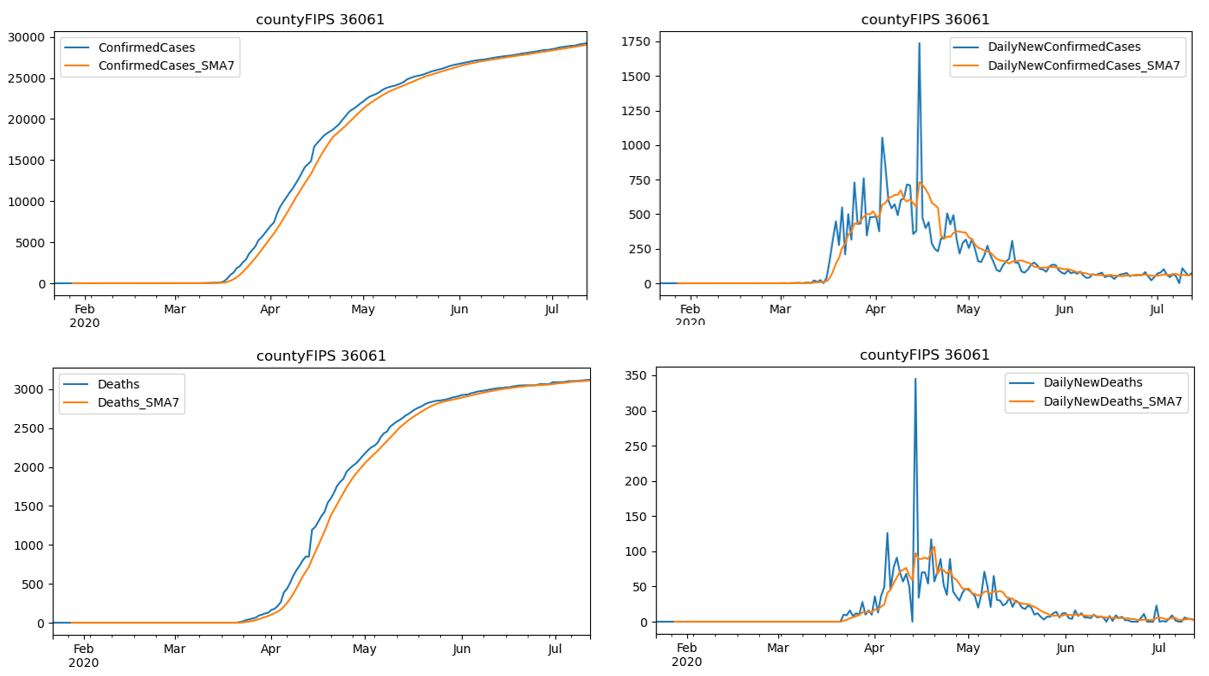
Here are examples of what the 7-day moving average looks like compared to the reported data, one for Los Angeles County, California in Fig 2, the other for Manhattan, New York City in Fig 3. The 7-day moving average is in orange, and the reported data is in blue. Four different variables are plotted: cumulative confirmed cases, daily new confirmed cases, cumulative deaths, and daily new deaths. The time period in which the data is reported is from Jan 22 to July 12, 2020. As shown in the plots, it’s not necessary to apply moving average on the cumulative data, but very important to apply on the daily new data.
Now we have generated a CSV file containing all the data we need, the next step in the ArcGIS Notebook in Pro is defining a function to add the CSV file to Table of Content, Export Table to DBF so that an OBJECTID field is added, and use the DBF to create a cube through the Create Space Time Cube From Defined Locations tool. And then every time you need to create a space-time cube from the CSV file, you just call this function instead of writing three arcpy commands. If you want to migrate this function to another dataset, you may need to manually run the Create Space Time Cube From Defined Locations tool to get the arcpy command with your Input Features and Variables and modify the arcpy command for this tool inside the function accordingly. You can check out how to run it step-by-step in UI in part 4 of this article series.
Key takeaway
The best part about creating an ArcGIS Notebook in Pro to do data preparation is that, as the website updates the data frequently, you can re-download the CSV file, run all cells to automate the whole process, and the space-time cube will be ready for you! The rerun won’t overwrite previous cubes since the last date of the data is included as a suffix in the cube name. We can also share the notebook to someone else, who may be not very experienced with python scripting, but wants to analyze the COVID-19 data using the most up-to-date data with the Space Time Pattern Mining tools.
If you want to skip all the data processing and just grab a cube that is ready for use in the Time Series Forecasting tools, a space-time cube sample with COVID-19 time-series data is also included in the same ZIP file.
Now we have the cube, the next question is which forecast method or methods are most suitable for daily new confirmed cases, and which are more appropriate for cumulative confirmed cases? Let’s start with forecasting daily new confirmed cases of COVID-19 in part 2 of this blog series.

Article Discussion: