Density maps are often integrated into larger workflows, and it is one of the first steps toward a decision. It helps identify where activity is concentrated and where action may be needed. The traditional Kernel Density tool estimates these patterns from observed points with a smooth surface that shows where activity concentrates. However, many datasets also carry information about their own reliability. Observation counts could be estimates with margins of error, locations come with accuracy measures, and records cover only part of what happened on the ground. The new Probabilistic Kernel Density tool in ArcGIS Pro 3.8 incorporates this uncertainty directly into the density estimation process, helping quantify how uncertainty in the input data influences the resulting density patterns.
A probabilistic approach to density analysis
Probabilistic Kernel Density incorporates uncertainty in attribute values, locations, and sampling directly into point pattern analysis. By running density analysis many times (called simulations), it produces three outputs: mean density, which is the best overall estimate; standard deviation, which highlights where density estimates vary most; and exceedance probability, which identifies locations that consistently rank among the highest-density areas. Because uncertainty sources can be evaluated individually or combined together, the tool can also identify which sources of uncertainty have the greatest influence on the results.
Example: Prioritizing koala habitat in New South Wales
The koala is one of Australia’s most iconic species and is now endangered in New South Wales (NSW). Habitat loss from land clearing, the 2019–2020 Black Summer bushfires, and prolonged drought have contributed to population declines across the state. To help reverse this trend, the NSW Koala Strategy aims to double koala numbers by 2050. Achieving that goal requires reliable information on where koalas are most likely to be found and where conservation efforts can have the greatest impact.
Zooming in on New South Wales
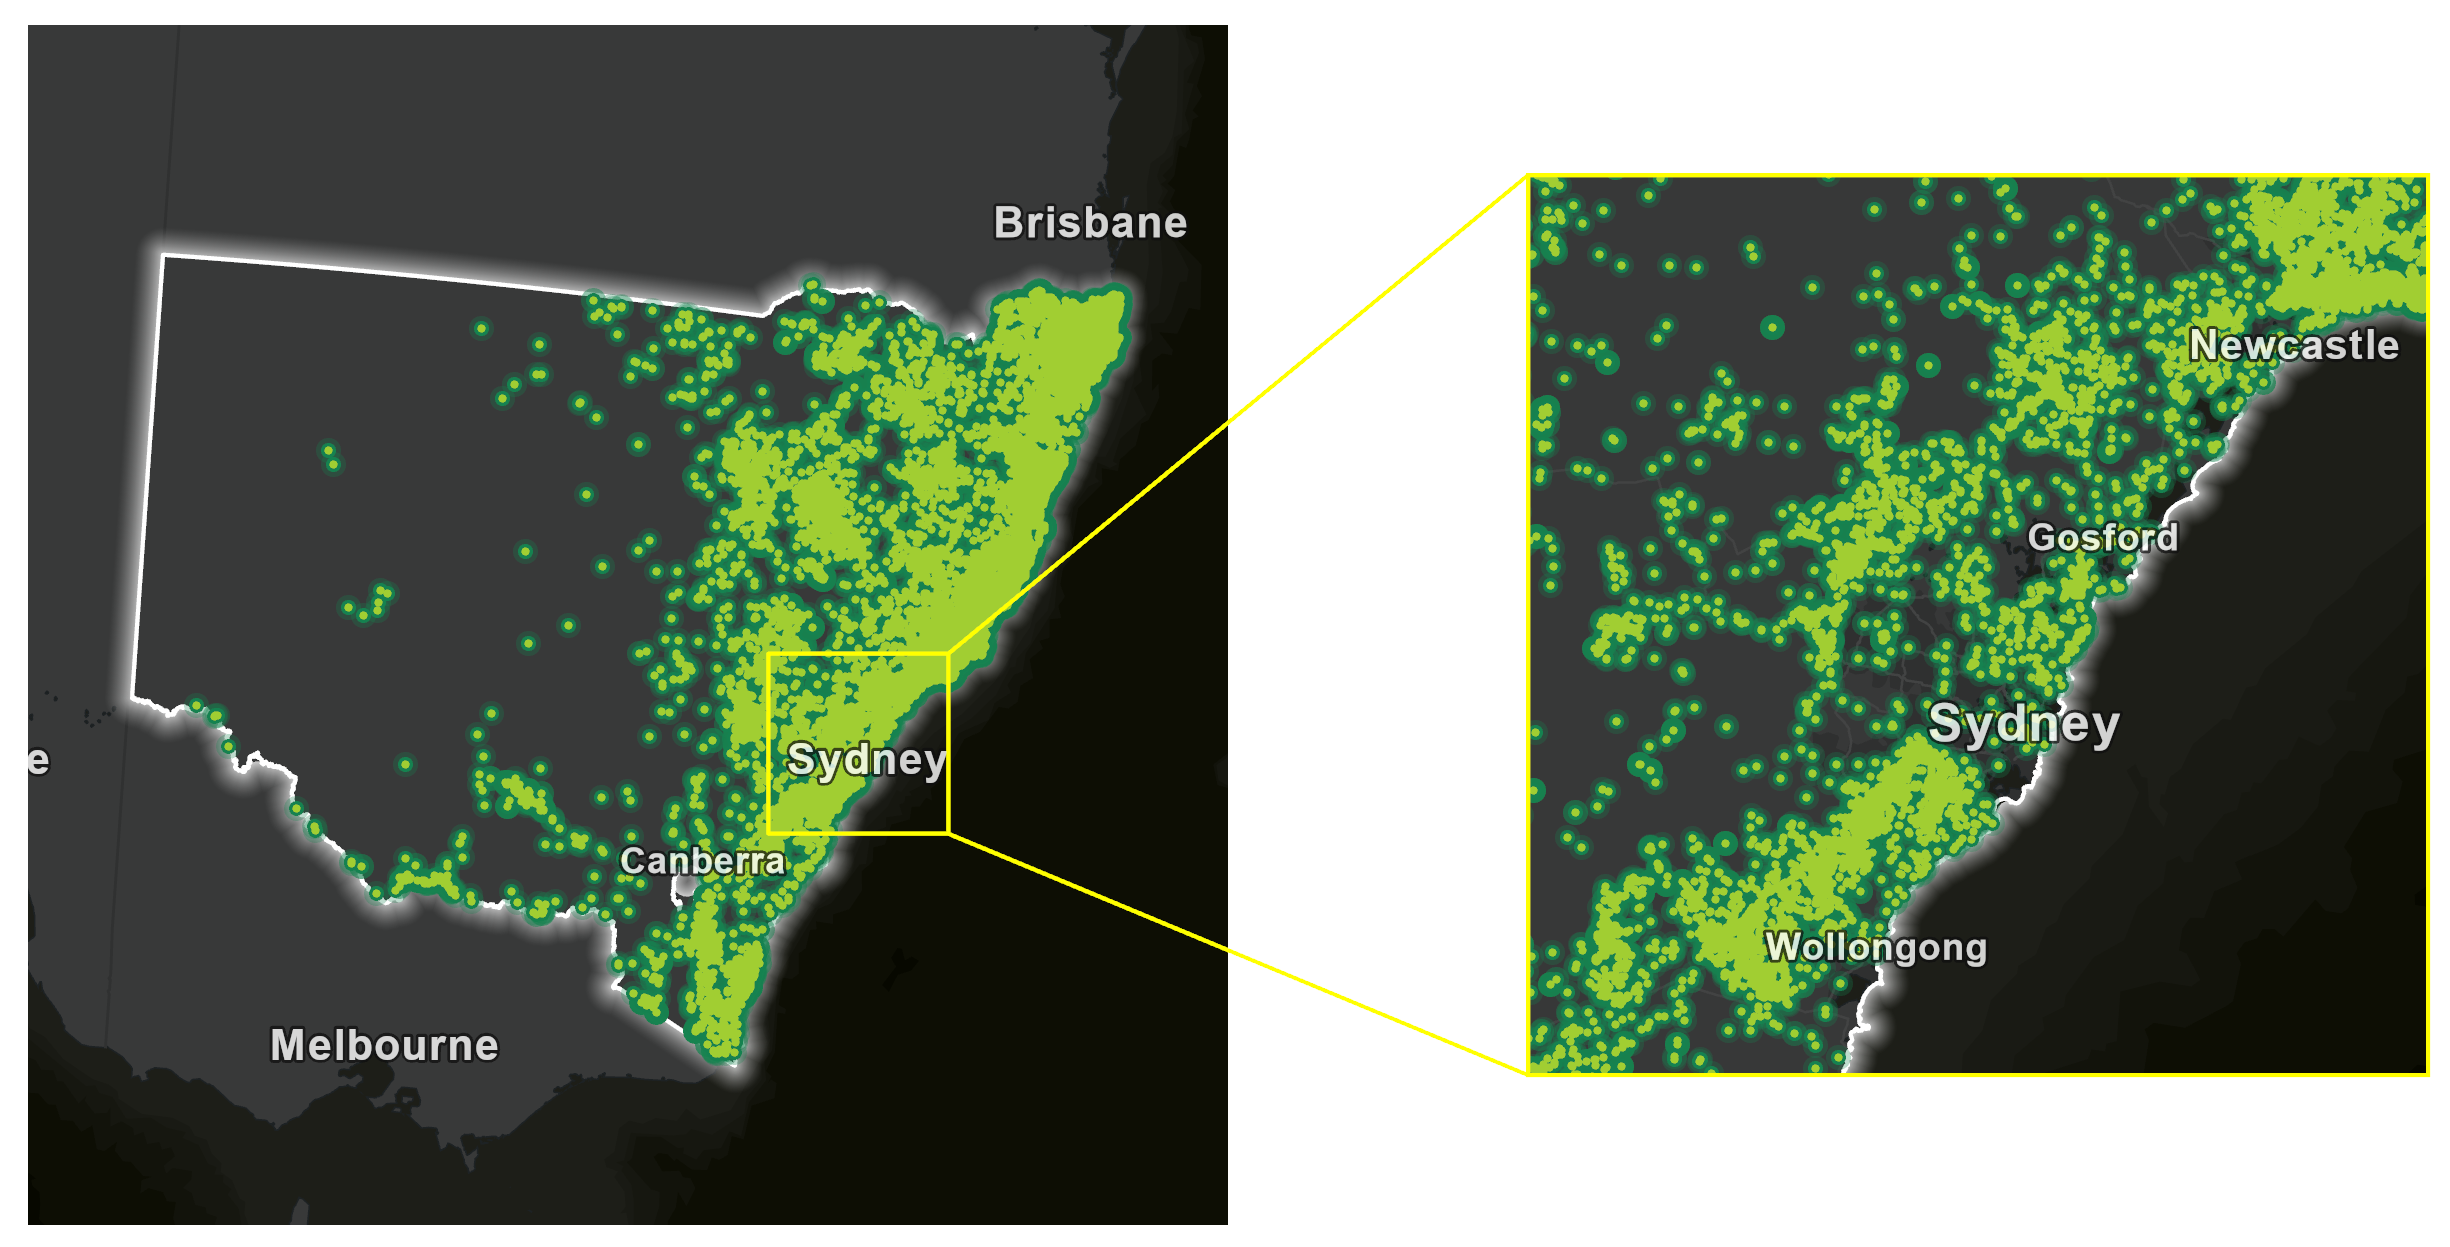
Koala records were obtained for eastern Australia and filtered to NSW. The selected records were projected to NSW Lambert, a coordinate system that uses meters, ensuring that distance-based analyses such as kernel density are performed accurately.
Observations behind the analysis
Koala occurrence records were obtained from the Global Biodiversity Information Facility (GBIF) using the Download Species Occurrence Points (GBIF) tool. Each record represents an observation of one or more koalas at a reported location. The analysis uses the observation location, individualCount (the number of koalas reported), and coordinateUncertaintyInMeters (the reported location uncertainty). Because location precision varies among records and reported counts may not always be exact, both location and count uncertainty can influence density estimates. The records also represent reported observations rather than a complete census. As a result, some areas may be represented by more observations than others because of differences in survey and reporting activity.
Map koala density
To map koala density, complete the following steps:
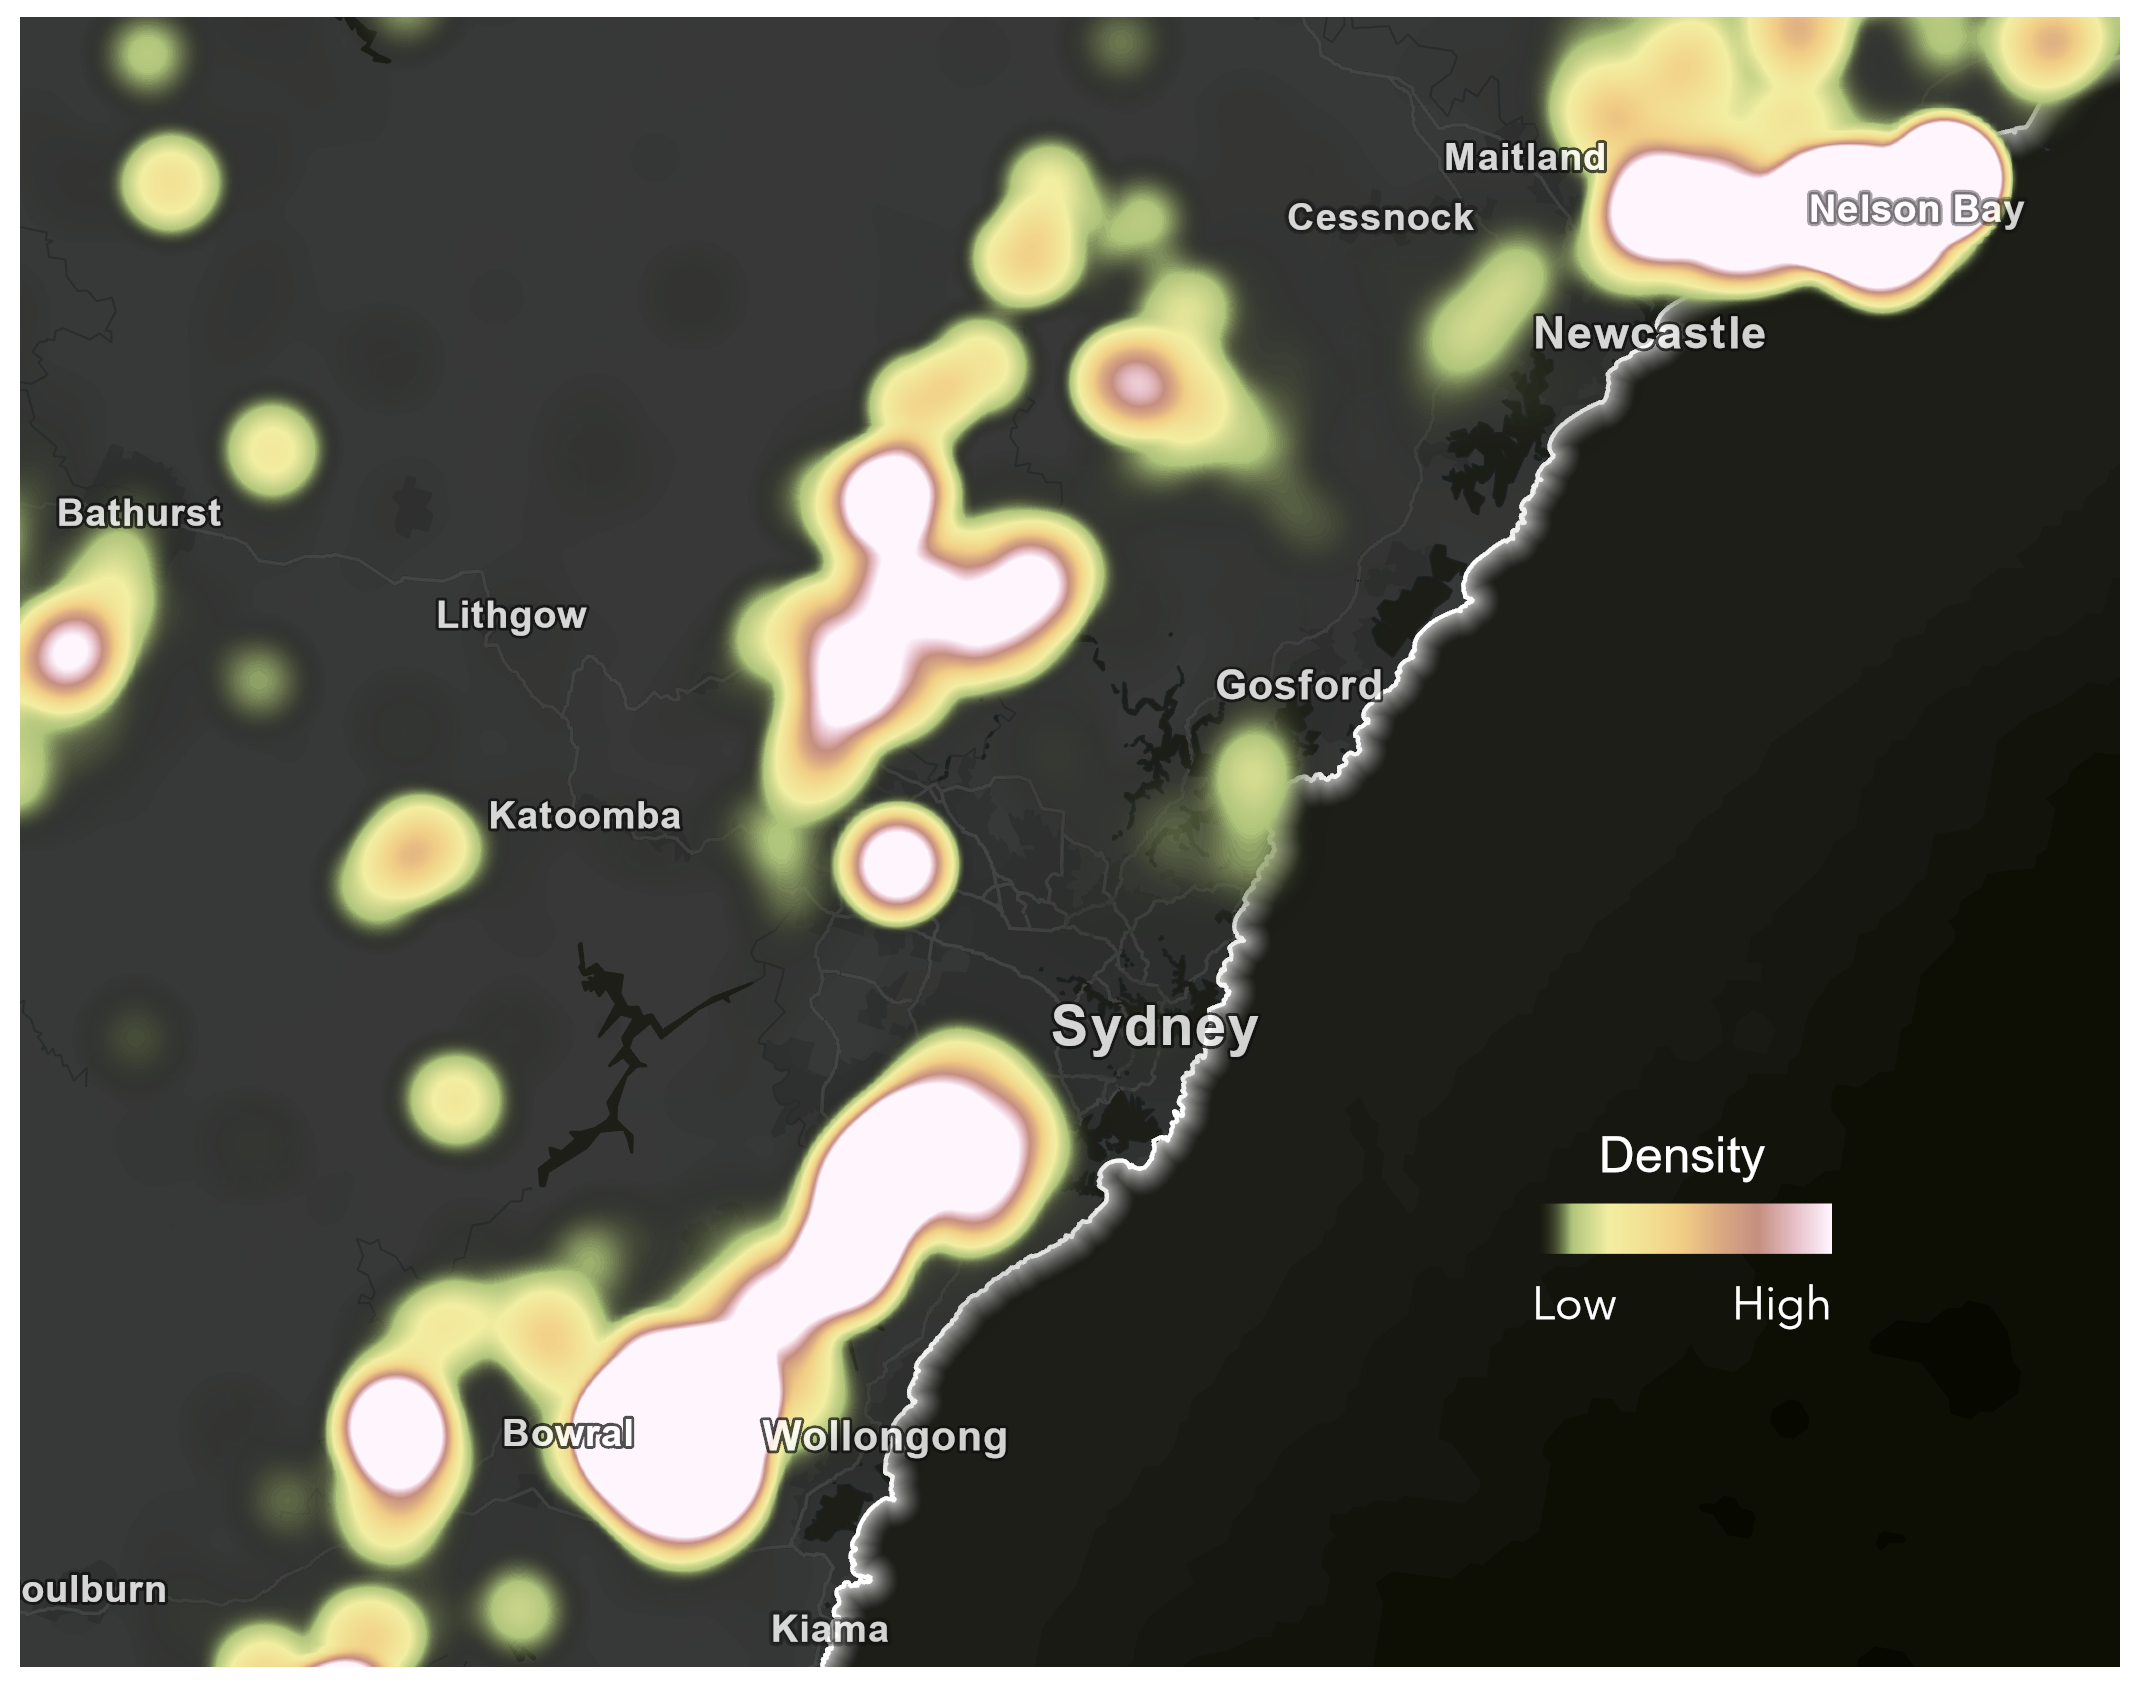
1. In ArcGIS Pro, run the Kernel Density tool on the GBIF data obtained by the Download Species Occurrence Points tool, using individualCount as the population field and a search radius of 1,000 meters.
The resulting surface highlights several areas of elevated koala density that may be suitable candidates for conservation. Based on the density map alone, each appears equally important.
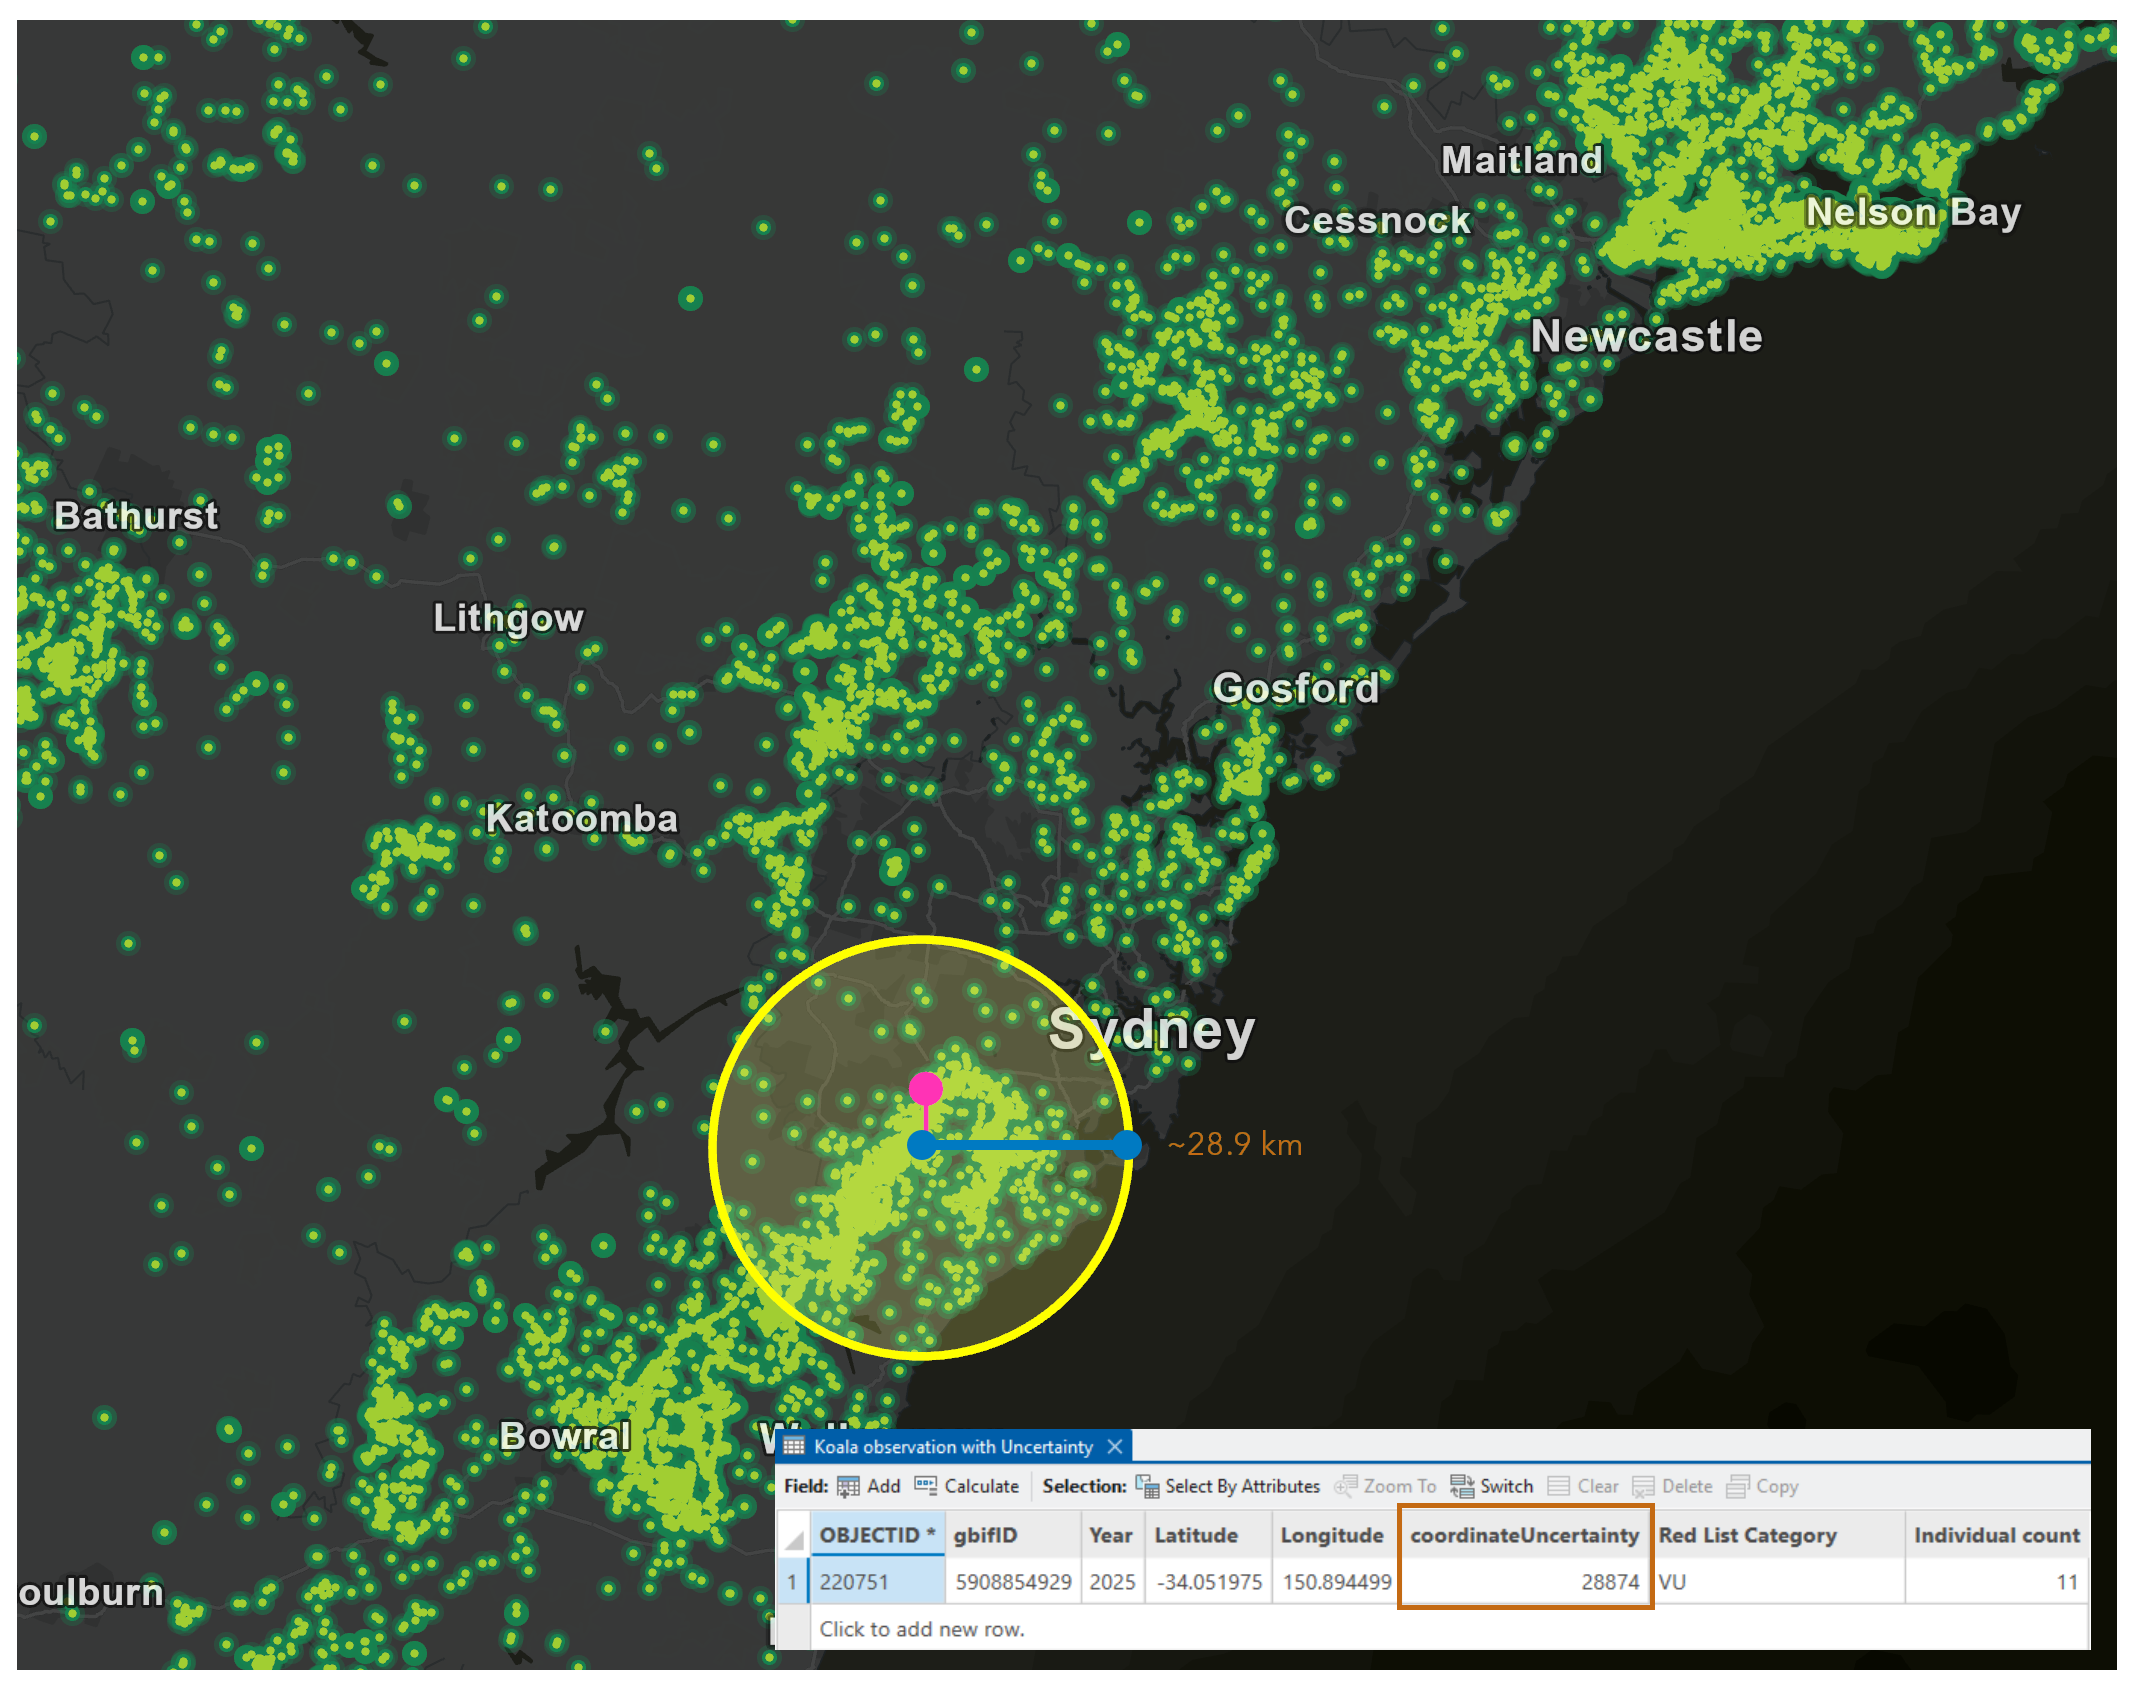
2. Examine location uncertainty by reviewing the coordinateUncertaintyInMeters field in the attribute table.
Each record stores an estimate of its location uncertainty. Across all observations, values range from a few meters for GPS-recorded observations to several kilometers for records derived from locality descriptions. Probabilistic Kernel Density incorporates this information directly into the density estimate.
3. To convert uncertainty into a location displacement factor, divide the median reported location uncertainty by the search radius.
A median uncertainty of 120 meters and a search radius of 1,000 meters produce a factor of 0.12. The factor is derived from the data rather than an assumed value.
4. Run Probabilistic Kernel Density with the same population field and search radius as in Step 1 and the following parameters:
- Enable Location, Attribute, and Sampling uncertainty options.
- Set the location displacement factor to 12.
- Use a 15 percent attribute error with a lognormal distribution.
- Run 200 simulations.
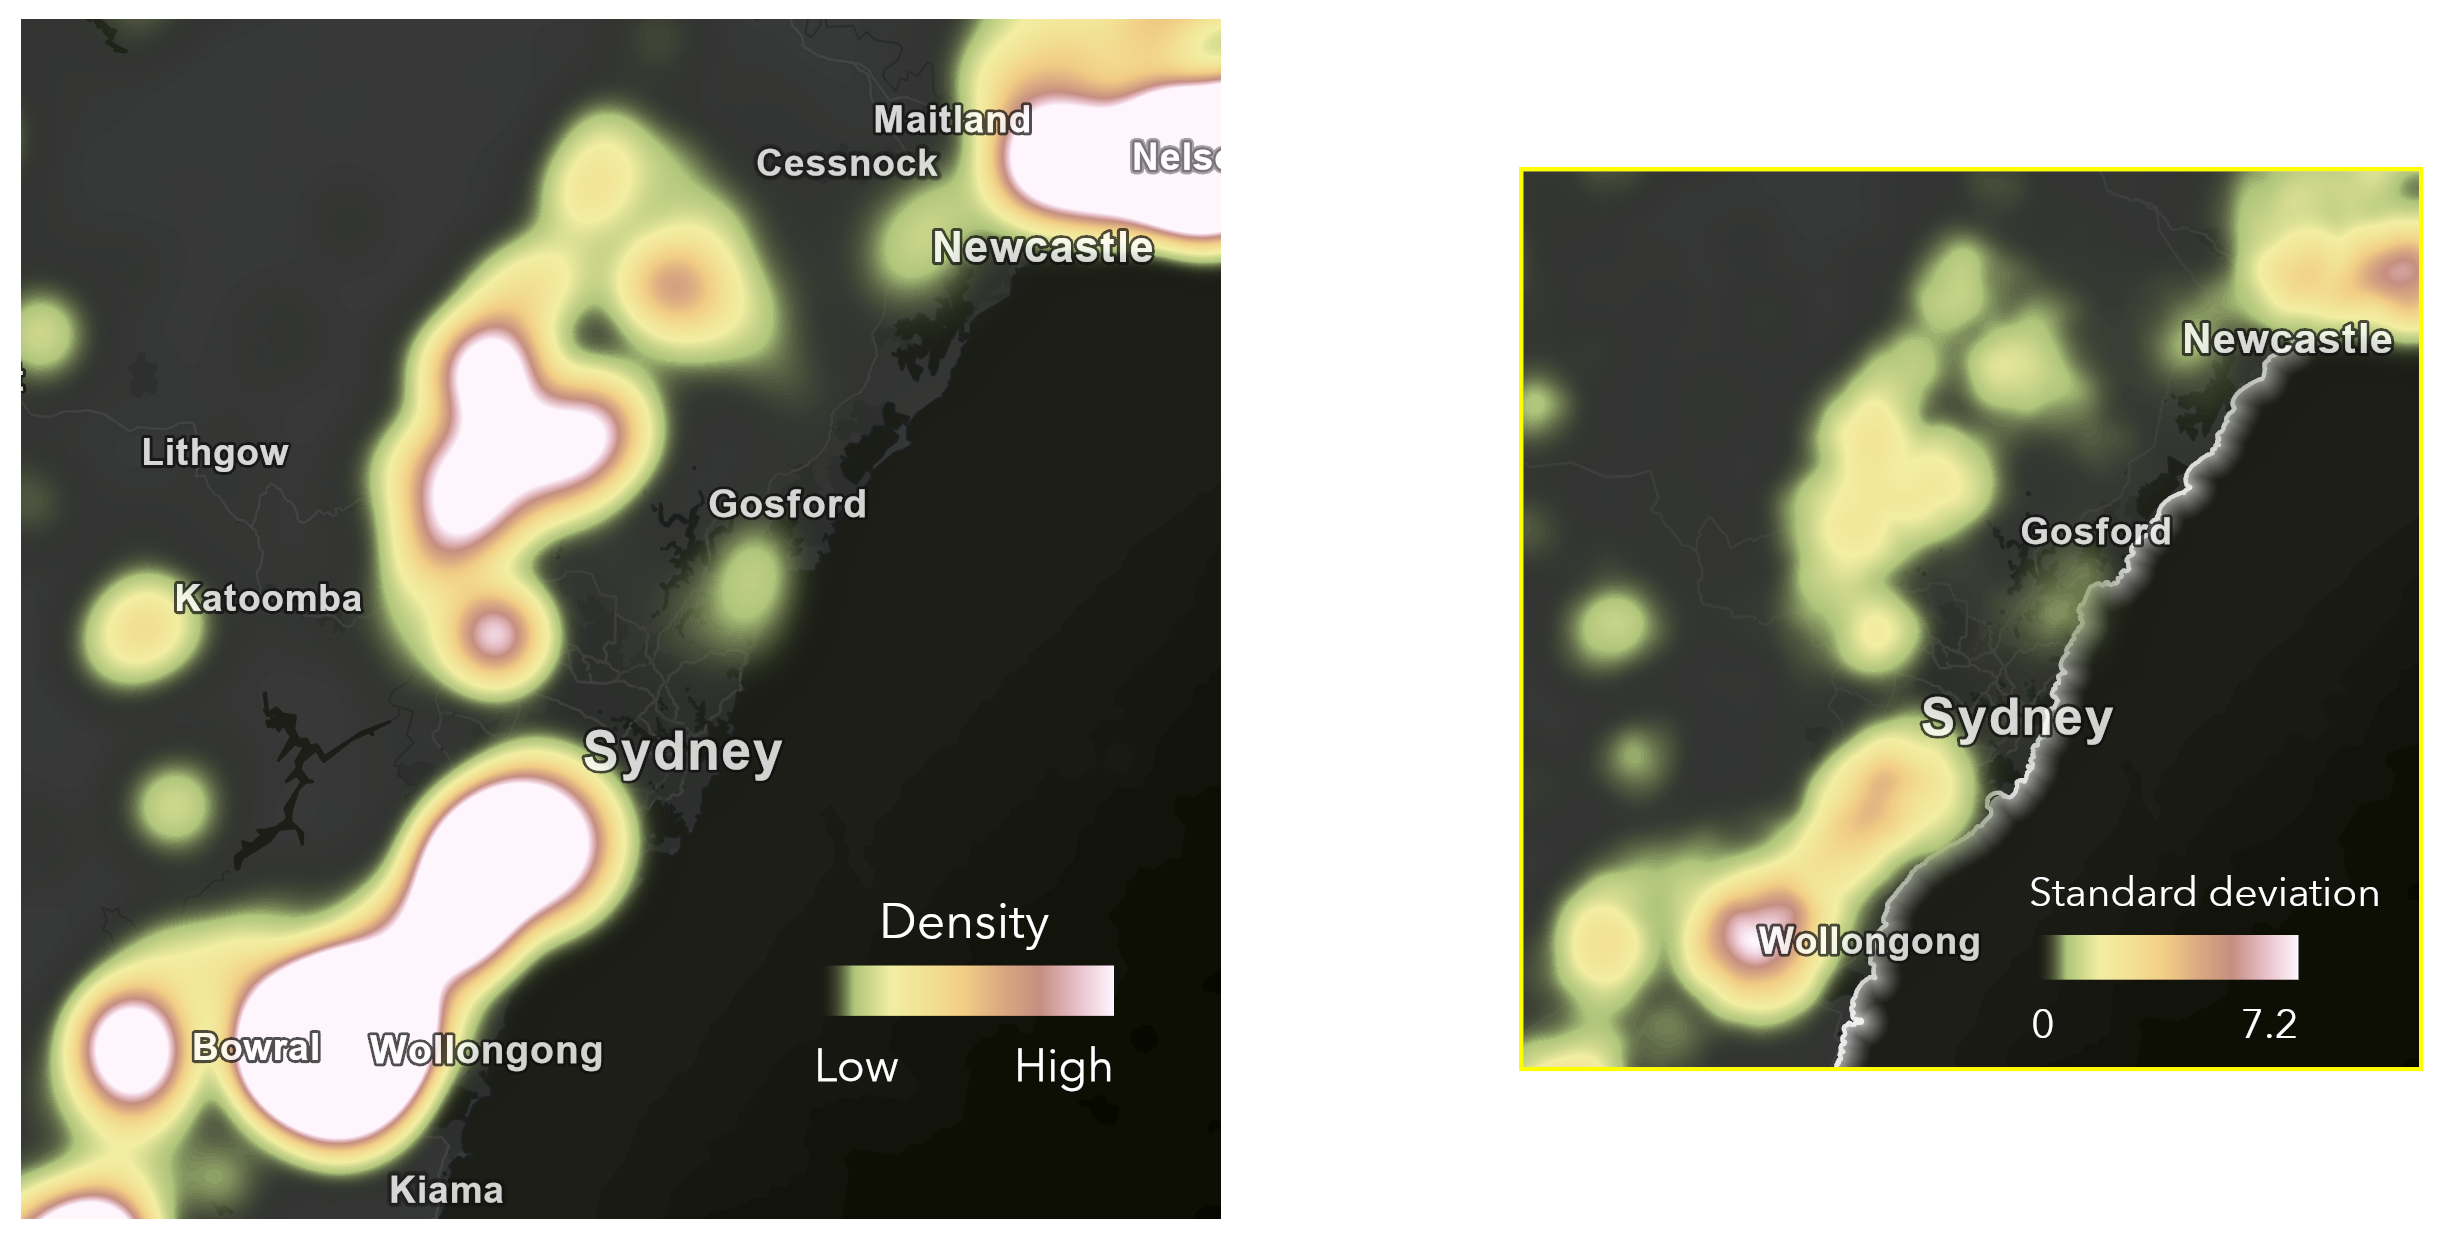
- Generate the mean density, standard deviation, and density probability outputs to evaluate both the estimated density pattern and its uncertainty.
5. Interpret the results.
Areas with low standard deviation and high density probability remain prominent across most simulations, indicating consistent support. Areas with higher standard deviation and lower density probability are more sensitive to uncertainty in the input data and should be interpreted with greater caution.
6. To delineate a conservation boundary, run Volume Percentile Contours at the 90th percentile on the Kernel Density surface from Step 1 and the mean density surface from Step 4.
The contour derived from the probabilistic result may exclude areas that appeared important in the original density map but are not consistently supported when uncertainty is considered.
Conservation agencies and land trusts can focus habitat protection, restoration, and private land conservation agreements on areas that remain important after accounting for uncertainty. Areas with greater uncertainty can be prioritized for additional surveys before conservation resources are committed.
Conclusion
While this example focused on koala conservation, Probabilistic Kernel Density can be applied to many other problems, including species conservation, public health, natural hazard assessment, environmental monitoring, and scientific research. You can improve the accuracy of any workflow that relies on density estimation by understanding how uncertainty in the input data affects the result. By incorporating uncertainty directly into the analysis, you can identify not only where concentration occurs but also how confident you can be in those patterns.
Data source
Koala occurrence records obtained from the Global Biodiversity Information Facility (GBIF) using the Download Species Occurrence Points (GBIF) tool in ArcGIS Pro.
Reference
Global Biodiversity Information Facility (GBIF). Accessed February 2026. Koala (Phascolarctos cinereus) occurrence records for New South Wales (2010–2025).

Commenting is not enabled for this article.