We are excited to share with you some of the important improvements that we did in the Zonal toolset for ArcGIS Pro 2.6 and ArcGIS Image Server 10.8.1 to make your workflows more intuitive and powerful. We have significantly improved and enhanced the geoprocessing tools, the corresponding raster functions, the ArcGIS API for Python and the ArcGIS REST API.
New enhancement in zonal functionalities now included new capabilities, options, and ways of accessing the tools. Read on to learn more about it.
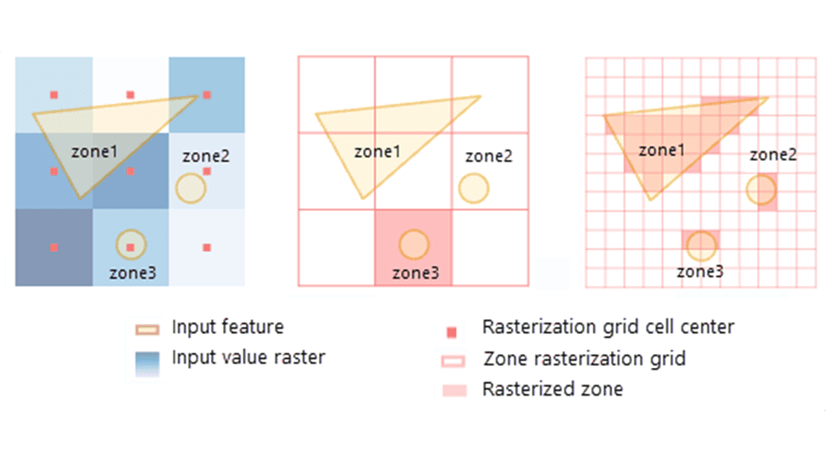
Process overlapping polygon zones
The Tabulate Area tool in ArcGIS Pro 2.6 Spatial Analyst extension now process overlapping zones and calculates area for each individual feature.
Calculate percentile
The zonal statistics tools and the function have an additional statistics type, percentile, to compute extreme events. Using the Zonal Statistics as Table tool, you can also calculate multiple percentile values at one go, as shown below:

This capability can be accessed from:
ArcGIS Pro 2.6 Spatial Analyst and Image Analyst extensions:
-
- Zonal Statistics as geoprocessing tool and function
- Zonal Statistics as Table as geoprocessing tool
ArcGIS Image Server 10.8.1:
-
- Summarize Raster Within as Map Viewer tool, Portal tool in ArcGIS Pro, ArcGIS API for Python and ArcGIS REST API
- Zonal Statistics as Map Viewer function and ArcGIS API for Python
- Zonal Statistics As Table as Portal tool in ArcGIS Pro and ArcGIS REST API
Process multidimensional zone and value rasters
The zonal statistics tools and function can now process both multidimensional zone and value rasters. This capability is enabled by checking the parameter Process as multidimensional, as shown in the example below.

These tools are also available from the Multidimensional ribbon, which was introduced in ArcGIS Pro 2.5.

The zonal operation occurs slice-by-slice between the slices of the zone raster and the slices of the current variable from the value raster. See How the zonal statistics tools work to learn more about the multidimensional processing in these tools.

This capability can be accessed from:
ArcGIS Pro 2.6 Spatial Analyst and Image Analyst extensions:
-
- Zonal Statistics as geoprocessing tool and function
- Zonal Statistics as Table as geoprocessing tool
ArcGIS Image Server 10.8.1:
-
- Summarize Raster Within as Map Viewer tool, Portal tool in ArcGIS Pro, ArcGIS API for Python and ArcGIS REST API
- Zonal Statistics as Map Viewer function and ArcGIS API for Python
- Zonal Statistics As Table as Portal tool in ArcGIS Pro and ArcGIS REST API
See what else is new with multidimensional raster analysis from this blog post: Let’s do data science III: Multidimensional Raster Analysis in ArcGIS Pro
New output table schema
A new table output schema is available for the Tabulate Area and Zonal Histogram tools with ArcGIS Pro 2.6 Spatial Analyst extension, which facilitates further query and analysis on the output tables. In the Tabulate Area tool, you can now choose between representing the input classes as rows or as fields in the output table with the Classes as rows in output table parameter. Similarly, to improve analysis workflows, in the Zonal Histogram tool, you can represent the input zones either as rows or as fields, using the new Zones as rows in output table parameter.

Create histogram
The Zonal Histogram tool in ArcGIS Pro 2.6 Spatial Analyst extension can now create histogram graphs. Just note that the zonal histogram graph is not generated by default. In order to create the graph, first check the Zones as rows in output table parameter and specify an output graph name.

Also, do not forget to check out the What’s New for Spatial Analyst in ArcGIS Pro 2.6 to know about everything that is new with the Spatial Analyst tools.
What else is new in ArcGIS Image Server?
The Zonal Statistics As Table tool is now available in ArcGIS Image Server as a Raster Analysis portal tool and as an ArcGIS REST API task to calculate the values of a raster within the zones of another dataset and report the results to a table.
To learn more about what’s changed in ArcGIS 10.8.1, see What’s new in ArcGIS Image Server.

Article Discussion: